OMI4papps: Optimisation, Modelling and Implementation for Highly Parallel Applications
Abstract
This article reports on first results of
the KONWIHR-II project OMI4papps at the Leibniz Supercomputing Centre (LRZ).
The first part describes Apex-MAP, a tunable
synthetic benchmark designed to simulate the performance of typical scientific applications.
Apex-MAP mimics common memory access patterns
and different computational intensity of scientific codes.
An approach for modelling LRZ’s application mix is given which makes use of
performance counter measurements of real applications running on ”HLRB II”,
an SGI Altix system based on 9728 Intel Montecito dual-cores.
The second part will show how the Apex-MAP benchmark could be used to simulate the performance of two
mathematical kernels frequently used in scientific applications: a dense matrix-matrix multiplication
and a sparse matrix-vector multiplication. The performance of both kernels has been intensively studied on
x86 cores and hardware accelerators. We will compare the predicted
performance with measured data to validate our Apex-MAP approach.
1 Performance Modelling Using the Apex-MAP Benchmark
A simple synthetic benchmark with tunable hardware independent parameters that mimics the behaviour of typical scientific applications is very useful for the evaluation of new hardware platforms for a certain job mix. Mapping application performance data measured on a production system to specific parameter combinations of the synthetic benchmark allows to model the performance of a wide spectrum of applications with a simple approach.
To get insight in the performance patterns of the applications running on HLRB II, samples of the most important hardware counters (currently 25 counters) are taken from all processors in 10 minute intervals and are stored in a huge database at LRZ. Though the measurements do not only include production runs of optimised user codes, but also badly optimised programs and test runs etc., the results give a deep insight into LRZ’s job mix and the typical performance of the system. Details about the measurement process, the sampling method, the database scheme and the data analysis can be found in the LRZ technical report 2006-06 [1].
1.1 The Apex-MAP Benchmark
To synthetically model the performance behaviour of LRZ’s application mix we extended the Apex-MAP benchmark (Application performance characterisation project – Memory Access Probe) originally developed by E. Strohmeier & H. Shang from the Future Technology Group at the Lawrence Berkeley National Lab (LBNL), California [2, 3].
The initial idea of the Apex project is the assumption that the performance behaviour of any scientific application can be characterised by a small set of application-specific and architecture independent performance factors. Combining these performance factors, synthetic benchmarks that avoid any hardware specific model can be designed to simulate typical application performance. Assuming that the combination of memory accesses and computational intensity is the dominant performance factor, the Apex-MAP benchmark simulates typical memory access patterns of scientific applications.
Concerning the regularity of the memory access, the original Apex-MAP benchmark focused on random access patterns inside an allocated memory block. Our implementation also considers strided access patterns, which are common in many scientific applications. The benchmark written in the style of Apex-MAP has the following 6 parameters:
- M
-
The total size of the allocated memory block data in which data accesses are simulated,
- L
-
the vector length of data access, (sub-blocks of length starting at ind[i] are accessed in succession), describes the Spatial Locality,
-
the shape parameter of power distribution function () determines the random starting addresses ind[i], describes the Temporal Locality,
- S
-
the stride width,
- C
-
a parameter used to increase the Computational Intensity by calling the subroutine compute(C),
- I
-
the length of the index buffer ind[].
In the case of strided access only the parameters M, S and C are relevant.
The kernel routine for strided access sums up every S-th element of the allocated memory block data[M].
for (int k = 0; k < M/S; k+=1) {
   W0 += c0*data[k*S];
   W0 += compute(C);
}
To increase the computational intensity, i.e. the ratio of the number of floating point operations and memory accesses, we added calls to the subroutine compute(C):
double compute(int C){
  double s0,s1,s2,s3,s4,s5,s6,s7;
  s0=s1=s2=s3=s4=s5=s6=s7=0.;
  for(int i=1;i<=C;i++){
    dummy(&s0,&s1,&s2,&s3,&s4,&s5,&s6,&s7);
    s0+=(x[0]*y[0])+(x[0]*y[1])+(x[0]*y[2])+(x[0]*y[3])+
        (x[0]*y[4])+(x[0]*y[5])+(x[0]*y[6])+(x[0]*y[7]);
    s1+=(x[1]*y[0])+(x[1]*y[1])+(x[1]*y[2])+(x[1]*y[3])+
        (x[1]*y[4])+(x[1]*y[5])+(x[1]*y[6])+(x[1]*y[7]);
    ...
    s7+=(x[7]*y[0])+(x[7]*y[1])+(x[7]*y[2])+(x[7]*y[3])+
        (x[7]*y[4])+(x[7]*y[5])+(x[7]*y[6])+(x[7]*y[7]);
  }
  return s0+s1+s2+s3+s4+s5+s6+s7;
}
Performance is usually a mixture of hardware and compiler properties. Braces and calls to a dummy routine have been inserted into the compute routine to assure that the 128 floating point operations in the loop body are really executed and not cancelled by optimisations of the compiler. On Itanium the generated assembler code contains 64 consecutive fma (fused multiply-add) instructions which make optimal use of the floating point registers. One 128 Byte cacheline is sufficient to hold the two data arrays x[8] and y[8]. The compute routine is thus able to run with nearly peak performance on Itanium.
In the case of random access patterns M, L, , C and I are the relevant parameters. The kernel routine for random memory access is:
for (i = 0; i < I; i++) {
   for (k = 0; k < L; k++) {
     W0 += c0*data[ind[i]+k];
     W0 += compute(C);
   }
}
In this mode I subblocks of length L are accessed. The vector length L is the number of contiguous memory locations accessed in succession starting at ind[i]. L characterises the spatial locality of the data access. The starting addresses of the subblocks are kept in the index buffer ind[]. This access pattern is illustrated in Fig. 1 (a).
 |
 |
| (a) | (b) |
The starting addresses are random numbers drawn from a power distribution function and are defined as follows:
ind[j] = (L*pow(drand48(), 1/) * (M/L -1)) [0;M-L[
The parameter [0;1] of this distribution function defines the temporal reuse of data. Figure 1 (b) shows the probability distribution of the power function pow(drand48(), 1/). For the random numbers are just deviates with a uniform probability distribution, while the smaller is, the more the distribution function is peaked near 0 and the higher the temporal reuse of data is. For always the same starting address is used.
1.2 Comparison of Apex-MAP with Real Application Performance
To use Apex-MAP for comparing the average memory bandwidth and the floating point performance
of real applications
the Itanium performance counters
FP_OPS_RETIRED, CPU_OP_CYCLES_ALL and L3_MISSES have
been measured and aggregated
for various combinations of the Apex-MAP input parameters.
The L3 cacheline size of the Itanium is 128 Bytes and can hold
16 64-bit (double-precision) values.
The consumed bandwidth between memory
and L3 cache is given by L3_MISSES 128 Bytes.
Figure 2 shows the number of floating point operations per cycle (FP_OPS_RETIRED / CPU_OP_CYCLES_ALL) versus the memory bandwidth, expressed by L3 misses in Bytes/cycle (L3_MISSES/CPU_OP_CYCLES_ALL 128 Bytes). Figure 2 (a) on the left shows this data for real applications running on HLRB II, while Fig. 2 (b) on the right shows data from simulations using the Apex-MAP benchmark with various input parameters.
 |
 |
| (a) | (b) |
For the left picture the hardware counters were sampled every 10 minutes on all processors of HLRB II for approximately 3 days with a sampling time of 10 seconds. More than 3.2 Mio. samples are taken into account. The average floating point operations per cycle for this 3-day interval is 0.48, which is equal to 770 MFlops per core and 12% of the Itanium’s peak performance. The mean for the L3 misses is 0.2 Bytes per cycle.
The parameter space is divided into 32 rectangles of size 0.5 L3 Misses/cycle 0.5 Flops/cycle. The percentage of data points falling into each rectangle is given.
For the right picture around 23000 different combinations of the Apex-MAP benchmark are used. This picture includes various runs, using both random and strided memory access as well as serial and parallel runs using OpenMP to cover the same areas as the measured data on the left. The range of the simulation parameters for Fig. 2 (b) is GB, , , , I=50.
The two pictures demonstrate that it is possible to model the performance of real applications by using suitable combinations of input parameters for the Apex-MAP benchmark. Comparing the two pictures shows that every region in the left picture with significant percentage (i.e. above 0.5%) of data points can be covered by a specific combination of Apex-MAP input parameters. In total, the Apex-MAP runs are able to cover 98.9% of the measured real-application performance data.
The measurements in the left picture are partly based on MPI-parallelised programs. Performance counters are only implicitly able to measure the impact of additional communication overheads, e.g. waiting time for external data on remote processors. Although Apex-MAP focuses on single processor performance it is able to mimic the behaviour of parallel applications as long as the network characteristics stay roughly the same.
1.3 Modelling LRZ’s Application Mix
It has been shown that Apex-MAP is able to cover the parameter space that is attained by real applications. It is assumed that Fig. 2 (a) gives a general overview of the application mix running on HLRB II. A good indication for this is given by the fact that the mean MFlops-rate for this 3-day interval is 770 MFlops per core or 12% of peak performance, which is a good approximation of the overall mean application performance of HLRB II (see also [4]). Therefore the weights associated with each rectangle (percentages in Fig. 2 (a)) are used to model the general application mix.
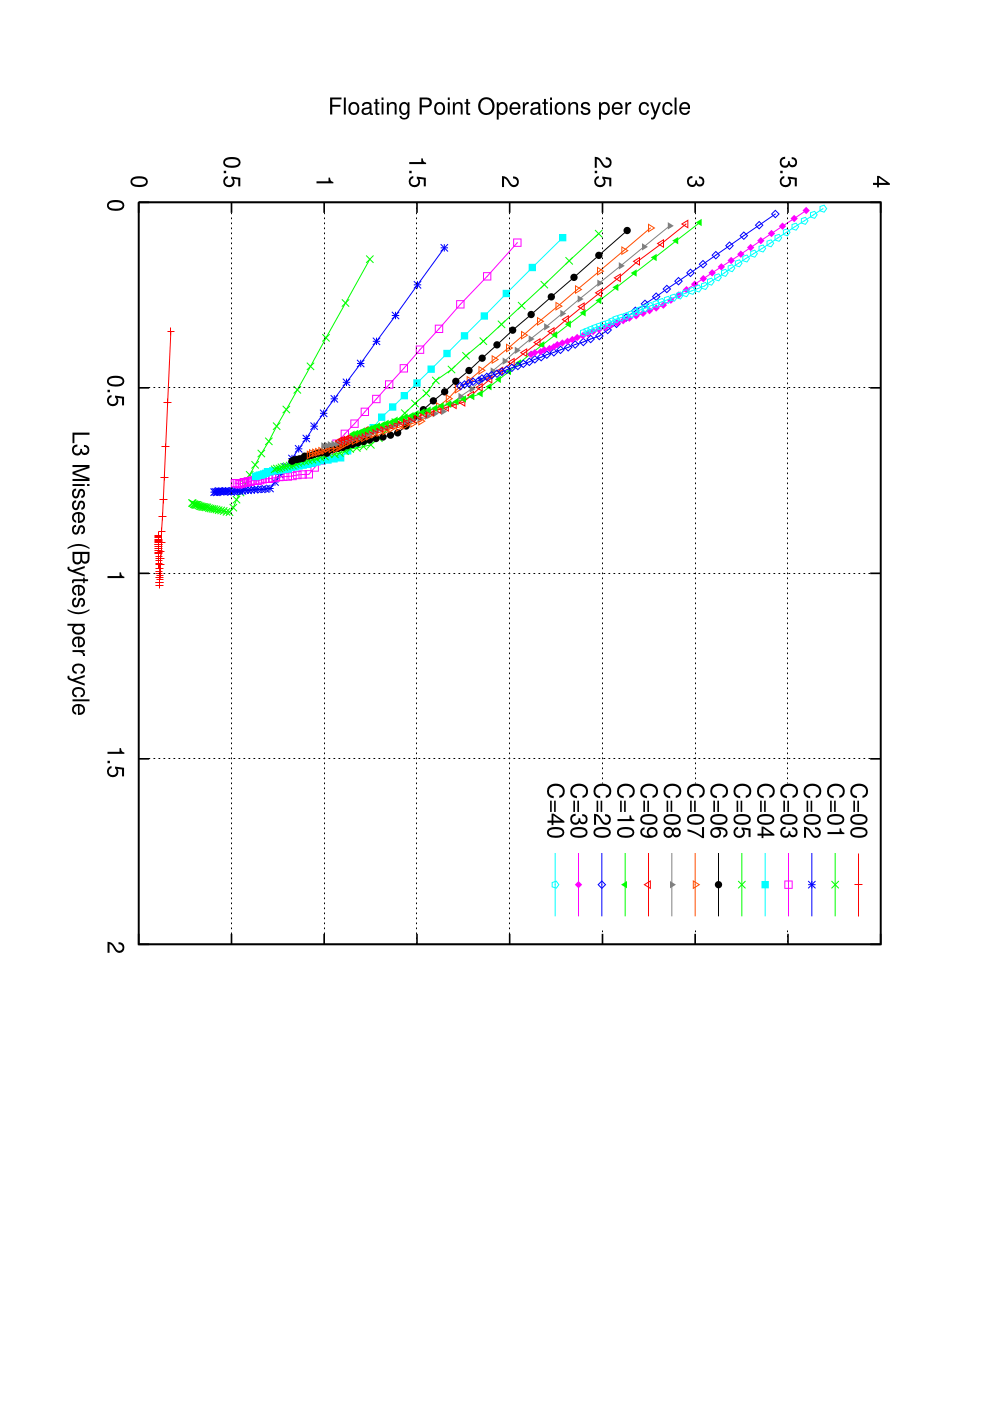
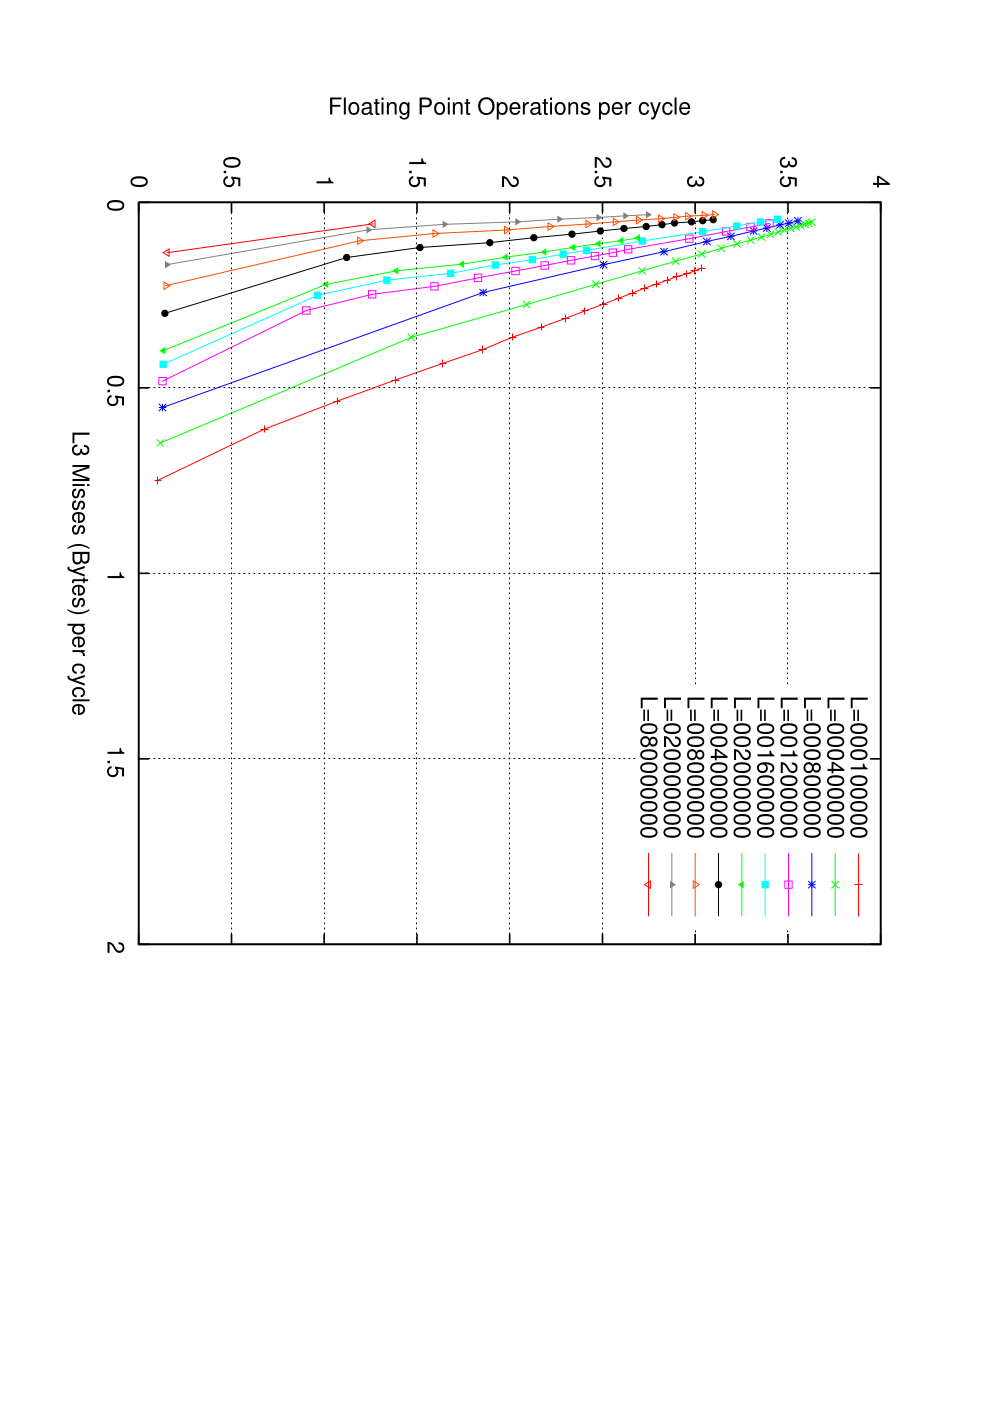
Besides the weights for each rectangle, the most suitable combinations of input parameters for Apex-MAP needs to be found. Figure 3 shows the achievable combinations of Flops versus L3 Misses for different versions of the strided access (a) and random access (b) memory patterns using a serial version of the code. Figure 3 (a) visualises the common understanding of the influence of a stride memory access to performance. Every line corresponds to an increase in computational intensity C. As long as the computational intensity is low (e.g., C stays small), only 1 Flop per clock cycle is possible (which is equal to 25% of peak performance). As the computational intensity grows larger, the codes are able to run at maximum speed with nearly 4 Flops in every cycle. As said before, the L3 cacheline size of the Itanium is 128 Bytes; 16 doubles fit in one cacheline. Therefore with an increase in stride along each line from 1 (contiguous access) to 16 (access only one item per cache line), the performance drops and stays at a minimum for figures above 16 which always need a new cache line.
 |
 |
| (a) | (b) |
Figure 4 shows the data points that have been chosen to model the application mix of LRZ. The corresponding Apex-MAP input parameters multiplied with the derived weights are being used to compute an overall performance of the application mix in MFlops. Running the adapted Apex-MAP benchmark on HLRB II yields a performance estimate of 898 MFlops per core. This is quite close to the actual application performance on HLRB II: 14% deviation from the measured 3-day interval.

2 Validation Using the EuroBen Mathematical Kernels
The validation of our Apex-MAP version will be done by using two mathematical kernels typical for many scientific applications. Within the EC FP7 funded project ”Partnership for Advanced Computing in Europe” (PRACE, [5]), several mathematical kernels from the EuroBen benchmark suite [8] have been chosen as templates for commonly used scientific applications. To validate Apex-MAP two very distinct codes have been chosen:
- •
mod2am, a dense matrix-matrix multiplication,
- •
mod2as, a sparse CSR (compressed sparse row) matrix-vector multiplication.
Within PRACE these codes have been ported to several new languages and architectures; results will be published on the PRACE website in deliverable D6.6 and D8.3.2 [6]. The PRACE surveys analysed the current standards for parallel programming and their evolution, PGAS languages, the languages introduced as a consequence of the DARPA HPCS project and the languages, paradigms and environments for hardware accelerators. Performance data has been gathered for various architectures.
The performance of these benchmarks is well known; many different performance runs have been measured, suitable reference input data sets exists and LRZ was responsible for the MKL, CUDA and RapidMind ports. The first benchmark mod2am has a high computational intensity and is well suited for the use of highly multi-threaded devices. The second benchmark has a low computational intensity and is a template for codes which will benefit from a higher memory bandwidth. Using these benchmarks will ensure that Apex-MAP is able to model the two extremes in terms of computational intensity versus memory access and will allow to validate Apex-MAP for the use on hardware accelerators in the future.
2.1 mod2am: Dense Matrix-Matrix Multiplication
Several PRACE implementations of the matrix-matrix multiplication are based on the BLAS Level 3 routine dgemm. For the x86 implementation the cblas_dgemm routine from Intel’s MKL (Math Kernel Library) has been used; the CUDA implementation is based on cuBLAS. The RapidMind implementation uses a code-example from the RapidMind developer portal [9] for a general matrix-matrix multiplication code which was slightly adapted. This code is optimised for the use on GPUs.
Figure 5 shows performance measurements from the PRACE project. It compares the performance of the CUDA and RapidMind implementations on an Nvidia C1060 GPU, which is used in Nvidia’s Tesla boxes, with the performance of an MKL version on 8 Intel Nehalem EP cores. The reference input data sets are those from PRACE which operate on quadratic matrices. They are described in Deliverable D6.6 available from [6] and have been chosen to firstly, represent frequently used problem sizes and secondly, show the dependency between problem size and performance, especially on hardware accelerators. The double-precision peak performance of one C1060 (78 GFlops) is comparable to 8 Nehalem cores (80 GFlops). The diagram shows that the RapidMind implementation is a factor of 4 slower than the highly optimised cuBLAS library. However, the RapidMind implementation follows roughly the same trend as the CUDA version.


2.2 mod2as: Sparse Matrix-Vector Multiplication
In the case of the mod2as benchmark the input matrix is stored in the 3-array variation of the CSR (compressed sparse row) format. Using this format only the nonzero elements of the input matrix are stored in one array, and the other two arrays contain information to compute the row and the column of the nonzero elements. The entries of the input matrix are computed using a random number generator but could be reproduced for several runs by using the same seed.
Figure 6 compares the performance of the RapidMind implementation
with the CUDA and MKL version. The MKL version makes use of a library call
to
mkl_dcsrmv. The CUDA
implementation is based on the paper ”Efficient Sparse Matrix-Vector
Multiplication on CUDA” [10]. A description of the RapidMind implementation
can be found in Deliverable D8.3.2 at [6].
Again, the reference input data sets from PRACE have been used; all data sets contain quadratic matrices of
different sizes and fill ratios. The diagram shows that the RapidMind version
is a factor of 3 slower than the optimised CUDA version. The trend of both is very similar.
2.3 Validation of Apex-MAP
 |
 |
| (a) | (b) |
Validating Apex-MAP by using the two mathematical kernels needs several steps:
- 1.
Measure the performance of mod2am/as on the original hardware (HLRB II).
- 2.
Measure the hardware counters for mod2am/as on HLRB II.
- 3.
Generate weights for each rectangle and each kernel.
- 4.
Measure the performance of mod2am/as on the target hardware (Nehalem EP).
- 5.
Run Apex-MAP with the weights for mod2am/as on Nehalem and HLRB II.
- 6.
Compare the predicted results (Step 5) with the actual results (Steps 1 and 4).
Step 1 yields a mean performance on HLRB II for all reference input data sets of 5.4 GFlops per core for mod2am (84% of peak) and 0.5 GFlops for mod2as (8% peak). Figure 7 shows the hardware counter measurements done in Step 2 and the derived weights for the Apex-MAP runs (Step 3): It can be clearly seen, that the dense matrix-matrix multiplication (a) is compute bound while the sparse matrix-vector multiplication (b) is memory bound.
Step 4 shows an actual performance on the target architecture Nehalem EP of 8.0 GFlops (80%) for mod2am and 0.9 GFlops (9%) for mod2as. The results of Step 5 can be seen in Fig. 8; the mean performance predicted by Apex-MAP deviates only slightly from the measured data on both architectures. The measurements on Nehalem are slightly worse, since the compute routine, which has been optimised for Itanium is not able to reach peak performance on Nehalem.
 |
 |
| (a) | (b) |
 |
 |
| (c) | (d) |
3 Conclusion and Outlook
It has been shown that an adaptation of the Apex-MAP benchmark can be used to model the application mix in order to use it for benchmarking the suitability of new architectures for a computing centre. The adapted benchmark has been validated by using it to predict the performance of two mathematical kernels on two architectures.
Future work will go mainly into two directions. Firstly we want to investigate in more detail the quality of the predictions to refine the benchmark and ensure that it adapts easily to new environments. Secondly we want to use Apex-MAP to investigate if hardware accelerators are advantageous for our application mix. Hardware accelerators like GPUs and the CELL processor with an enormous peak performance have recently gained much interest in the community. A programming model that was evaluated at LRZ is the multi-core development platform RapidMind, which is a tool that allows generating code for GPUs, the CELL processor and multi-core CPUs with the same source file. Using a RapidMind version of the Apex-MAP benchmark could offer an easy way to simulate typical application performance patterns on a broad range of architectures. RapidMind ports of the two mathematical kernels are already available and could be used to validate a RapidMind Apex-MAP version.
Acknowledgment
This work was financially supported by the KONWIHR-II project “OMI4papps” and by the PRACE project funded in part by the EU’s 7th Framework Programme (FP7/2007-2013) under grant agreement no. RI-211528.
References
- (1) R. Patra, M. Brehm, R. Bader, R. Ebner, S. Haupt, Performance Monitoring – A Generic Approach (LRZ-Bericht 2006-06) http://www.lrz-muenchen.de/wir/berichte/TB/LRZ-Bericht-2006-06.pdf
- (2) https://ftg.lbl.gov/ApeX/ApeX.shtml
- (3) E. Strohmaier, H. Shan, Architecture Independent Performance Characterisation and Benchmarking for Scientific Applications, https://ftg.lbl.gov/ApeX/mascots.pdf
- (4) http://www.lrz-muenchen.de/services/compute/hlrb/betriebszustand/hlrb2\_4weeks.html
- (5) http://www.prace-project.eu/
- (6) http://www.prace-project.eu/documents/public-deliverables-1/
- (7) http://www.rapidmind.com/
- (8) http://www.euroben.nl/
- (9) https://developer.rapidmind.com/sample-code/matrix-multiplication-samples/rm-sgemm-gpu-5938.zip
- (10)
N. Bell, M. Garland, Efficient Sparse Matrix-Vector Multiplication on CUDA
http://www.nvidia.com/object/nvidia\_research\_pub\_001.html