Near-IR dust and line emission from the central region of Mrk 1066: Constraints from Gemini NIFS
Abstract
We present integral field spectroscopy of the inner pc2 of the Seyfert galaxy Mrk 1066 obtained with Gemini’s Near-Infrared Integral Field Spectrograph (NIFS) at a spatial resolution of 35 pc. This high spatial resolution allowed us to observe, for the first time in this galaxy, an unresolved dust concentration with mass . This unresolved concentration, with emission well reproduced by a blackbody with temperature 830 K, is possibly part of the nuclear dusty torus. We compared maps of emission-line flux distributions and ratios with a 3.6 cm radio-continuum image and [O iii] image in order to investigate the origin of the near-infrared emission. The emission-line fluxes are elongated in PA in agreement with the [O iii] and radio images and, except for the H lines, are brighter to the north-west than to the south-east. This close association with the radio hot spot implies that at least part of the emitting gas is co-spatial with the radio outflow. The H emission is stronger to the south-east, where we find a large region of star-formation. The strong correlation between the radio emission and the highest emission-line fluxes indicates that the radio jet plays a fundamental role at these intensity levels. At lower emission-line fluxes this correlation disappears suggesting a contribution from the plane of the galaxy to the observed emission. The H2 flux is more uniformly distributed and has an excitation temperature of K. Its origin appears to be circum-nuclear gas heated by X-rays from the central active nucleus. The [Fe ii] emission also is consistent with X-ray heating, but its spatial correlation with the radio jet and [O iii] emission indicates additional emission due to excitation and/or abundance changes caused by shocks in the radio jet. The coronal-line emission of [Ca viii] and [S ix] are unresolved by our observations indicating a distribution within 18 pc from the nucleus. The reddening map obtained via the Pa/Br line ratio ranges from to with the highest values defining a S-shaped structure along PA135/315∘. The emission-line ratios are Seyfert-like within the ionization cone indicating that the line emission is powered by the central active nucleus in these locations. Low ionization regions are observed away from the ionization cone, and may be powered by the diffuse radiation field which filters through the ionization cone walls. Two regions at 05 south-east and at 1′′ north-west of the nucleus show starburst-like line ratios, co-spatial with an enhancement in the emission of the H lines. We attribute this change to additional emission from star forming regions. The mass of ionized gas is and that of hot molecular gas is .
Keywords:
galaxies: individual (Mrk 1066) – galaxies: Seyfert – galaxies: ISM – infrared: galaxies1 Introduction

The study of the gas distribution and excitation in the Narrow Line Region (NLR) of active galaxies has a fundamental importance in the understanding of the physical phenomena in the vicinity of the super-massive black holes (SMBH) in their centers. The excitation of the inner NLR can reveal how the radiation and mass outflows from the active galactic nucleus (AGN) interact with the surrounding inter-stellar medium (ISM). Several studies have been aimed to investigate the line emission from the NLR gas (Rodríguez-Ardila et al., 2004; Rodríguez-Ardila, Riffel & Pastoriza, 2005a; Riffel et al., 2006; Riffel et al., 2008; Riffel et al., 2009a; Stoklasová et al, 2009; Storchi-Bergmann et al., 2009; Barbosa et al., 2009, e.g.). Nevertheless, its physics is still not completely understood.
Besides the line emission, the nature of the nuclear continuum emission is an important issue in the study of AGNs. In particular, the study of near-infrared (hereafter near-IR) continuum can be used to probe the emission from hot dust located in the putative torus postulated by the Unified Model (Antonucci, 1993). Several studies revealed the presence of hot dust with temperatures of K and masses of (Rieke & Lebofsky, 1981; Rodríguez-Ardila, Contini & Viegas, 2005b; Rodríguez-Ardila & Mazzalay, 2006; Riffel et al., 2009a; Riffel et al., 2009b; Riffel et al., 2009c, e.g.). The high spatial resolution provided by adaptive optics spectroscopy in large telescopes can be used to constraint the location of the near-IR emitting dust (Riffel et al., 2009b, e.g.).
This work is aimed to investigate the near-IR emission-line flux distributions, gas excitation and continuum emission within the inner kiloparsec of Mrk 1066 from spectroscopy obtained with the Gemini’s Near-Infrared Integral Field Spectrograph (McGregor et al., 2003, NIFS,). In a following paper we discuss the kinematics of both the gas and stars. Mrk 1066 was selected for this study because it presents extended radio (Ulvestad & Wilson, 1989; Nagar et al., 1999, e.g) and near-IR line emission (Rodríguez-Ardila, Riffel & Pastoriza, 2005a; Knop et al., 2001, e.g.) allowing us to investigate the role of the radio jet in the emission of the NLR gas. In addition, its central kpc has a high extinction in the optical (Stoklasová et al, 2009, e.g.) and thus a near-IR study is better suited for the investigation of the gas excitation and kinematics.

Mrk 1066 is an SBO+ galaxy harboring a Seyfert 2 nucleus; it is located at a distance of 48.6 Mpc11 1 Distance quoted in NASA/IPAC Extragalactic Database (NED – http://nedwww.ipac.caltech.edu), for which 1′′ corresponds to 235 pc at the galaxy. Hubble Space Telescope (HST) narrow-band images show a “jetlike” feature in the [O iii]H emission extending up to 14 north-west from the nucleus along the position angle PA=315∘, while the H+[N ii] image is extended to both sides of the nucleus (Bower et al., 1995). Radio continuum images of Mrk 1066, at 3.6, 6 and 20 cm, show extended emission up to 15 to both sides of the nucleus oriented approximately along the same PA of the optical line emission (Ulvestad & Wilson, 1989; Nagar et al., 1999). Long slit spectroscopy shows that the near-IR emission lines are extended up to 5′′ from the nucleus along the PA=135/315∘ with distinct flux distributions for [Fe ii], H2 and H recombination lines suggesting different emission processes (Knop et al., 2001).
This paper is organized as follows: In Section 2 we present the description of the observations and data reduction. In Sec. 3 we present the results for the continuum and line emission, as well as line-ratio maps. The discussion of the results is presented in Sec. 4 and the conclusions are presented in Sec. 5.
2 Observations and Data Reduction
2.1 The Gemini NIFS data
The Integral Field Unit (IFU) spectroscopic data of Mrk 1066 were obtained with Gemini NIFS (McGregor et al., 2003) operating with the Gemini North Adaptive Optics system ALTAIR in September 2008 under the programme GN-2008B-Q-30. The NIFS has a square field of view of , divided into 29 slices with an angular sampling of 01030042, optimized for use with ALTAIR.
The observing procedure followed the standard Object-Sky-Sky-Object dither sequence, with off-source sky positions since the target is extended, and individual exposure times of 600 s. Two set of observations were obtained at different spectral ranges: the first at the J-band, centered at 1.25 m and covering the spectral region from 1.15 m to 1.36 m, and the second at the Kl-band, centered at 2.3 m covering the spectral range from 2.10m to 2.26m. At the J-band, the selected instrument configuration was the J_G5603 grating and ZJ_G0601 filter resulting in a spectral resolution of , as obtained from the measurement of the full width at half maximum (FWHM) of arc lamp lines. The Kl-band observations were done using the Kl_G5607 grating and HK_G0603 filter and resulted in a spectral resolution of FWHM.
The total exposure time at each band was 4800 s, consisting of 8 individual on-source exposures. A small spatial dithering of 01 was applied between on-source exposures in order to correct the data from bad pixels.The FWHM of the spatial profile of the star was 013002 for the J-band and 015003 for the Kl-band.
The data reduction was accomplished using tasks contained in the nifs package which is part of gemini iraf package as well as generic iraf tasks. The data reduction followed the standard procedure, which includes the trimming of the images, flat-fielding, cosmic ray rejection, sky subtraction, wavelength and s-distortion calibrations. In order to remove telluric absorptions from the galaxy spectra we observed the standard star HIP 15925 just after the J-band observations of the galaxy and HIP 10559 just before the Kl-band observations. The galaxy spectra was divided by the normalized spectrum of the tellurc standard star using the nftelluric task of the nifs.gemini.iraf package. The galaxy spectra were flux calibrated by interpolating a blackbody function to the spectrum of the telluric standard and the J and Kl-bands data cubes were constructed with an angular sampling of 005005 for each individual exposure. Finally the individual data cubes were combined using a sigma clipping algorithm in order to eliminate bad pixels and remainding cosmic rays by mosaicing the dithered spatial positions. The final J and Kl data cubes contain about 4200 individual spectra and cover the central 33′′, corresponding to 700700 square parsecs at the galaxy.
2.2 The 3.6 cm radio image
The 3.6 cm Very Large Array (VLA) radio image was made using data taken on 31 December 1992, initially published in Nagar et al. (1999), and reprocessed as described in Mundell et al. (2009).
3 Results
In the top-left panel of Fig. 1 we present a large scale -band image of Mrk 1066 from the Palomar Observatory Sky Survey (Lasker et al., 1996). In the top-right panel we present an image obtained from the NIFS data cube for the continuum around 2.22m. In the bottom panels we present two characteristic IFU spectra: the nuclear one and a spectrum from a location at 05 north-west of the nucleus. In the J-band we identified the [P ii] emission lines at 1.14713 and 1.18861 m, the [Fe ii] emission lines at 1.25702, 1.27912, 1.29462, 1.29812, 1.32092 and 1.32814 m, the H i Pa1.28216 m, the He ii line at 1.16296 m and the [S ix] coronal line at 1.25235 m at the nucleus. The H2 emission lines at 2.12183, 2.15420, 2.22344, 2.24776, 2.40847, 2.41367, 2.42180, 2.43697 and 2.45485 m are identified in the K-band spectra, as well as the H i Br2.16612 m, the He i 2.14999 m and the [Ca viii] 2.32204 m coronal line at the nucleus. In the K-band spectra we have also identified the CO stellar absorption band heads around 2.3 m.
3.1 The continuum emission
Figure 2 presents optical and near-IR continuum images of the central 33′′ of Mrk 1066. The top left panel shows an optical image obtained with the HST Wide Field Planetary Camera 2 (WFPC2) through the filter F606W (Malkan, Gorjian & Tam, 1998). This image presents two spiral arms oriented approximately along PA=128∘ (approximately coincident with the major axis of the galaxy), which extend up to 12 to both sides of the nucleus. Along the spiral arms there are several knots with enhanced emission. This image is in good agreement with the optical continuum images presented by Bower et al. (1995).
In the top right panel of Fig. 2 we present an HST H-band image obtained with the Near Infrared Camera and Multi-Object Spectrometer (NICMOS) through the filter F160W (proposal ID 7330 by J. S. Mulchaey).In the bottom panels of Fig. 2 we present the J and Kl-band continuum images obtained from the NIFS data cubes by averaging continuum regions centered at 1.23m and 2.22m.The near-IR continuum is more extended along PA=128∘, which is similar to the orientation of the spiral arms observed in the optical continuum and approximately the orientation of the major axis of the galaxy. The spiral arms can also be seen in the near-IR, although with “less contrast” than in the optical, probably due to the stronger effect of the dust and contribution of line emission in the optical. A comparison between the J and K continuum shows that the extra-nuclear emission is bluer than the nuclear one, indicating the presence of dust nucleus. This behavior can be observed in Fig. 3, which presents a K/J continuum ratio map obtained from the NIFS data cubes by averaging the flux within spectral window of 50 Å in regions free of emission and absorption lines centered at 2.22 m and 1.23m.

3.2 Emission-line flux distributions
As shown in Fig. 1, several emission lines can be observed in the spectra. Table 1 presents the measured fluxes for the emission lines within an aperture of 025025 at the four positions identified in the top-right panel of Fig. 1: the nucleus, position A at 05 north-west from the nucleus, position B at 05 south-east and position C at 05 north-east from the nucleus. Most emission lines peak at the nucleus, except for [Fe ii] and [P ii] which peak at 05 north-west of the nucleus.
| ID | Nucleus | A | B | C | |
|---|---|---|---|---|---|
| 11471.3 | [P ii] | 5.072.23 | 2.750.71 | 1.500.47 | – |
| 11629.6 | He ii | 2.411.52 | 0.990.32 | 0.670.13 | – |
| 11886.1 | [P ii] | 6.210.69 | 6.540.87 | 2.800.38 | 0.410.28 |
| 12523.5 | [S ix] | 0.600.37 | – | – | – |
| 12570.2 | [Fe ii] | 18.880.80 | 21.151.82 | 13.060.95 | 5.761.21 |
| 12706.9 | [Fe ii] | 0.520.41 | 0.960.38 | 0.430.17 | 0.140.11 |
| 12712.1 | [Fe iv] ? | 0.210.19 | – | – | – |
| 12791.2 | [Fe ii] | 0.940.35 | 1.340.65 | 1.270.32 | 0.360.25 |
| 12821.6 | H i Pa | 41.184.26 | 25.171.98 | 26.411.98 | 6.790.55 |
| 12946.2 | [Fe ii] | 1.910.87 | 1.710.16 | 0.820.29 | 0.700.13 |
| 12981.2 | [Fe ii] | 1.720.55 | 0.530.22 | 0.940.23 | 0.460.29 |
| 13209.2 | [Fe ii] | 4.990.73 | 6.320.64 | 4.030.52 | 2.210.26 |
| 13281.4 | [Fe ii] | 1.541.05 | 1.310.59 | 0.540.40 | – |
| 21218.3 | H22 1-0S(1) | 13.411.02 | 11.740.49 | 5.270.48 | 2.520.11 |
| 21499.9 | He i | 0.400.21 | 0.110.21 | 0.270.19 | 0.180.07 |
| 21542.0 | H2 1-0 S(2) | 0.510.23 | 0.450.50 | 0.25 0.18 | 0.160.04 |
| 21661.2 | H i Br | 17.141.16 | 10.590.60 | 9.810.53 | 1.280.08 |
| 22234.4 | H2 1-0 S(0) | 2.990.92 | 2.630.64 | 1.960.72 | 0.650.06 |
| 22477.6 | H2 2-1 S(1) | 1.470.62 | 1.170.38 | 0.670.33 | 0.330.02 |
| 23220.4 | [Ca viii] | 4.641.42 | – | – | – |
| 24084.7 | H2 1-0 Q(1) | 10.041.33 | 8.140.45 | 4.820.86 | 1.420.11 |
| 24136.7 | H2 1-0 Q(2) | 3.030.47 | 2.470.42 | 1.470.41 | 0.490.10 |
| 24218.0 | H2 1-0 Q(3) | 10.611.05 | 8.320.57 | 5.230.56 | 1.500.21 |
| 24369.7 | H2 1-0 Q(4) | 2.731.45 | 2.260.38 | 1.300.48 | 0.470.09 |
| 24548.5 | H2 1-0 Q(5) | 7.082.18 | 5.410.43 | 2.820.77 | 4.362.24 |

In order to map the gas emission we have integrated the flux under the emission-line profiles and subtracted the underlying continuum obtained from two spectral windows, one from each side of the profile. Figure 4 presents the resulting flux maps. For most emission lines, the highest intensity levels most extended along PA, which is the orientation of the radio structure. A detailed inspection of each panel reveals distinct structures for each ionization level. The [P ii], [Fe ii] and H2 emission lines are 2 times brighter to the north-west than to the south-east, while Pa and Br are approximately equally bright to both sides of the nucleus. The peak fluxes of the [P ii] and [Fe ii] emission lines occur at 085 north-west of the nucleus, approximately at the same position where there is a hot spot in the radio map. The H i recombination-line emission peaks at the nucleus and presents a secondary peak at 05 south-east from it. Another difference between the H i and [Fe ii] emission lines is that the flux distribution of the latter traces the radio structure better than the former. The H2 emission also presents a peak at the nucleus and a secondary peak at 065 north-west of the nucleus, in a region between the nucleus and the radio hot spot. The emission in the coronal lines of [Ca viii]2.3220m and [S ix] m are unresolved by our observations.
3.3 Line-ratio maps

In order to investigate the excitation mechanisms of the [Fe ii] and H2 emission lines we constructed flux ratio maps, shown in Figure 5. In this figure we also present a reddening map obtained from the Pa/Br line ratio as
| (1) |
where and are the fluxes of and emission lines, respectively. We have used the reddening law of Cardelli, Clayton & Mathis (1989) and adopted the intrinsic ratio corresponding to case B recombination (Osterbrock & Ferland, 2006). The resulting map is shown in the top left panel of Fig. 5. The highest values are observed in a S-shaped structure, resembling the spiral arms observed in the continuum image overlaid as thick contours on the reddening map. Typical values within this structure are , with several knots of higher values reaching . In regions away from the center of the S-shaped structure the reddening decreases to or bellow. The errors in are approximately 0.15.
A comparison between the emission-line reddening and the continuum ratio map is shown in Fig. 3. The thick contours, representing the reddening map, show that the S-shaped structure is also present in the continuum ratio map as a region of higher K/J ratio. In order to estimate the reddening in the continuum, we note that, from Fig. 3, a continuum ratio (K/J)0.4 corresponds to the locations with in the gas. If the higher (K/J)2 ratio along the S-shaped structure is due to reddening, the corresponding can be calculated from
| (2) |
where , where , and for the extinction law of Cardelli, Clayton & Mathis (1989). Using measured in the S-shaped structure (from Fig. 3) we obtain reddening for the continuum of , which is somewhat smaller than the one observed for the emitting gas (top-left panel of Fig. 5). Nevertheless, right at the nucleus the K/J ratio is much higher than in the rest of the S-shaped structure, what indicates that it is not due to reddening. The nature of this redder continuum will be discussed in Sec. 4.1.
In the top-right panel of Fig. 5 we present the [Fe ii]1.2570m/Pa intensity ratio, which can be used to investigate the excitation mechanism of the [Fe ii] emission. Seyfert galaxies present typical values for this ratio between 0.6 and 2.0. (Riffel et al., 2006; Rodríguez-Ardila et al., 2004; Rodríguez-Ardila, Riffel & Pastoriza, 2005a; Storchi-Bergmann et al., 2009, e.g.). The smallest value observed in Mrk 1066 is [Fe ii]1.2570m/Pa at 03 south-east from the nucleus, while the highest values are observed in regions located at distances larger than 1′′, reaching values of up to 1.5.
Another line ratio that can be used to investigate the [Fe ii] excitation mechanism is [Fe ii]1.2570m/[P ii]1.8861m (Oliva et al., 2001; Storchi-Bergmann et al., 2009, e.g.). We present this ratio in the bottom-left panel of Fig. 5. The lowest values of are observed at the nucleus and in regions to north-west at small distances from the nucleus, while the highest values up to 9.5 are observed at larger distances from the nucleus.
In the bottom-right panel of Fig. 5 we present the H2.1218m/Br ratio map, which is useful to investigate the excitation of the H2 emitting gas. This ratio presents values ranging from 0.6 to 2 for Seyfert galaxies (Riffel et al., 2006; Rodríguez-Ardila et al., 2004; Rodríguez-Ardila, Riffel & Pastoriza, 2005a; Storchi-Bergmann et al., 2009, e.g.). In Mrk 1066, the lowest values of are observed at 1′′ north-west from the nucleus and the highest values of up to 2.6 are observed at distances of 07 in regions away from the radio structure. Another region of small values () is observed at 05 south-east of the nucleus, approximately coincident with the secondary peak observed in the H i recombination-lines flux maps (see Fig. 4), while at the nucleus H2.1218m/Br.
4 Discussion
4.1 Dust emission
As observed in Fig. 3 (see also Figs. 1 and 2) the extra-nuclear continuum is bluer than the nuclear continuum. At the nucleus the ratio between the continuum at 2.22 m and at 1.23 m is , while at larger distances from the nucleus, typical values are along PA and even smaller at locations away from this PA (). In order to to investigate the nature of the K-band excess at the nucleus, we have extracted a nuclear spectrum within an aperture of 025 radius, which includes the nuclear flux down to 20% of the peak continuum flux in the K band. An extra-nuclear spectrum for a circular ring within radii 025035 was extracted to represent the stellar population. This spectrum was normalized according to the ratio of the nuclear/extra-nuclear extraction apertures. Both spectra were corrected for extinction using the reddening values obtained in Sec. 3.3: for the nucleus and for the stellar population.
Under the assumption that the underlying stellar population in the nuclear spectrum is the same as in the extra-nuclear spectrum, we have subtracted the latter from the former. The resulting nuclear continuum was then modeled by the sum of two components: a blackbody function, which dominates the emission in the K band and a power-law, which is important for the J-band emission. The fit was performed using the nfit1d task of the stsdas iraf package selecting only spectral regions not affected by line emission. The best fit was obtained for a power-law and a blackbody function with temperature K.
We then considered the possibility that the contribution of the stellar population to the nuclear spectrum is higher than the one derived only from the normalization of the fluxes to the same extraction aperture. This possibility is suggested by the fact that the stellar CO absorption bands in the nuclear spectrum do not disappear after the subtraction of the extra-nuclear spectrum. In order to completely eliminate the stellar absorptions the extra-nuclear spectrum had to be multiplied by a factor of 1.45. After this correction we obtain and K. In the top panel of Fig. 6 we show the nuclear and extra-nuclear spectra corrected by extinction with the latter properly normalized as described above. The bottom panel shows the subtracted spectrum, as well as the resulting fit as a continuous line. The blackbody function is shown as a dashed line and the power-law as a dotted line.
Recently, Riffel et al. (2009c)22 2 This is not the present author, but his brother. presented stellar population synthesis for a sample of Seyfert galaxies, including Mrk 1066, using near-IR spectra extracted within an aperture of 1608. Besides synthetic Simple Stellar Population (SSP) models, the authors considered the contribution of a power-law to represent the featureless continuum from the AGN and five blackbody functions for temperatures ranging from 800 K to 1400 K in order to account for possible dust emission. They concluded that the dust emission is not necessary in the case of Mrk 1066. Nevertheless, as shown in Fig. 6, a K-band excess is clearly present in our nuclear spectrum. Riffel et al. (2009c) did not identified this component probably due to their larger aperture, which covers an area more than 6 times ours. Unresolved dust emission from the nucleus of Seyfert galaxies is commonly observed and is usually attributed to the dusty torus postulated by the Unified Model (Riffel et al., 2009a; Riffel et al., 2009b; Riffel et al., 2009c; Rodríguez-Ardila & Mazzalay, 2006; Rodríguez-Ardila, Contini & Viegas, 2005b, e.g.). Previous works have shown that the dust emission in the near-IR for Seyfert 1 galaxies give blackbody temperatures K, while for Seyfert 2 galaxies the blackbody temperature is usually K, in agreement with our result for Mrk 1066. This difference can be interpreted as due to the fact that in Seyfert 1 galaxies one can see the inner wall of the torus, where the temperatures are close to the evaporation temperature of graphite and silicate grains (Barvainis, 1987; Granato & Danese, 1994). In Seyfert 2 galaxies we do not see the inner wall, only dust located at larger distances from the nucleus, heated by a more diluted radiation field, part of which is also blocked by clouds in the inner region of the torus (Elitzur, 2008, e.g.). Since the K-band continuum of Mrk 1066 is unresolved by our observations, we can constraint the location of the emitting dust to within the inner pc, although, as discussed in Riffel et al. (2009b), the dust is probably located much closer in.

We can derive the mass of the emitting dust from the parameters obtained from the fit of the blackbody function, together with assumptions about the physical properties of the dust grains. We estimate the infrared luminosity of each grain assuming that the dust composition is graphite, by
| (3) |
where is the grain radius, is the absorption efficiency and is its spectral energy distribution assumed to be a Planck function with temperature (Barvainis, 1987). The ratio between the total luminosity of the hot dust () and that of one grain () gives the number of dust grains . was obtained by integrating the flux under the Planck function fitted to the nuclear spectrum and was obtained by the integration of equation 3 for a temperature of K assuming m, and (Barvainis, 1987; Kishimoto et al., 2007). Finally, the mass of the emitting hot dust is obtained as:
| (4) |
Assuming a graphite density of g cm-3 (Granato & Danese, 1994), we obtain . The derived mass is comparable to values obtained for other Seyfert galaxies, which are in the range (Riffel et al., 2009b; Riffel et al., 2009c, e.g.).
4.2 Flux distributions
The flux distributions shown in Fig. 4, are more more extended along the PA135/315∘ and resemble those in optical lines (Bower et al., 1995; Stoklasová et al, 2009). Using HST imaging, Bower et al. (1995) observed a narrow “jetlike” feature in the [O iii]+H emission, extending to 14 north-west from the nucleus along PA=315∘. They concluded that this image is dominated by [O iii] emission and thus that the high excitation gas is strongly concentrated in the jet. To the south-east the [O iii] emission is much fainter than to the north-west, similarly to what we observe in the [Fe ii] and [P ii] emission. Bower et al. (1995) present also a H+[N ii] narrow-band image, which shows the same “jetlike” structure, but with a flux distribution broader then in [O iii], with emission to both sides of the nucleus, similar to our Br and Pa flux distributions. The 3.6 cm radio map presents a bipolar jet at approximately the same orientation of the emission-line flux distributions (see Fig. 4). By comparing the radio and optical line emission, Bower et al. (1995) suggest that the low- and high-excitation gas present distinct spatial distributions, with the former preferentially located in the galaxy plane and the latter in the jet region. They explain the lower intensity of [O iii] to south-west of the nucleus as being due to obscuration of the jet by the galactic plane.
A detailed analysis of the line flux distributions reveal some differences between lines from distinct ionization levels. In order to do this comparison, we extracted one-dimensional cuts along PA=135∘ for a pseudo-slit with 025 width. The resulting one-dimensional flux distributions for the [Fe ii], Pa, Br and H2m emission lines are shown in Figure 7. As observed in this figure (see also the two-dimensional maps from Fig. 4), the [Fe ii] flux distribution peaks at 085 north-west of the nucleus, approximately coincident with a hot spot observed in the radio map, and is fainter to the south-east, in good agreement with the [O iii] image. The H recombination lines and H2 line emission peak at the nucleus. The H lines have a secondary peak at 05 south-east of the nucleus, which is not observed in the H2 and [Fe ii] flux distributions. The H2 emission presents a secondary peak to north-west, between the nucleus and the radio hot spot. Knop et al. (2001) obtained J and K long-slit spectroscopy of Mrk 1066 with a seeing of 07. They present flux measurements for near-IR emission lines along PA=45∘ and PA=135∘, which can be directly compared with our one-dimensional cuts and flux maps (Figs. 7 and 4). In general, our flux distributions are in good agreement with theirs, although much more details are revealed by our measurements. In particular, the secondary peaks observed in the H emission lines and the H2 nuclear peak are not present in the flux distributions presented by Knop et al. (2001). We attribute these differences to our higher spatial resolution.
Our [Fe ii] and H recombination lines present similar flux distributions to those of the [O iii] and H+[N ii] images of Bower et al. (1995), respectively. We conclude that the [Fe ii] emitting gas extends to high galactic latitudes and is approximately co-spatial with the radio jet, while the Br and Pa emission originate mostly from the galactic plane. The H2 flux is more uniformly distributed over the whole IFU field, suggesting also an important contribution from gas in the galactic plane, although part of the H2 emitting gas close to the nucleus may be also outflowing to high latitudes, as judged from the highest flux to the north-west than to the south-east (Fig. 4). These conclusions are supported by the observation of distinct kinematics for these emission lines, with the [Fe ii] originating in a much more disturbed gas than the H and H2 emitting (Riffel et al., in preparation). This result is also supported by near-IR IFU observations of other Seyfert galaxies, which show that the H2 and ionized gas have distinct distributions and kinematics, with the former usually restricted to the galactic plane and the latter extending to higher latitudes (Riffel et al., 2006; Riffel et al., 2008; Riffel et al., 2009a; Storchi-Bergmann et al., 2009, e.g.).

4.3 Diagnostic diagram
In order to investigate the nature of the circum-nuclear line-emitting region we constructed the spatially resolved spectral-diagnostic diagram [Fe ii]m/Pa H2m/Br, originally proposed for non-resolved spectra (Larkin et al., 1998; Rodríguez-Ardila et al., 2004; Rodríguez-Ardila, Riffel & Pastoriza, 2005a). Typical values for the nucleus of Seyfert galaxies are 0.6[Fe ii]/Pa2.0 and 0.6H2/Br2.0 (Rodríguez-Ardila, Riffel & Pastoriza, 2005a, e.g.). The diagram is shown in the top panel of Fig. 8, in which black filled circles represent typical values for Seyfert galaxies, blue open circles for Starbursts and red crosses for LINERs. Most ratios present Seyfert-like, although some points are observed in the LINER and Starburst regions of the diagnostic diagram. Stoklasová et al (2009) analyzed optical IFU data for Mrk 1066 and presented several optical diagnostic diagrams. A comparison between the optical and the present near-IR diagram shows that they are consistent with each other.
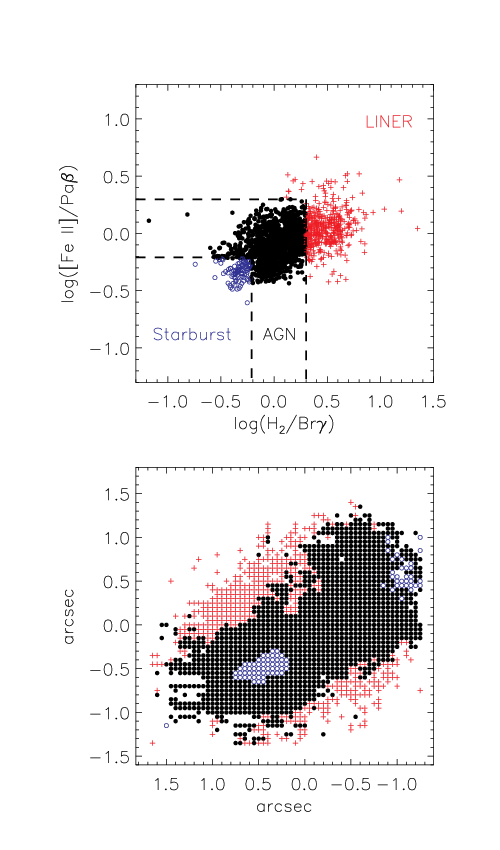
The locations of the distinct line ratios are shown in the bottom panel of Fig. 8. Seyfert-like line ratios are observed approximately along the radio jet and ionization cone (Bower et al., 1995; Nagar et al., 1999, PA,) suggesting that the line emission in these regions is driven by the AGN. The Starburst ratios are mainly observed in a region at 05 south-east of the nucleus at the position of the secondary emission peak of the H recombination lines, as described in the Sec. 4.2. Approximately at this same position there is also a higher flux in the continuum (see Fig. 2). Fig. 8 shows also some Starburst ratios at 1′′ north-west in a region approximately coincident with a small enhancement of the H emission (see Fig. 7) and with a knot in the optical continuum image (see Fig. 2). We interpret the Starburst ratios as originating in star formation regions (SFRs) located at these positions. This conclusion is supported by the observations of knots in the optical continuum image and its absence in the near-IR continuum, as young stars contribute mostly to the optical emission, while in the near-IR the continuum is dominated by the emission from old stars. At distances 05 perpendicular to the orientation of the ionization cone the H2m/Br ratio reaches the highest values, being in the region of LINERs in the diagnostic diagram. We interpret this low ionization region as being originated by a diffuse radiation field escaping through the walls of the ionization cone, which have enough energy to excite the H2. A similar scenario is observed for the well-studied Seyfert galaxy NGC 4151 (Kraemer, Schmitt & Crenshaw, 2008) and attributed to the origin of the near-IR lines in regions away from its ionization cone (Storchi-Bergmann et al., 2009).
4.4 H2 excitation

The molecular hydrogen flux distribution and kinematics in the central regions of active galaxies have been the subject of several recent studies. Nevertheless, its excitation mechanisms is still in debate (Reunanen, Kotilainen & Prieto, 2002; Rodríguez-Ardila et al., 2004; Rodríguez-Ardila, Riffel & Pastoriza, 2005a; Davies et al., 2005; Riffel et al., 2006; Riffel et al., 2008; Sánchez et al., 2009; Ramos Almeida, Pérez García & Acosta-Pulido, 2009; Hicks et al., 2009; Storchi-Bergmann et al., 2009, e.g.). The H2 emission lines can be excited by two mechanisms: (i) fluorescent excitation through absorption of soft-UV photons (912–1108 Å) in the Lyman and Werner bands – present both in star-forming regions and surrounding AGNs (Black & van Dishoeck, 1987) and (ii) collisional excitation (usually referred to as thermal processes) due to heating of the gas by shocks, due to interaction of a radio jet with the interstellar medium (Hollenbach & McKee, 1989) or by X-rays from the central AGN (Maloney, Hollenbach & Tielens, 1996).
We can use the H22.1218/Br emission-line ratio to investigate the origin of the H2 emission. Typical values for Starburst galaxies, where the main heating agent is the UV radiation, are in the range H2/Br0.6 (Rodríguez-Ardila et al., 2004; Rodríguez-Ardila, Riffel & Pastoriza, 2005a), while for Seyferts this ratio is larger because of additional thermal excitation by shocks or X-rays from the AGN. As observed in Figs. 5 and 8, Mrk 1066 presents two regions with H22.1218/Br 0.6. The first located at north-west from the nucleus and the second at 05 south-east. As discussed in Sec. 4.3, we interpret this result as due to an enhancement of Br due to ionization from young stars in SFRs at these locations. In regions away from these SFRs, H22.1218/Br is larger than 0.6 reaching in regions more than 07 from the nucleus in the direction perpendicular to the radio jet, suggesting additional H2 emission due to thermal processes.
Another line ratio which can be used to study the H2 excitation is H22.2477/2.1218. For fluorescent excitation, typical values are , while for thermal processes this ratio is (Mouri, 1994; Reunanen, Kotilainen & Prieto, 2002; Rodríguez-Ardila et al., 2004; Storchi-Bergmann et al., 2009, e.g.). In the case of active galaxies, the fluorescent process seems not to be important (Rodríguez-Ardila et al., 2004; Rodríguez-Ardila, Riffel & Pastoriza, 2005a; Riffel et al., 2006, e.g.). As observed in Tab. 1, H22.2477/2.12180.1 in all positions, indicating that the H2 emission in most of the circum-nuclear region of Mrk 1066 is also due to excitation by thermal processes.
We can also use the observed fluxes for all H2 emission lines in the K band to calculate the thermal excitation temperature. Following Wilman, Edge & Juhnstone (2005), we have investigated the expression (Storchi-Bergmann et al., 2009, see also):
| (5) |
where is the flux of the H2 line, is its wavelength, is the spontaneous emission coefficient, is the statistical weight of the upper level of the transition, is the energy of the level expressed as a temperature and is the excitation temperature. This relation is valid for thermal excitation, under the assumption of an ortho:para abundance ratio of 3:1. In Fig. 10 we present the observed values for (plus an arbitrary constant) for the nuclear spectrum and for an extra-nuclear one at 05 north-west from the nucleus (position A in Fig. 1). The resulting fit of the above relation is shown in Fig. 10 as a continuum line and resulted in an excitation temperature of K for the nucleus and K for the position A. The fact that the ortho lines (1-0 S(1), 2-1 S(1), 1-0 Q(1), etc) give the same result as the para lines (1-0 S(0), Q(2), Q(4), etc) confirm that the H2 is in thermal equilibrium at and that the ortho to para ratio is 3 as assumed. This is also what is expected for thermal equilibrium.

The heating of the H2 can be provided by nuclear X-rays and/or by shocks due to the interaction of the radio jet with the interstellar medium. Nevertheless distinguishing between both mechanisms is usually a hard task. Correlations between the radio or X-ray emission with the H2 emission could be useful to investigate the importance of these mechanisms. Quillen et al. (1999), using HST, imaged a sample of 10 Seyfert galaxies in H2 and looked for correlations with radio 6 cm and hard X-ray flux. They found no correlation with X-rays and a weak correlation with radio 6-cm, suggesting that no single mechanism is likely to be responsible for the H2 excitation in Seyfert galaxies.
In Fig. 9 we present plots for the [Fe ii]m (top left panel), [P ii]m (bottom left), Pa (top right) and Hm (bottom right) emission-line fluxes versus the radio flux at 3.6 cm for each spatial pixel. As observed in this figure the flux distributions correlate very well with the radio emission. We used the routine r_correlate in idl33 3 http://ittvis.com/idl programing language to obtain the Sepearman correlation coefficient (). The best correlation is found for [Fe ii] with , followed by Pa with , [P ii] with and H2 with . These correlation can be understood in two ways: (i) the interaction between the radio jet and the ISM produces the heating necessary to collisionally excitation the emitting gas and/or (ii) the radio jet only compresses the gas enhancing its emission, excited by other mechanism. The fact that Pa emission shows a better correlation with the radio than the H2 emission suggests that the radio jet only compresses the gas, since the H recombination lines are not sensible to collisional excitation. Nevertheless, shocks due to the radio jet cannot be completely discarded since the ionized and molecular hydrogen emission could arise from distinct locations along the line-of-sight.
Following Rodríguez-Ardila et al. (2004) and Riffel et al. (2008) we evaluate the emergent flux for the H2m of a gas cloud illuminated by a source of hard X-rays using the model of Maloney, Hollenbach & Tielens (1996). Shu et al. (2007) obtained a 2–10 keV X-ray flux of and a attenuating column density of for Mrk 1066 using Chandra observations. The value is measured along the line-of-sight and according to the unified model may be smaller in other directions, since Mrk 1066 has a Seyfert 2 nucleus and thus the dusty torus is seen edge-on, enhancing the column density only along the line-of-sight (Antonucci, 1993). The column density in the H2 emitting region can be estimated using [cm-2] (Shull & van Steenberg, 1985). Using the values from Fig. 5 we obtain cm-2, which is in good agreement with the value obtained by Guainazzi, Matt & Perola (2005) – – using XMM-Newton X-ray observations. The lower value of obtained with the XMM-Newton relative to the one with Chandra data may be due to the fact that former has a larger aperture than latter, diluting the effect of the nuclear dust. Using cm-2 as the appropriate value for the emitting gas, the emergent fluxes calculated from the X-ray excitation model can account for the H2 emission in most locations of the observed field of Mrk 1066.
The line H2 2–1 S(3) (m) can also be used to investigate the H2 excitation. In the case of X-ray irradiated gas this line is expected to be absent (Davies et al., 2005). Our spectral range does not include this line, but Riffel, Rodríguez-Ardila & Pastoriza (2006) obtained a near-IR nuclear spectrum for an aperture of 1606 in which the H2 2–1 S(3) emission line is not detected, supporting the above conclusion that X-ray heating contribute to the observed H2 emission.
From the discussion above, we conclude that heating by X-rays from the central AGN may be the dominant excitation mechanism of the H2. This conclusion is in good agreement with those obtained for other active galaxies (Storchi-Bergmann et al., 1999; Riffel et al., 2008; Storchi-Bergmann et al., 2009, e.g.). Nevertheless, as discussed above, some contribution of the radio jet to the H2 excitation cannot be discarded. In fact, the interaction of the radio jet with the circum-nuclear gas seems to be important in the excitation of the H2 in some galaxies, such as ESO 428-G14 (Riffel et al., 2006).
4.5 [Fe ii] excitation
The [Fe ii]m/Pa line ratio is controlled by the ratio between the volumes of partially to fully ionized regions, as the [Fe ii] emission is excited in partially ionized gas regions. In AGNs, such regions can be created by X-ray (Simpson et al., 1996, e.g.) and/or shock (Forbes & Ward, 1993, e.g.) heating of the gas.
The [Fe ii]m/Pa line ratio can be used to investigate the excitation mechanism of the [Fe ii] emission. For Starburst galaxies, [Fe ii]/Pa and for supernovae for which shocks are the main excitation mechanism, this ratio has values larger than 2 (Rodríguez-Ardila et al., 2004; Rodríguez-Ardila, Riffel & Pastoriza, 2005a). Thus this ratio can be used to measure the relative contribution of photoionization and shocks, with values close to 0.6 meaning that photoionization dominates, while values close to 2 that shock excitation is dominant. As observed in Figs. 5 and 8, for Mrk 1066 typical values for this ratio are 0.6–1.5, although in the regions co-spatial with the SFRs [Fe ii]/Pa due to an enhancement of the Pa emission. The highest values are observed in locations close to the edge of the radio structure suggesting that the excitation due to shocks by the radio jet is important in these regions. The stronger correlation between the [Fe ii] and the radio emission than those observed for the other emission lines (see Fig. 9) support a higher contribution of the radio jet for the excitation of [Fe ii] than for H2. Radio shocks have been appointed as the main [Fe ii] excitation mechanism for some Seyfert galaxies such as ESO 428-G14 (Riffel et al., 2006) and being not negligible in others, as in NGC 4151 (Storchi-Bergmann et al., 2009).
Another tracer of the origin of the [Fe ii] emission is the line ratio [Fe ii]1.2570m/[P ii]1.8861m. These two lines have similar excitation temperatures, and their parent ions have similar ionization potentials and radiative recombination coefficients. As pointed out in Oliva et al. (2001) – see also Storchi-Bergmann et al. (2009) – values larger than 2 indicate that shocks have passed through the gas destroying the dust grains, releasing the Fe and thus enhancing its observed abundance. For supernova remnants where shocks are the dominant excitation mechanism [Fe ii]/[P ii] is typically higher than 20 (Oliva et al., 2001). As observed in Fig. 5, Mrk 1066 presents [Fe ii]/[P ii]3 at most locations, but in some regions close to the borders of the radio structure [Fe ii]/[P ii] reaches values up to 9.5, indicating that shocks due to the radio jet are important in these locations in agreement with the highest values obtained for the [Fe ii]/Pa at the same locations.
From the discussion above, we conclude that X-ray heating may be the dominant excitation mechanism of the [Fe ii] in Mrk 1066, exceptions are the regions 085 north-west of the nucleus where there is a radio hot spot and in the borders of the radio structure, where shocks seem to play a more important role. In any case, the contribution of shocks due to the radio jet seems to be more important for the [Fe ii] emission than for the H2 emission, as indicated by the better correlation observed for with the radio emission and the [Fe ii] than the one observed for the H2. This result is in good agreement with the ones obtained for other galaxies (Rodríguez-Ardila et al., 2004; Rodríguez-Ardila, Riffel & Pastoriza, 2005a; Riffel et al., 2006; Storchi-Bergmann et al., 1999; Storchi-Bergmann et al., 2009, e.g.).
4.6 Mass of ionized and molecular gas
Following Riffel et al. (2008) and Storchi-Bergmann et al. (2009) we estimate the mass of ionized gas in the inner 700 700 pc2 by
| (6) |
where is the integrated flux for the Br emission line and is the distance to Mrk 1066. We have assumed an electron temperature K and electron density .
The mass of molecular gas can be obtained as
| (7) |
where is the integrated flux for the H2m emission line and we have used the vibrational temperature T=2000 K we have obtained in Sec. 4.4.
Integrating over the whole IFU field we obtain and , resulting in and . The mass of molecular gas is 104 times smaller than of ionized gas but, as discussed in Storchi-Bergmann et al. (2009), this H2 mass represents only that of hot gas emitting in the near-IR, heated by X-rays and maybe also by shocks from the central AGN. The total mass in molecular gas (including the cold gas which does not emit in the near-IR) is usually 10107 times that in hot H2 (Dale et al., 2005) suggesting that the total molecular gas mass is at least 10.
5 Conclusions
We used integral field J- and Kl-Band spectroscopy of the inner pc2 of the Seyfert galaxy Mrk 1066, obtained with the Gemini NIFS at spatial resolution 35 pc and spectral resolution 3.3 , to map the near-IR continuum and emission-line flux distributions, as well as the properties of the nuclear spectrum. Our main conclusions are:
- •
The nucleus contains an unresolved infrared source whose continuum is well reproduced by the emission of a dust structure with temperature 830 K and mass which we identify as the dusty torus of the Unified Model;
- •
Emission-line fluxes (except for the coronal lines) are elongated in PA in agreement with previous optical [O iii] imaging and also following the radio jet extending beyond the IFU field. Except for the H lines, the emission is stronger to the north-west than to the south-EAST in association with the radio hot spot implying that at least part of the emitting gas is co-spatial with the radio outflow. The H emission is stronger to the south-east, where we find a large region of star-formation.
- •
There is a strong correlation between the radio emission and the highest emission-line fluxes suggesting that the radio jet plays an important role for these intensity levels. At lower line flux values this correlation disappears indicating a contribution from gas in the galactic plane.
- •
The coronal line emission in [Ca viii]m and [S ix]m are unresolved by our observations indicating that they originate within a radius of 18 pc from the nucleus.
- •
The [Fe ii]/Pa H2/Br line-ratio diagnostic diagram presents typical values for Seyfert nuclei along the ionization cone indicating that the line emission is powered by the AGN in these regions. Some radiation escapes through the walls of the ionization cone and powers a low ionization emission-line region in locations perpendicular to the cone and radio jet. At the positions 05 south-east and at 1′′ north-west of the nucleus Starburst-like values are observed due to additional emission of the H lines from star forming regions.
- •
The reddening map obtained via the Pa/Br line ratio present a S-shaped structure with high values oriented along the PA135/315∘, reaching up to . Lower values are observed in regions away from this structure with typical values of . The reddening in the continuum is smaller with typical values of along the S-shaped structure.
- •
The H2 gas has an excitation temperature K and its emission is mainly due to X-ray excitation from the central AGN, which is also the main excitation mechanism of the [Fe ii] emission. Emission due to shocks produced by the radio jet may contribute a small fraction to the emission of both lines, with a larger contribution for the [Fe ii] line.
- •
The mass of ionized gas in the inner pc2 of Mrk 1066 is , while that of hot molecular gas is .
Acknowledgments
Based on observations obtained at the Gemini Observatory, which is operated by the Association of Universities for Research in Astronomy, Inc., under a cooperative agreement with the NSF on behalf of the Gemini partnership: the National Science Foundation (United States), the Science and Technology Facilities Council (United Kingdom), the National Research Council (Canada), CONICYT (Chile), the Australian Research Council (Australia), Ministério da Ciência e Tecnologia (Brazil) and south-eastCYT (Argentina). This research has made use of the NASA/IPAC Extragalactic Database (NED) which is operated by the Jet Propulsion Laboratory, California Institute of Technology, under contract with the National Aeronautics and Space Administration. This work has been partially supported by the Brazilian institution CNPq.
References
- Antonucci (1993) Antonucci, R. 1993, ARA&A, 31, 473.
- Barbosa et al. (2009) Barbosa, F. K. B., Storchi-Bergmann, T., Cid Fernandes, R., Winge, C., Schmitt, H., 2009, MNRAS, 396, 2.
- Barvainis (1987) Barvainis, R. 1987, ApJ, 320, 537
- Black & van Dishoeck (1987) Black, J. H., & van Dishoeck, E. F. 1987, ApJ, 322, 412.
- Bower et al. (1995) Bower, G., Wilson, A., Morse, J. A., Gelderman, R., Whitle, M., & Mulchaey, J., 1995, ApJ, 454, 106.
- Cardelli, Clayton & Mathis (1989) Cardelli,J. A., Clayton, G. C. & Mathis, J. S., 1989, ApJ, 345,245.
- Dale et al. (2005) Dale, D. A., Sheth, K., Helou, G., Regan, M. W., & Hüttemeister, S., 2005, ApJ, 129, 2197.
- Davies et al. (2005) Davies, R. I., I., Sternberg, A., Lehnert, M. D., & Tacconi-Garman, L. E., 2005, ApJ, 633, 105.
- Davies et al. (2007) Davies, R. I., Sánchez, F. M., Genzel, R., Tacconi, L. J., Hicks, E. K. S., Friedrich, S., & Sternberg, A. ApJ, 671, 1388.
- Elitzur (2008) Elitzur, M. 2008, NewAR, 52, 274
- Forbes & Ward (1993) Forbes, D. A. & Ward, M. J. 1993, ApJ, 416, 150.
- Granato & Danese (1994) Granato, G. L., & Danese, L. 1994, MNRAS, 268, 235
- Guainazzi, Matt & Perola (2005) Guainazzi, M., Matt, G., & Perola, G. C., 2005, A&A, 444, 119.
- Hollenbach & McKee (1989) Hollenbach, D., & McKee, C. F., 1989, ApJ, 342, 306.
- Hicks et al. (2009) Hicks, E. K. S., Davies, R. I., Malkan, M. A., Genzel, R., Tacconi, L. J.; Sánchez, F. M., Sternberg, A., 2009, ApJ, 696, 448.
- Kraemer, Schmitt & Crenshaw (2008) Kraemer S. B., Schmitt H. R., & Crenshaw D. M., 2008, ApJ, 679, 1128.
- Kishimoto et al. (2007) Kishimoto, M., Hönig, S. F., Beckert, T., & Weiglt, G., 2007, A&A, 476, 713.
- Knop et al. (2001) Knop, R. A., Armus, L., Matthews, K., Murphy, T. W., & Soifer, B. T., 2001, ApJ, 122, 764.
- Larkin et al. (1998) Larkin, J. E., Armus, L., Knop, R. A., Soifer, B. T., & Matthews, K., 1998, ApJS, 114, 59.
- Lasker et al. (1996) Lasker, B. M., Doggett, J., McLean, B., Sturch, C., Djorgovski, S., de Carvalho, R. R., Reid, I. N., 1996, Astronomical Data Analysis Software and Systems V, A.S.P. Conference Series, George H. Jacoby and Jeannette Barnes, eds., 101, 88.
- Malkan, Gorjian & Tam (1998) Malkan, M. A., Gorjian, V. & Tam, R., 1998, ApJS, 117,25.
- Maloney, Hollenbach & Tielens (1996) Maloney, P. R., Hollenbach, D. J., & Tielens, A. G. G. M., 1996, ApJ, 466, 561.
- McGregor et al. (2003) McGregor, P. J. et al., 2003, Proceedings of the SPIE, 4841, 1581.
- Mouri (1994) Mouri, H. 1994, ApJ, 427, 777.
- Mundell et al. (2009) Mundell, C. G., Ferruit, P., Nagar, N., & Wilson, A. S. 2009, ApJ, 703, 802
- Nagar et al. (1999) Nagar, N. M., Wilson, A. S., Mulchaey, J. S. & Gallimore, J. F., 1999, ApJS, 120, 209.
- Osterbrock & Ferland (2006) Osterbrock, D. E. & Ferland, G. J., 2006, Astrophysics of Gaseous Nebulae and Active Galactic Nuclei, Second Edition, University Science Books, Mill Valley, California.
- Oliva et al. (2001) Oliva, E. et al. 2001, A&A, 369, L5.
- Quillen et al. (1999) Quillen, A. C., Alonso-Herrero, A., Rieke, M. J., Rieke, G. H., Ruiz, M., & Kulkarni, V. 1999, ApJ, 527, 696.
- Ramos Almeida, Pérez García & Acosta-Pulido (2009) Ramos Almeida, C., Pérez García, A. M., & Acosta-Pulido, J. A., 2009, ApJ, 694, 1379.
- Reunanen, Kotilainen & Prieto (2002) Reunanen, J., Kotilainen, J. K., & Prieto, M. A., 2002, MNRAS, 331, 154.
- Rieke & Lebofsky (1981) Rieke, G. H., & Lebofsky, M. J., 1981, ApJ, 250, 87.
- Riffel et al. (2006) Riffel, Rogemar A., Sorchi-Bergmann, T., Winge, C., Barbosa, F. K. B., 2006, MNRAS, 373, 2.
- Riffel, Rodríguez-Ardila & Pastoriza (2006) Riffel, R., Rodríguez-Ardila, A., Pastoriza, M. G., 2006, A&A, 457, 61.
- Riffel et al. (2008) Riffel, Rogemar A., Storchi-Bergmann, T., Winge, C., McGregor, P. J., Beck, T., Schmitt, H. 2008, MNRAS, 385, 1129.
- Riffel et al. (2009a) Riffel, Rogemar A., Storchi-Bergmann, T., Dors, O. L., Winge, C., 2009, MNRAS, 393, 783.
- Riffel et al. (2009b) Riffel, Rogemar A., Storchi-Bergmann, T., McGregor, P. J., 2009, ApJ, 698, 1767.
- Riffel et al. (2009c) Riffel, R., Pastoriza, M. G., Rodríguez-Atdila, A., Bonatto, C. 2009, accepted by MNRAS, arXiv:0907.4144
- Rodríguez-Ardila et al. (2004) Rodríguez-Ardila, A., Pastoriza, M. G., Viegas, S., Sigut, T. A. A., & Pradhan, A. K., 2004, A&A, 425, 457.
- Rodríguez-Ardila, Riffel & Pastoriza (2005a) Rodríguez-Ardila, A., Riffel, R., & Pastoriza, M. G. 2005, MNRAS, 364, 1041.
- Rodríguez-Ardila, Contini & Viegas (2005b) Rodríguez-Ardila, A., Contini, M., Viegas, S. 2005b MNRAS, 357, 220
- Rodríguez-Ardila & Mazzalay (2006) Rodríguez-Ardila, A., & Mazzalay, X. 2006, MNRAS, 367, L57
- Sánchez et al. (2009) Sánchez, F. M., Davies, R. I., Genzel, R., Tacconi, L. J., Eisenhauer, F., Hicks, E. K. S., Friedrich, S., & Sternberg, A., 2009, ApJ, 691, 749.
- Simpson et al. (1996) Simpson, C., Forbes, D. A., Baker, A. C., & Ward, M. J. 1996, MNRAS, 283, 777.
- Shu et al. (2007) Shu, X. W., Wang, J. X., Jiang, P., Fan, L. L., Wang, T. G., 2007, ApJ, 657, 167.
- Shull & van Steenberg (1985) Shull, J. A. & van Steenberg, M. E., 1985, ApJ, 294, 599.
- Stoklasová et al (2009) Stoklasová, I., Ferruit, P., Emssellem, E., Jungwiert, B., Pécontal, E., & Sánchez, S. F., 2009, A&A, 500, 1287.
- Storchi-Bergmann et al. (1999) Storchi-Bergmann, T., Winge, C., Ward, M. J., Wilson, A. S., 1999, MNRAS, 304, 35.
- Storchi-Bergmann et al. (2009) Storchi-Bergmann, T., McGregor, P. Riffel,Rogemar A., Simões Lopes, R., Beck, T., Dopita, M., 2009, MNRAS, 394, 1148.
- Ulvestad & Wilson (1989) Ulvestad, J. S., & Wilson, A. S., 1989, ApJ, 343, 659.
- Wilman, Edge & Juhnstone (2005) Wilman, R. J., Edge, A. C., & Juhnstone, R. M., 2005, MNRAS, 359, 755.