Precise measurement of HFS of positronium
Abstract
The ground state hyperfine splitting in positronium, , is sensitive to high order corrections of QED. A new calculation up to has revealed a discrepancy between the QED prediction and the experimental results. This discrepancy might either be due to systematic problems in the previous experiments or to contributions beyond the Standard Model. We propose an experiment to measure employing new methods designed to remedy the systematic errors which may have affected the previous experiments. Our experiment will provide an independent check of the discrepancy. The measurement is in progress and a preliminary result of has been obtained. A measurement with a precision of ppm is expected within a few years.
1 Introduction
Positronium (Ps), a bound state of an electron and a positron, is a purely leptonic system which allows for very sensitive tests of QED. The precise measurement of the hyperfine splitting between orthopositronium (o-Ps, 1) and parapositronium (p-Ps, 1) (Ps-HFS) provides a good test of bound state QED. Ps-HFS is expected to be relatively large (for example compared to hydrogen HFS) due to a relatively large spin-spin interaction, and also due to the contribution from vacuum oscillation (o-Ps o-Ps). The contribution from vacuum oscillation is sensitive to new physics beyond the Standard Model.
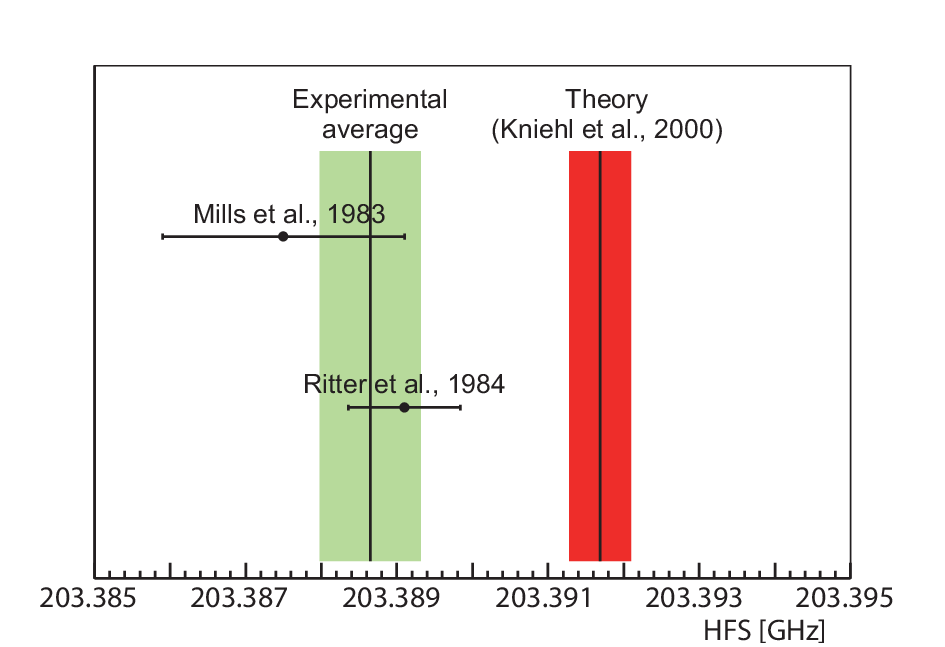
Figure 1 shows the measured and theoretical values of Ps-HFS.
The combined value from the results of the previous 2 experiments is
[1, 2].
Recent developments in nonrelativistic QED (NRQED) have added
corrections to the theoretical prediction which now stands at
[3].
The discrepancy of
3.04(79) MHz (15 ppm, 3.9 ) between
and might either be due to the common systematic uncertainties in the previous experiments or to
new physics beyond the Standard Model.
There are two possible common systematic uncertainties in the previous experiments. One is the unthermalized o-Ps contribution which results in an underestimation of the material effect. This effect has already been shown to be significant [4]. The other is the uncertainty in the magnetic field uniformity which was cited as the most significant systematic error by previous experimenters.
2 Experimental setup
The energy levels of the ground state of Ps are shown as a function of static magnetic field in Figure 2. Due to technical difficulties in directly stimulating , we make an indirect measurement by stimulating the transition . This is the same approach as previous experiments. The relationship between and is given by the Breit-Rabi equation
| (1) |
in which . is the factor for a positron (electron) in Ps [5], is the Bohr magneton, is the static magnetic field, and is the Plank constant.
In a static magnetic field, the p-Ps state mixes with the substate of o-Ps hence the latter state annihilates into 2 -rays with a lifetime of about 8 ns (with our experimental conditions). The substates of o-Ps annihilate into 3 -rays with a lifetime of about 140 ns. When a microwave field with a frequency of is applied, transitions between the and substates of o-Ps are induced so that the 2 -ray annihilation rate increases. This increase is our experimental signal.
Following are the main improvements in our experiment which we expect will significantly reduce systematic errors present in previous experiments.


2.1 Large bore superconducting magnet (Figure 3)
A large bore superconducting magnet is used to produce the magnetic field which induces the Zeeman splitting (). The bore diameter of the magnet is 800 mm, and its length is 2 m. The large bore diameter means that there is good uniformity in the magnetic field in the region where Ps is formed (70 ppm at 0.61 G without utilization of any compensation).
Furthermore, the magnet is operated in persistent current mode, making the stability of the magnetic field better than 1 ppm.
2.2 -tagging system and timing information
The positron source is 19 Ci (700 kBq) of . A plastic scintillator 10 mm in diameter and 0.2 mm thick is used to tag positrons emitted from the . The scintillation light is detected by photomultipliers and provides a start signal which corresponds to the time of Ps formation.
The positron then enters the microwave cavity, forming Ps in the gas contained therein.
Ps decays into photons that are detected with LaBr3 (Ce) scintillators. Accumulating measurements of the times of positron emission and -detection results in decay curves of Ps as shown in Figure 4. The timing information is used to improve the accuracy of the measurement of as follows:
- 1.
Imposing a time cut means that we can select well thermalized Ps, reducing the unthermalized o-Ps contribution. It should also be possible to precisely measure the contributions of unthermalized o-Ps, and of material effects (we plan to make such measurements in future runs).
- 2.
A time cut also allows us to avoid the prompt peak (contributions of simple annihilation and of fast p-Ps decay), which greatly increases the S/N of the measurement.
2.3 High performance -ray detectors
Six -ray detectors are located around the microwave cavity to detect the 511 keV annihilation -rays. LaBr3 (Ce) scintillators, 1.5 inches in diameter and 2 inches long are used. LaBr3 (Ce) scintillators have good energy resolution (4 % FWHM at 511 keV) and timing resolution (0.2 ns FWHM at 511 keV), and have a short decay constant (25.6 ns). The good energy resolution and the high counting rate of LaBr3 results in very good overall performance for measuring 2 decays. In particular the good energy resolution allows us to efficiently separate 2 events from 3 events, negating the need to use a back-to-back geometry to select 2 events, thus greatly increasing the acceptance of our setup.
This -ray detector system greatly reduces the statistical error in the measurement.
2.4 RF system
Microwaves are produced by a local oscillator signal generator and amplified to 500 W with a GaN amplifier (R&K A2856BW200-5057-R).
The microwave cavity is made with oxgen-free copper; the inside of the cavity is a cylinder 128 mm in diameter and 100 mm long. The side wall of the cavity is only 2 mm thick in order to allow the -rays to efficiently escape. The cavity is operated in the TM110 mode. The resonant frequency is 2.8532 GHz and . The cavity is filled with 1.5 atm gas (90 % N2 and 10 % iso-C4H10) with a gas-handling system. Iso-C4H10 is used as the quenching gas to remove background 2 -ray annihilations.
3 Analysis and current status
The first run of the experiment is ongoing using the large bore magnet with no compensation (compensation magnets to reduce the uniformity to ppm are planned but are not yet installed). The 2 -ray annihilation rate has been measured at various magnetic field strengths with a fixed rf frequency.
3.1 Data analysis


Figure 4 shows examples of measured timing spectra. The peak coming from prompt annihilation and p-Ps decay is followed by the decay curve of o-Ps and then the constant accidental spectrum. A timing window of 30–200 ns is applied to select o-Ps events. Figure 5 shows the 2 transition spectrum, which is obtained as follows:
- 1.
The accidental contribution is subtracted using the timing window 700–900 ns.
- 2.
The ordinary o-Ps decay spectrum is also subtracted. This spectrum is obtained by running without RF power, and is normalized to the 2 transition spectrum in the region 380–460 keV.
The 2 transition spectrum is measured at different magnetic field strengths. The resonance line obtained is shown in Figure 6.
Fitting the measured points with the Breit-Wigner function,
| (2) |
results in a constant of , a center value of the magnetic field of (11 ppm), and a width of .
The main source of systematic error is the uniformity of the magnetic field (142 ppm in ). Other sources are considered to be negligible. The preliminary value of calculated from equation (1) is
| (3) | |||||
which is consistent with both of the previous experimental values and with the theoretical value.
3.2 Future plan
The following improvements are planned for future measurements:
- 1.
Compensation magnets will be installed and ppm magnetic field uniformity is expected to be achieved.
- 2.
Measurements at various pressures of will be performed to estimate the material effect (the Stark effect). The accumulation of these measurements will result in an ppm statistical error within a few years.
- 3.
The timing information allows for a measurement of Ps thermalization as a function of time [4]. We can thus precisely measure the material effect including the thermalization effect.
4 Conclusion
A new experiment to measure the Ps-HFS which reduces possible common uncertainties in previous experiments has been constructed and the first run is ongoing. A preliminary value of has been obtained, which is consistent with both of the previous experimental values and with the theoretical calculation. Development of compensation magnets is underway with a view to obtaining ppm magnetic field homogeneity for future runs. A new result with an accuracy of will be obtained within a few years which will be an independent check of the discrepancy between the present experimental values and the QED prediction.
References
References
- [1] Ritter M W, Egan P O, Hughes V W and Woodle K A 1984 Phys. Rev. B 30 1331
- [2] Mills A P Jr 1983 Phys. Rev. A 27 262
- [3] Kniehl B A and Penin A A 2000 Phys. Rev. Lett. 85 5094
- [4] Kataoka Y, Asai S and Kobayashi T 2009 Phys. Lett. B 671 219
- [5] Grotch H and Hegstorm R A 1971 Phys. Rev. A 4 59