Pushing the Boundaries of Conventional Core-Collapse Supernovae: The Extremely Energetic Supernova SN 2003maNote: August 24, 2026
Abstract
We report the discovery of a supernova (SN) with the highest apparent energy output to date and conclude that it represents an extreme example of the Type IIn subclass. The SN, which was discovered behind the Large Magellanic Cloud at by the SuperMACHO microlensing survey, peaked at mag and only declined by 2.9 mag over 4.7 years after the peak. Over this period, SN 2003ma had an integrated bolometric luminosity of ergs, more than any other SN to date. The radiated energy is close to the limit allowed by conventional core-collapse explosions. Optical spectra reveal that SN 2003ma has persistent single-peaked intermediate-width hydrogen lines, a signature of interaction between the SN and a dense circumstellar medium. The light curves show further evidence for circumstellar interaction, including a long plateau with a shape very similar to the classic SN IIn 1988Z – however, SN 2003ma is ten times more luminous at all epochs. The fast velocity measured for the intermediate-width H component ( 6000 km s-1) points towards an extremely energetic explosion ( ergs), which imparts a faster blast-wave speed to the post-shock material and a higher luminosity from the interaction than is observed in typical SNe IIn. Mid-infrared observations of SN 2003ma suggest an infrared light echo is produced by normal interstellar dust at a distance 0.5 pc from the SN.
Subject headings
circumstellar matter — supernovae: individual (SN 2003ma) — dust, extinctionI. Introduction
Hydrogen-rich (Type II) core-collapse supernovae (SNe) from massive stars typically have peak luminosities corresponding to absolute magnitudes mag that are powered by thermal energy that is deposited into the expanding SN envelope during shock breakout [56]. Depending on the mass of the hydrogen (H) envelope, a plateau can arise in the optical light curve from a cooling wave of H recombination that recedes through the ejecta layers. After this photospheric phase, the light curve displays an exponential decline when it is predominantly powered by the radioactive decay of isotopes created in the explosion (56Ni Co Fe).
In the presence of a dense circumstellar medium (CSM), the expanding SN shock will collide with the CSM and convert the bulk kinetic energy of the explosion into light [13], and produce a relatively narrow (2 – 4 km s-1) H line that is the hallmark of SNe IIn [78]. The additional luminosity from the circumstellar interaction can be extremely large and even dominate the total luminosity. Furthermore, while the luminosity from radioactive decay will decline quickly after a few months, the luminosity from circumstellar interaction can persist at a near-constant level for several years.
Recently, several extremely luminous SNe have emerged with peak luminosities with mag. SN 2006gy had a very long rise time (70 days) and peaked at mag [83, 66]. SN 2008fz had a similar peak brightness ( mag) and light-curve shape [21]. SN 2005ap was very luminous at peak ( mag), but had a fast rise and decay. SN 2008es was similar to SN 2005ap, peaking at mag and having a fast rise and decline [64, 38]. A self-obscured luminous supernova, SN 2007va, was detected by [51] only in the infrared with an absolute mid-IR peak magnitude of . More recently, Quimby et al. [70] and Gal-Yam et al. [31] announced the discovery of three extremely luminous SNe, respectively, which they suggest are powered by a pulsational pair instability [102]. [68] finds evidence that these extremely luminous SNe may be connected to SN Ic.
A pulsational pair instability is expected to be important in only the most massive stars – those exceeding 95 . The production of electron-positron pairs results in a contraction and then explosive nuclear burning which ejects some significant number of solar masses worth of material from the envelope. Subsequent repetitions of this sequence of events result in ejected shells catching up with previous ejected material, now at much larger radius, producing radiated energy due to the shell collisions. This process is estimated to be capable of producing ergs of light and, as importantly, can repeat on short timescales, providing longer-timescale luminosity.
The energetics of these events push the envelope of our understanding of stellar evolution. The peak luminosity, if powered by radioactive decay, would require 10 of 56Ni. This very large amount points to an extremely massive progenitor and the possibility that these events were the result of a pair-instability SN [7, 10]. Alternatively, a significant amount of the luminosity may be produced by circumstellar interaction, but the mass of the CSM necessary for the luminosity still indicates that the progenitors must have been massive stars with significant mass-loss histories.
Furthermore, there is a limit on the energy for which conventional core-collapse explosions are viable. Under a conventional core-collapse explosion, the maximum energy emitted by a SN is equivalent to the rest mass of a neutron star, a few ergs, with 99% being emitted as neutrinos [100, e.g.,]. The remaining energy, a few ergs, is either coupled to the baryonic material as kinetic energy, or emitted as electromagnetic radiation. If a SN has demonstrably greater than a few ergs, the conventional core-collapse scenario must be re-examined. This argument has been used for the extremely energetic broad-lined SNe Ic associated with gamma-ray bursts [101, 45, e.g.,]; although these constraints are placed on this class of objects using the kinetic energy, not the radiated energy.
In the local universe, there have been several well-observed SNe IIn: SNe 1988Z [92], 1994W [85], 1995N [30], 1998S [53, e.g.,], 1999el [18], 2005ip [84], and 2007rt [91]. In addition to their similar spectral evolution, SNe IIn all have long plateaus in their light curves after an initial decline. This plateau is from shock energy being continuously converted into visual light through circumstellar interaction. Once the shock extends to a radius where the density of the CSM drops, the source of the luminosity is diminished and the SN fades significantly.
Observations suggest that dust can form in the ejecta of SNe [65, 50, 90, 82, 72, 29, 49]. This process appears to be enhanced by increasing the density of the CSM; i.e., SNe IIn appear to be better at forming dust than SNe IIP. An infrared light echo can appear at late times when light from the SN explosion reaches a dust shell, and the UV/optical light is reprocessed into the infrared [35, e.g.,].
Here we present SN 2003ma, discovered behind the LMC by the SuperMACHO microlensing survey. SN 2003ma has the light curve shape and spectral signatures of a SN IIn, but with a peak luminosity comparable to the most luminous SNe ever discovered. In Section II we describe the densely-sampled SuperMACHO and OGLE-III difference imaging photometry (covering a baseline of 12 years, and the SN light curve over 4.7 years), and spectroscopy taken at the peak of the SN, and 1, 2, 5, and 6 years later, and in Section III we compare the observations to well studied SNe IIn. In Section IV we calculate the total bolometric luminosity and energy output of the SN, and show that it exceeds the radiative output of any other SN observed to date. We compare possible models for the source of the energy, and show evidence for an IR echo from variable IR flux measured in archival Spitzer IRAC observations. In Section V, we summarize our results.
II. Observations & Reductions
II.1. Optical Photometry
Starting in 2001, the SuperMACHO Project microlensing survey used the CTIO 4 m Blanco telescope with its 8K 8K MOSAIC imager (plus its atmospheric dispersion corrector) to monitor the central portion of the LMC every other night for 5 seasons (September through December). The images were taken through our custom “” filter ( nm, nm; NOAO Code c6027) with exposure times between 60 and 200 seconds, depending on the stellar density of each field. In addition to the filter, images were occasionally obtained through the and filters. Throughout this paper, we denote brightnesses measured in the natural CTIO magnitude system as , SM and as defined in Miknaitis et al. [63]. To search for variability, PSF-matched template images were subtracted from search images [71, 32, 63]. The resulting difference images are remarkably clean of the (constant) stellar background and are ideal for searching for variable objects. Our pipeline detects and catalogs all variable sources.
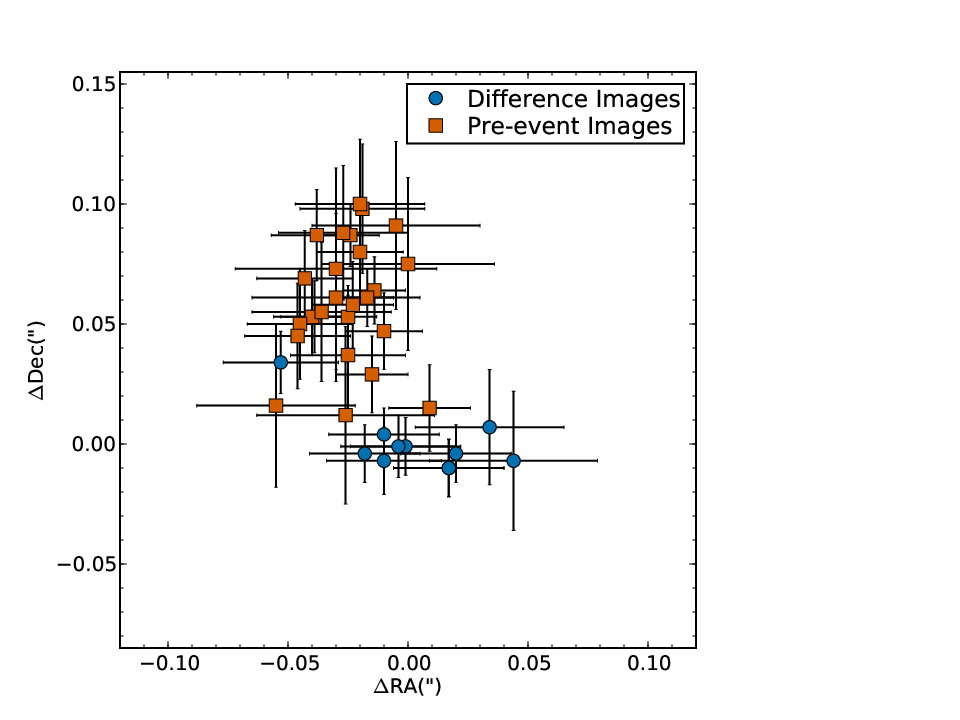
On 2003 December 13, the SuperMACHO survey detected a non-microlensing transient event at position :31:01.878, :04:15.89 with a magnitude of 20.53. The panels in Figure 1 show from left to right cut-outs from a pre-event image (2001 November 20), an image 4 days after discovery ( 6 days before the peak; 2003 December 17), and their difference image, respectively. The event position in the difference images is arcsec to the south of a source (the presumed host galaxy) in the pre-event template image (see Figure 2). At a redshift of of SN 2003ma and its host (see Section II.3), this corresponds to a projected distance of pc. The host galaxy has apparent magnitudes of mag, mag, and mag.

SN 2003ma was also detected by the OGLE–III survey (2001 – 2009), which is a photometric survey using a dedicated 1.3-m Warsaw telescope located at the Las Campanas Observatory, Chile, operated by the Carnegie Institution of Washington. The camera uses eight SITe CCD detectors with 15 µm pixels resulting in 0.26 arcsec pixel-1 scale and arcmins total field of view. For the details of the instrumentation setup we refer the reader to Udalski [93]. Approximately 500 photometric points per star towards the LMC were accumulated over eight seasons, between July 2001 and May 2009. Most of the observations were carried through the Cousins I-band filter with exposure times 180 seconds. Full description of the reduction techniques, difference image analysis, photometric calibration and astrometric transformations can be found in Wozniak [103], Udalski et al. [95].
Pre-event I-band data were also gathered during the OGLE–II survey (1996 – 2000), which used the same dedicated telescope as OGLE–III, but was equipped with a single CCD [94]. Since the QE of the two CCD’s are slightly different, we apply a small 2% correction to the OGLE–II data so that their average flux matches the pre-event flux in the OGLE–III. Since the OGLE-II data is several years before the event, we used it to test for pre-event variability, for example caused by an active galactic nucleus (AGN).
The upper and lower panels of Figure 3 shows the difference image light curves from the SuperMACHO and OGLE surveys. Images with poor seeing and/or significant cloud cover are more likely to have large (and non-Poissonian) systematic uncertainties. Therefore, only images with seeing better than and with atmospheric extinction less than 1 mag are used for the analysis. We make an exception for images from July and August 2008, which typically have poor seeing, but are crucial for understanding the late-time behavior of SN 2003ma. For these months, images with seeing better than were retained. Since there are several images in all filters from 2008, we were able to average the flux from these images.

Because difference imaging reveals more instrumental and reduction artifacts than there are real variable objects in an image, standard profile-fitting software package, like DoPHOT [76], have problems determining the optimal PSF in the difference image. To remedy this, we implement a customized version of DoPHOT that uses the applicable PSF from the original image [71, 32]. After an object is detected in any difference image we “force” photometry in all difference images at the event position regardless of the flux level. We thus measure the flux in pre-event images and negative fluxes are possible. These measurements are critical for constraining the light curves. For example the pre-event light curve () is consistent with no variability, indicating that the host galaxy has not demonstrated a history of variability that would indicate the presence of an AGN.
In addition to the SuperMACHO images, several and images were obtained on 2001 November 20, 2004 September 20, 2004 October 21, 2008 July 27, and 2008 August 26. The images from 2001 November 20, obtained before the event, are used as the template images for these filters.
The middle panel of Figure 3 shows the OGLE -band difference image photometry (small black circles). Mainly because of the difference in telescope aperture (1.3 m for OGLE and 4 m for SuperMACHO), the signal-to-noise ratio (S/N) of the OGLE photometry is significantly lower than that of the SuperMACHO data. To obtain measurements with sufficient S/Ns, we have binned the OGLE data (lower panel of Figure 3). Since the OGLE observations are taken in blocks, we divide each block in two equal parts, each containing the same amount of measurements. The only exception is during peak, where the S/N of the measurements is significantly higher, and in addition the light curve evolves faster. Thus around peak (), we average the data in 5-day bins, and in 25-day bins in the range . In the following analysis, we only use the averaged OGLE data.
We convert the CTIO 4 m difference flux detections into apparent magnitudes (see Figure 4 and Table 1) in the natural CTIO 4 m magnitude system, and we correct for extinction as described in Section IV.1. The OGLE measurements have been converted into standard I-band magnitudes using the standard OGLE photometric calibration [103, 95].

| MJD | SM | |||
|---|---|---|---|---|
| 52959.29126 | ||||
| 52964.27804 | ||||
| 52966.28245 | ||||
| 52970.30195 | ||||
| 52972.29799 | (0.43) | |||
| 52974.25935 | (0.19) | |||
| 52976.26257 | (0.09) | |||
| 52979.64149 | ||||
| 52982.71623 | ||||
| 52985.24459 | (0.03) | |||
| 52986.27416 | (0.03) | |||
| 52988.68744 | (0.18) | |||
| 52988.28817 | (0.02) | |||
| 52990.25875 | (0.02) | |||
| 52992.29069 | (0.03) | |||
| 52992.73489 | (0.10) | |||
| 52994.31115 | (0.02) | |||
| 52996.28857 | (0.02) | |||
| 52997.44242 | (0.09) | |||
| 52998.25951 | (0.02) | |||
| 53000.31187 | (0.02) | |||
| 53001.72660 | (0.08) | |||
| 53004.32118 | (0.02) | |||
| 53011.28573 | (0.10) | |||
| 53019.31815 | (0.02) | |||
| 53029.29812 | (0.04) | |||
| 53052.97253 | (0.05) | |||
| 53077.45696 | (0.05) | |||
| 53106.03597 | (0.07) | |||
| 53257.38920 | (0.05) | |||
| 53268.26639 | (0.17) | |||
| 53268.27047 | (0.06) | |||
| 53285.33774 | (0.07) | |||
| 53289.21636 | (0.06) | |||
| 53295.33515 | (0.06) | |||
| 53297.22518 | (0.06) | |||
| 53299.36194 | (0.06) | |||
| 53299.36544 | (0.40) | |||
| 53299.36742 | (0.10) | |||
| 53315.28817 | (0.06) | |||
| 53325.24440 | (0.06) | |||
| 53329.29664 | (0.06) | |||
| 53331.34066 | (0.06) | |||
| 53348.18819 | (0.06) | |||
| 53350.32545 | (0.07) | |||
| 53352.23171 | (0.06) | |||
| 53354.23758 | (0.06) | |||
| 53356.25495 | (0.07) | |||
| 53404.63460 | (0.12) | |||
| 53414.22055 | (0.06) | |||
| 53639.30253 | (0.10) | |||
| 53641.33128 | (0.12) | |||
| 53649.38498 | (0.11) | |||
| 53652.32054 | (0.11) | |||
| 53654.22569 | (0.10) | |||
| 53663.32678 | (0.08) | |||
| 53684.22316 | (0.09) | |||
| 53704.30592 | (0.09) | |||
| 53706.22709 | (0.10) | |||
| 53712.35217 | (0.12) | |||
| 53714.35882 | (0.29) | |||
| 53733.16559 | (0.08) | |||
| 53738.16874 | (0.09) | |||
| 53777.61556 | (0.10) | |||
| 54006.82171 | (0.20) | |||
| 54127.67356 | (0.14) | |||
| 54402.73904 | (0.22) | |||
| 54502.13612 | (0.23) | |||
| 54674.41064 | (0.41) | |||
| 54674.42468 | (0.45) | |||
| 54704.35730 | (0.20) | |||
| 54704.37563 | (0.15) |
II.2. Infrared Photometry
We use archived images and catalogs from the Spitzer Space Telescope SAGE survey of the LMC [62] to measure the mid-infrared photometry of SN 2003ma. The SAGE survey covered a region centered on the LMC during two epochs, 2005 July 15 – 26 (epoch 1) and 2005 October 26 – November 2 (epoch 2) for its IRAC observations, and 2005 July 27 – August 3 (epoch 1) and 2005 November 2 – 9 (epoch 2) for its MIPS observations. We used the epoch 1 and 2 images provided by the SAGE team to produce small (300 pixel wide) cutouts around the position of SN 2003ma, for all four IRAC bands and the 24 µm MIPS band. The IRAC and MIPS cutouts have spatial scales of 1.2 and 2.5 arcsec pixel-1, respectively, and are all on a common coordinate reference frame.
Although an object was clearly visible at the position of SN 2003ma on several of the Spitzer images, we found that the SAGE catalog did not contain photometry for it in all bands, likely due to the presence of several bright stars near the SN 2003ma position. Moreover, because the crowding in the Spitzer images forced us to conduct artificial star tests in order to understand the true photometric errors, we performed our own PSF-fitting photometry on the image cutouts using DAOPHOT/ALLSTAR [89]. We used a threshold of 1 to find stars and a sequence of apertures for initial photometry. To derive a PSF for each image, we first selected 30 – 130 PSF stars for the IRAC images, and 18 for the MIPS 24 µm image. We then used an iterative procedure of fitting a PSF function to the PSF stars, subtracting neighboring sources, and then refitting the PSF function to the PSF stars, while increasing the order of the spatial variability of the function up to a maximum of two. After several iterations, we used the derived PSF to derive photometry for all detected sources. After subtracting all sources except for the PSF stars, we calculated aperture photometry of the PSF stars out to a radius of 11 pixels (132) for the IRAC images, and 29 pixels (725) for the MIPS 24 µm images. We used this aperture photometry to apply a correction to the PSF-fitted photometry. Finally, we matched the aperture-corrected photometry to that of sources in the SAGE catalog, and applied the zero-point differences to provide the photometric calibration.
For three of the images (epochs 1 and 2 for the 3.6 µm band, and epoch 1 for the 4.5 µm band), we found that the crowding in the images and the intrinsic faintness of the object left SN 2003ma still unmeasured, with no matching sources within 3 pixels of its position. For these three images, we thus use the 8.0 µm epoch 1 image positions as the master source list, and forced ALLSTAR to fit photometry at the positions, allowing only the sky and object magnitude to be free parameters.
To ensure that our derived photometric uncertainties were reasonable in the Spitzer images which all suffer from crowding, we performed artificial star tests. Artificial stars were added, a few at a time, to copies of the original images, measured using the photometric procedure described above, and then analyzed to evaluate the photometric errors, offsets, and completeness as a function of input magnitude. In the course of these tests, we added a total of 10,000 artificial stars, with magnitudes distributed evenly over the range mag, and with colors with respect to the other bands matched to those observed for SN 2003ma. The stars were added 50 at a time ( 5% of the real detected sources in each image) at random positions. Following the photometric measurement step, we recovered the detected artificial stars by first removing from the output lists all stars matching real sources detected in the original images, and then comparing the remaining sources with the list of input artificial stars. We then computed the average offset and dispersion in the input minus recovered magnitudes and the fraction of artificial stars recovered as a function of input magnitude.
Table 2 lists the Spitzer photometry of SN 2003ma, and the quantities derived from the artificial star tests. The measured flux in mJy is shown in the 3rd column. The flux uncertainty in the 4th column was determined by DAOPHOT and is typically between 5% - 15%. This is the appropriate relative uncertainty between the fluxes measured in the same band but different epochs, since any bias due to crowding should have nearly the same effect in both epochs assuming that the neighboring objects are not variable. For different wavelengths, the crowding is different and thus has a different impact on the photometry. Therefore our estimate for the total photometric uncertainty (6th column in Table 2) of SN 2003ma at each epoch is based on the mean photometric uncertainty arrived at in the appropriate magnitude range of the artificial stars lists. For all comparisons of fluxes from different bands, we use these total errors, which are 30%, 30%, 30 – 50%, 10 – 15%, and 20% for the 3.6, 4.5, 5.8, 8.0, and 24 µm images, respectively.
The average absolute offsets in the input minus recovered magnitudes of the artificial stars are typically smaller than 0.1 mags, such that we do not expect the Spitzer detections of SN2003ma to be spurious. The only exception is the 5.8 micron photometry, for which the absolute offsets are 0.5 mags. The average completeness for the 5.8 µm images at the magnitude of SN 2003ma was also 50%, which suggests that the 5.8 µm photometry is unreliable compared to that in the other bands. As a consistency check, we compared our unforced photometry to the recently complete, final catalog and archive lists from the SAGE project [62] and found them to be in agreement.
| Band | taaEpoch ID. Epoch 1 spans from 2005 July 15 – August 3, and epoch 2 from 2005 October 26 – November 9. | FluxbbFlux at the position of SN 2003ma. This flux contains both the flux of SN 2003ma as well as any potential flux from the host galaxy. | Flux relerrccFlux error as determined by DAOPHOT. This is the appropriate relative error between the fluxes measured in the same band at different epochs | FluxddAverage detected flux minus input flux as derived from artificial star tests, interpolated at the measured flux level of SN 2003ma in each image. | Flux erreeAverage dispersion in the detected flux minus the input flux from the artificial star tests, interpolated at the measured flux level of SN 2003ma in each image. | Compl.ffAverage completeness in %. |
|---|---|---|---|---|---|---|
| (µm) | (mJy) | (mJy) | (mJy) | (mJy) | (%) | |
| 3.6 | 1 | 0.063ggForced photometry. | 0.006 | 0.006 | 0.018 | 46.4 |
| 4.5 | 1 | 0.048ggForced photometry. | 0.003 | 0.003 | 0.014 | 53.3 |
| 5.8 | 1 | 0.059 | 0.004 | 0.017 | 0.017 | 38.9 |
| 8.0 | 1 | 0.108 | 0.004 | 0.014 | 0.018 | 77.3 |
| 24.0 | 1 | 1.164 | 0.080 | 0.099 | 0.227 | 94.4 |
| 3.6 | 2 | 0.055ggForced photometry. | 0.003 | 0.005 | 0.019 | 40.9 |
| 4.5 | 2 | 0.065 | 0.003 | 0.006 | 0.014 | 65.6 |
| 5.8 | 2 | 0.028 | 0.004 | 0.015 | 0.013 | 13.6 |
| 8.0 | 2 | 0.184 | 0.006 | 0.014 | 0.022 | 89.3 |
| 24.0 | 2 | 1.141 | 0.108 | 0.098 | 0.228 | 94.0 |
II.3. Spectroscopy
We followed SN 2003ma spectroscopically for nearly six years using the 8 m Gemini-South telescope (with GMOS; Hook et al. 42) and the 6.5 m Magellan Clay telescope (with LDSS2; Allington-Smith et al. 2, LDSS311 1 http://www.lco.cl/telescopes-information/magellan/instruments-1/ldss-3-1/ ., and MagE; Marshall et al. 58). The spectra22 2 The Gemini South GMOS spectra were obtained as part of the GS-2003B-Q-12 science program and the header target name in the images and spectra was cand10194.sm76_4. are presented in Figure 5 and a journal of observations are presented in Table 3.

| PhaseaaRest-frame days since maximum, 2003 December 20.8 (JD 2,452,994.3). | UT Date | Telescope / | Exposure |
|---|---|---|---|
| Instrument | (s) | ||
| 1 | 2003 December 22.3 | Gemini South/GMOS | |
| 279 | 2004 December 14.1 | Magellan/LDSS2 | 1500 |
| 905 | 2005 October 29.3 | Magellan/LDSS3 | 900 |
| 1423 | 2008 December 28.3 | Magellan/MagE | |
| 1649 | 2009 October 17.3 | Magellan/MagE | 1800, 1200 |
Standard CCD processing and spectrum extraction were accomplished with IRAF. The data were extracted using the optimal algorithm of Horne [43]. Low-order polynomial fits to calibration-lamp spectra were used to establish the wavelength scale, and small adjustments derived from night-sky lines in the object frames were applied. For the MagE spectrum, the sky was subtracted from the images using the method described by Kelson [46]. We employed our own IDL routines to flux calibrate the data and remove telluric lines using the well-exposed continua of the spectrophotometric standards [99, 27, 26].
The 2004 spectrum was obtained far from the parallactic angle at high airmass. As a result, its continuum and any derived line ratios are likely incorrect [25]. Since the offset between the SN and host is very small, we were not able to perform local galaxy subtraction during extraction. For the 2003 and 2008 spectra, we have calibrated our absolute spectrophotometry to match concurrent photometry of the SN and host combined. This is not possible for the 2004 and 2005 spectra because of incorrect relative spectrophotometry and a small wavelength range that does not fully cover any of our broad-band filters, respectively.
Several narrow galactic emission lines are present in all spectra and are identified in Figure 6 at a redshift of . Throughout this paper we assume a cosmology with km s-1 Mpc-1, , , which yields a luminosity distance of Mpc for the SN redshift.

III. Comparisons to Other Core-Collapse Supernovae
III.1. Spectroscopic Comparisons
The five spectra of SN 2003ma are presented in Section II.3. The 2008 and 2009 spectra are dominated by host-galaxy light (see Figure 6); however, there is a strong, broad component to the H line. We are confident that this broad component is from the underlying SN and not from another source such as an AGN (for instance, the broad component is not visible in our 2003 spectrum).
The 2003 spectrum is much bluer than the late-time spectra, indicating that it contains more SN light than the late-time spectra, which is not surprising considering that the SN was 3 mag brighter in 2003 compared to 2008. In order to isolate the SN continuum in the 2003 spectrum, we have subtracted a galaxy template spectrum from the 2003 spectrum. We chose the galaxy template to match the general continuum shape of the late-time spectra. The pre-event photometry can be used to properly scale the galaxy template. Similarly, the photometry at the time of each SN spectrum can be used to scale each spectrum. Unfortunately, this procedure produces a galaxy spectrum that is 10% too bright compared to the late-time spectrum (assuming that the late-time spectrum is dominated by the host galaxy). However, considering the fact that the galaxy template spectrum does not include emission lines and there may be crowding in the template image, we do not consider this to be a significant discrepancy. The galaxy template spectrum was rescaled to match the continuum of the 2008 spectrum and subtracted from both the 2003 and 2008 spectra.
We present the dereddened (our spectra of SN 2003ma have only been corrected for foreground extinction based on Galactic dust maps Schlegel et al. 77; see Section IV.1) galaxy-subtracted 2003 and 2008 spectra in Figure 7. We compare these spectra to those of SN 2005ip [84], after dereddening the spectra of SN 2005ip by mag to account for Milky Way extinction. In order to match the continuum slope of SN 2003ma, we add an additional mag of host extinction. Smith et al. [84] found that SN 2005ip may have had host extinction of mag based on measurements of Na D absorption, however since the absorption features were only clearly detected in the spectrum taken 1 day after discovery, they were unsure of the true magnitude of extinction. It seems unlikely that SN 2005ip suffered from mag of reddening without strong Na D absorption. Instead, the difference in continuum shapes may indicate that SN 2003ma was hotter at this epoch than SN 2005ip (see also Section IV.2).

At maximum, both SN 2003ma and SN 2005ip have relatively featureless continua. With the applied extinction corrections, there are no significant deviations between the two spectra. The spectrum of SN 2003ma is consistent with that of a blackbody. There is a low amplitude, broad feature in the SN 2003ma spectrum at 6150 Å(in the rest frame) that may correspond to H absorption. If this identification is correct, the feature would have an absorption minimum blueshifted by 20,000 km s-1. In Figure 7, we also compare the 2008 spectrum of SN 2003ma to the day spectrum of SN 2005ip [84]. The continua of the spectra match, but this may be the result of an incorrect treatment of the galaxy contamination. The only feature of significance is the H line, which is much broader for SN 2003ma compared to SN 2005ip. The broad H line is also seen in the 2009 spectrum, but at lower equivalent width.
We detect narrow He I emission in the spectra from 2004, 2008, and 2009, but do not detect it in the 2003 spectrum (the wavelength range of the 2005 spectrum does not cover this feature). The 2003 spectrum has a relatively low S/N, and the He I may be too weak to be detected. Alternatively, in Section IV.2, we argue that the blackbody temperature in 2003 was K, which should produce sufficient high-energy photons to singly ionize He. In Figure 6, we tentatively identify relatively broad He II in the 2008 spectrum. If correct, this would require a significant amount of ionizing far-UV or X-ray photons from the circumstellar interaction to ionize He in the post-shock material. However, as shown in Figure 7, SN 2005ip has several narrow lines in this region of the spectrum. It is possible that the 2008 spectrum of SN 2003ma does not have a high enough S/N to see these individual lines.
In SNe IIn, the H line can have up to four distinct components: broad, intermediate, narrow, and galactic. Smith et al. [84] was able to identify the first three regions for SN 2005ip, while the fourth component was not seen. Physically, the broad, intermediate, and narrow components are formed in the fast-moving SN ejecta, the post-shock circumstellar material, and the pre-shock circumstellar material, respectively. The widths of the broad and narrow components indicate the velocity of the SN ejecta and the circumstellar wind/ejection, respectively, while the intermediate component is an indication of the amount of energy transferred from the shock to the circumstellar material. The galactic component, which is the line-of-sight emission from the host galaxy and physically unrelated to the SN, may have a similar velocity to that of the narrow component.
In Figure 8 we show the narrow [O I] 6300, H, [N II] 6548, 6583, and [S II] 6716, 6731 emission lines fitted with a Voigt profile with its width fixed to that of the [N II] 6583 line in each spectrum. The Voigt profile produces better fits to the wings of the narrow lines than a single Gaussian. The narrow lines are unresolved in the 2003 and 2004 spectra, but the high resolution of the 2008 and 2009 spectra resolves the narrow lines to have a km s-1. In 2004, 2008, and 2009 we fit the broad base beneath the H[N II] narrow-line complex with a Gaussian. The best fit was for a Gaussian with km s-1 and a velocity offset of km s-1 relative to the narrow H line. This velocity offset could be due to asymmetries in the line profile. The broad component is not detected in the 2003 spectrum, and we place an upper limit on the presence of this Gaussian component to be times the flux of the narrow H line. The ratio of the broad component to the narrow component of H is , , and in 2004, 2008, and 2009, respectively. The change in this ratio is not statistically significant, and systematic effects such as different position angles of the slit and varying seeing can also produce differences.
| Year | [OIII]/H | [NII]/H | [SII]/H |
|---|---|---|---|
| 2003 | 1.98 0.07 | 0.18 0.01 | 0.21 0.02 |
| 2004 | 2.19 0.03 | 0.23 0.04 | 0.21 0.03 |
| 2005 | 2.10 0.07 | ||
| 2008 | 2.19 0.05 | 0.22 0.02 | 0.18 0.01 |
| 2009 | 1.71 0.12 | 0.19 0.02 | 0.17 0.01 |
We measure the standard diagnostic [O III]/H and [N II]/H, and [S II]/H narrow-line ratios [5, 96], which are insensitive to extinction and atmospheric refraction, for each spectrum from the Voigt profile fits. The narrow-line ratios, listed in Table 4, are all consistent with a star-forming galaxy. This, in combination with the lack of variability in the densely sampled SuperMACHO and OGLE difference imaging data over a baseline of 7 years before the SN, place strong constraints on the presence of an AGN in the host galaxy.
If the broad H component is powered by CSM interaction, then we expect there to be some contribution to the narrow H and H emission lines. However, with no observed velocity offset between the expected narrow component from the SN and the host galaxy emission lines, it is difficult to tell if the SN contributes to the narrow emission lines. Furthermore, the narrow-line ratios are measured to be constant within the errors from 2003 to 2008, and thus the lines are most likely dominated by the H II regions in the host galaxy. The luminosity of the H line in 2003, when the broad component of H associated with the SN is not yet observed, is ergs s-1, which corresponds to a substantial star-formation rate of year-1 characteristic of a starburst galaxy [47].
At day 905, SN 2005ip had been on its plateau for over 2 years, and the broad component of its H line had faded by a factor of 6 while its narrow+intermediate H line, which is assumed to be powered by interaction with the CSM, had increased by a factor of 3, resulting in a nearly constant total H luminosity [84]. At this epoch, the FWHM of the intermediate component and broad component of H were km s-1 and km s-1, respectively [84]. In comparison, at day 279 and 1423, SN 2003ma was on its second plateau and also most likely dominated by circumstellar interaction, however the width of the broad component of its H line is at least 5 times larger than the intermediate component seen in SN 2005ip. Similarly, it is significantly broader than the intermediate component of H observed in SNe IIn 1988Z, 2006tf, and 2007rt which had a characteristic width of 2000 km s-1 [3, 80, 91] and SN 2006gy which had an intermediate component with 4000 km s-1 [83].
The 6000 km s-1 component seen in the 2004 and 2008 spectra of SN 2003ma could be associated with SN ejecta that has decelerated over time. The width of the broad component of H was observed to decrease from 15,000 km s-1 on day 34 to 5000 km s-1 after day 500 in SN 1988Z [3] and decrease from 10,000 km s-1 on day 102 to km s-1 after day 273 in SN 2007rt [91]. It may be that the day 1 spectrum of SN 2003ma was too early, and the day 279 spectrum was too late to catch the broad component when it had a velocity width of tens of thousands of km s-1. However, given the long-lived plateau in the light curve, circumstellar interaction must be the dominant source of energy after day 90. Thus, the broad component in SN 2003ma is most likely an exceptionally fast “intermediate component” that is the result of the interaction with the CSM of a highly energetic explosion, even more energetic than SN 2006gy (see Section IV.5), which imparts a much faster blast-wave speed to the postshock shell. However, electron scattering can also be a significant source of broadening of the H line in interacting SNe, and thus the speed of the material may be slower than inferred from the width of the line [17].

III.2. Photometric Comparisons
The I-band light curve of SN 2003ma has two nearly flat plateaus, and strong emission in the and bands for 1000 days, reminiscent of the long-lived emission seen in interacting SNe IIn. Although the first plateau in the rest-frame R-band is similar to the initial plateau seen in SNe IIP, its comparable plateau in the rest-frame B band is unlike IIP SNe which begin their decline immediately after the peak in the B band. Figure 5 shows a comparison of SN 2003ma to canonical SN IIP 1999em [54, 22], along with extreme interacting SNe IIn 1988Z [3] and 2005ip [84], and extremely luminous SN IIn 2006gy [66, 83], SN IIL 2005ap [69], SN IIL 2008es [64, 38], and normal SN Ia 1988aq [73]. All light curves are corrected for Galactic extinction, and in the case of SN 1999em and SN 2006gy for internal extinction [54, 83]. K-corrections are applied to SNe at distances farther than 100 Mpc.
In SNe IIP, a plateau is observed in the V and R bands as a result of H recombination in the SN ejecta. The plateau is not seen at shorter wavelengths ( and bands) due to sensitivity to the declining temperature and line blanketing from metals, nor at longer wavelengths ( band) since the bandpass is on the Rayleigh-Jeans tail of the emission the whole time [54].
The SuperMACHO data constrains the pre-maximum light curve of SN 2003ma exceedingly well (see Figure 12). The first significant detection is 4.5 mag below peak 20 days before maximum, and we estimate the day of explosion to be between the last upper limit and the first detection at . The slow decline of the band (rest-frame band) in the first plateau ( or days) of mag day-1 and in the second plateau ( or days) of mag day-1 is much flatter than the 481 day decline seen in SN IIn 2007rt with 0.006 mag day-1 [91], and is more like the extreme plateaus observed in the light curves of SNe IIn 1988Z and 2005ip (see Figure 12). The slow decline in these SNe IIn light curves are explained by an excess of emission above the photospheric emission produced by the interaction of the SN ejecta with circumstellar material. The spectra of these SNe demonstrated broad Balmer emission lines, with a narrow component and no P-Cygni absorption, suggesting that the emission is confined to an outer shell [92].
The color evolution of SN 1988Z and SN 2003ma, shown in Figure 13, are remarkably similar. The extremely flat plateaus of this type of SN are attributed to an increase in narrow and intermediate-width H flux as well as a forest of other narrow lines powered by the circumstellar interaction [80]. The decreasing H line velocity width over time in SN 1988Z was successfully modeled by Aretxaga et al. [3] as the consequence of a SN remnant shock expanding into a dense medium. The fact that SN 2003ma is bluer than SN 1988Z in particular during the early phases can be attributed to the higher blackbody temperature.
IV. Physical Parameters of SN 2003ma
IV.1. Extinction
We use the typical galactic extinction law of Cardelli et al. [11] parameterized by a value of . We obtain33 3 http://irsa.ipac.caltech.edu/applications/DUST/ a combined Galactic and LMC reddening of mag at the position of SN 2003ma from Schlegel et al. [77]. As a consistency check, we examine the spectra of SN 2003ma for tracers of interstellar dust. The Na D doublet is not detected at or near zero velocity in any of our spectra. The 2008 spectrum of SN 2003ma, which has a resolution of 20 km s-1, is ideal for examining the Na D doublet. We present the wavelength regions from that spectrum which correspond to the rest-frame Na D doublet for the Milky Way, LMC, and host galaxy of SN 2003ma in Figure 9. From this spectrum, we can rule out Na D absorption with an equivalent width of Å from the Milky Way and the LMC. Using the relationship of Barbon et al. [6], we expect mag from the Milky Way and the LMC, respectively. However, Blondin et al. [9] found mag for objects with Na D equivalent widths below about 0.3 Å. We therefore believe that our measurements of Na D are consistent with the Schlegel et al. [77] extinction estimates.

In Figure 9, we see that there is a possible detection of Na D absorption from the host galaxy at a redshifted velocity of km s-1 relative to the host galaxy with a width of km s-1, the resolution of our spectrum. However, we do not see a narrow emission line component from the SN that is offset from the emission lines of the host galaxy. There are three possible explanations for the lines. First, the lines could be a spurious detection caused by random noise. This is plausible given the level of noise in the spectrum and the slightly odd line profiles. Second, there could be an absorbing cloud traveling toward SN 2003ma. SN 2003ma is at the same redshift as its host galaxy; therefore, SN 2003ma (either in a disk or the halo) would have its velocity vector pointing mostly perpendicular to our line of sight. If the cloud is in the disk, then SN 2003ma must be in the halo, and likewise, if SN 2003ma is in the disk, then the cloud must be in the halo. Third, there is local material falling inward towards SN 2003ma. Either circumstellar material or gas from an H II region may be under gravitational collapse, however the velocity appears to be very high for such a scenario. Given the possibilities, we believe the most plausible is that there is no significant Na D absorption near the redshift of the host galaxy, which indicates no additional extinction from the host galaxy. However, the fact that there is a strong IR echo (see Section IV.8) in combination with the type of the host galaxy being a star-forming galaxy which are generally dust-rich, makes it very likely that there is significant extinction in the host. The lack of Na D absorption might then be due to bleaching of the Na D doublet out to a few hundred pc by photoionizing Na I to Na II. Considering all these circumstances we assume as a lower limit no additional extinction from the host galaxy throughout the paper. Consequently, the total assumed mag is also a lower limit. Any additional extinction beyond the Milky Way Galaxy and LMC foreground component increases the required SN luminosity and hence makes the SN even more extreme in its characteristics.
For each passband, we compute the combined Galactic and LMC extinction at its effective wavelength with using Equation 1 from Cardelli et al. [11]. Table 5 shows the effective wavelengths and extinction for the various passbands in the second and third column, respectively.
IV.2. Temperature at Peak
As described in Section III.1, we obtained a spectrum of the event and host galaxy on 2003 December 22, 3 days after peak. To examine the temperature of this spectrum, we focus on the dereddened, galaxy-subtracted spectrum (see Section III.1 and Figure 7). We ignore the region of the spectrum corresponding to 6350 – 6800 Å in our analysis below to avoid any H contamination. The spectrum shows a blue continuum without any significant emission or absorption lines. This is similar to the spectra of SNe II caught within days of explosion which also show a relative featureless blue continuum which can be fitted with blackbody temperatures of 10,000 – 20,000 K [16, 15, 38, e.g.,]. The earliest spectrum of SN 2005ip also demonstrates a blue, featureless continuum on day 1 after discovery that is fitted with a blackbody with K; however, this temperature is most likely a lower-limit due to the uncertainty in the amount of internal extinction [84].
Figure 10 shows the 2003 galaxy-subtracted spectrum of SN 2003ma (black line), in comparison to black bodies of 5000, 10,000, 15,000, and 20,000 K. In order to further constrain the blackbody fit, we use the observed broadband fluxes in SM and (blue square and red diamond). The horizontal error bars indicate the width of the filters. Black bodies with K do not fit well (see solid orange line and dashed sky blue). For higher temperatures, a differentiation is not possible since the observed wavelength range only covers the Rayleigh-Jeans tail of the blackbody. Therefore we can only set a lower limit of the temperature at peak of K.

IV.3. Absolute Magnitudes
We calculate the absolute magnitude in the rest-frame filter from an observed magnitude in filter as
| (1) |
where is the extinction in filter as described in Section IV.1, is the distance modulus and is the K-correction. For a redshift of , we compute mag. At this redshift, the filters , , and in the observers frame are best matched by the rest-frame filters , , and , respectively. The K-correction as well as the bolometric correction described in the next section depend on the choice of the spectral energy distribution (SED) used to represent the SN SED. Due to the limited wavelength range of the observed spectra in addition to the imperfect background subtraction in particular for the later time spectra, we cannot use the SN 2003ma spectra to directly calculate the bolometric correction. Thus, we choose the following two SED models:
- •
Solar model: The solar spectrum is often used to estimate the bolometric correction. Although it does not necessarily represent the true underlying SED, it is commonly used in the literature for other SNe, and thus it allows for a direct comparison to them.
- •
BB15K/88Z model: As we show in Section IV.2, the peak temperature is K. Thus we choose a 15,000 K blackbody as our SED during the peak (). Motivated by the fact that the light curves and color evolution of SN 2003ma are very similar to SN 1988Z after peak, we use the 6 April 1989 spectrum of SN 1988Z as the SED for the first plateau (), and an average of three SN 1988Z spectra (corresponding to dates 18 April 1990, 20 February 1991, and 4 February 1992) for the second plateau (). The particular SN 1988Z spectra were chosen for their large wavelength coverage (4500 – 9000 Å) and high S/N.
While the solar SED is simple and should provide reasonable measurements, the BB15K/88Z model is the more physical model since it attempts to accurately describe the SN SED. The fifth column in Table 5 and the third through fifth columns in Table 6 show the K-corrections for the two models. Note that the differences between the K-corrections derived from the different models are a few tenths of a magnitude. Figure 5 and 12 show the absolute magnitude light curve of SN 2003ma (blue squares and red circles) derived assuming the solar SED for the K-corrections.


IV.4. Luminosity & Energy
We derive the luminosity of SN 2003ma in a passband and its bolometric luminosity by comparing it to the sun with
| (2) | ||||
| (3) |
where is the bolometric correction for band . The solar luminosities are calculated with synthetic photometry off the solar SED [52] through Bessell passbands, and the solar magnitudes are taken from Colina et al. [14]. They are shown in the 6th and 7th column in Table 5, respectively. We combine and in all rest-frame measurements since they match well to the same rest-frame passband. We calculate the bolometric correction for a filter as the ratio of the bolometric luminosity of the reference SED with its luminosity in , where the reference SED is defined by the model used (either solar model or BB15K/88Z model) and for the BB15K/88Z model also by its light-curve phase (see 8th column in Table 5 and 6th – 8th column in Table 6). Note that the bolometric luminosity depends strongly on the bolometric correction and thus on the filter . Since we have good light curves in rest frame and , we can get estimates of the bolometric luminosity from both light curves and then compare them. In addition, we add the luminosities in the rest frame and together (), and estimate the bolometric luminosity using a bolometric correction . Combining both filters decreases the systematic error since the overall corrections are smaller, as we discuss in Section IV.5.
For both the solar model and the BB15K/88Z model we estimate the amount of energy emitted in the rest frame , , and the combined passbands by integrating over time (see 10th and 9th column in Tables 5 and 6, respectively). The biggest source of systematic error is caused by the gap in the data in the rest frame (observed frame ) between , which contains the transition between plateau 1 and plateau 2 (see Figure 4). A simple linear interpolation over the gap may introduce a systematic overprediction of the flux. We estimate that this overestimate is smaller than 10%, and does not change our results. Note that the bolometric correction using the BB15K/88Z model is only pseudo-bolometric, since the SN 1988Z spectra used only have a finite wavelength range from about 4000 – 10,000 Å, not considering any contribution redward of the band or blueward of the band.
| Observed | Restframe | ||||||||
|---|---|---|---|---|---|---|---|---|---|
| Passband | (Å) | (mag) | Passband | (mag) | ( ergs s-1) | (mag) | ( ergs) | ( ergs) | |
| 4379 | 1.44 | 0.84 | 1.89 | 5.60 | 20.40 | ||||
| 5842 | 1.01 | 4.41 | 5.47 | 8.72 | 4.76 (0.12) | 41.47 (1.06) | |||
| 7898 | 0.66 | 6.48 | 4.46 | 5.93 | 4.48 (0.10) | 26.57 (0.60) | |||
| 7980 | 0.65 | ||||||||
| + | 3.53 | 9.24 (0.14) | 32.62 (0.49) |
Note. — Table of K-corrections and bolometric corrections for the solar model. For each of the passbands (first column), the effective wavelength , extinction , the passband that matches best in the restframe, the K-correction , the luminosity of the sun in , the absolute magnitude of the sun in , and the bolometric correction are shown in the 2nd-8th column, respectively. The K-correction and bolometric correction are calculated using the solar SED. We combine and in all restframe measurements since they match well to the same restframe passband. The 9th column shows the integrated energy in passband , and the 10th column the integrated bolometric energy derived from the passband photometry. The uncertainties quoted in and are the random uncertainties and don’t contain any of the systematic errors due to e.g. the interpolation of the lightcurves, K-correction, etc.
| Observed | Restframe | ||||||||
|---|---|---|---|---|---|---|---|---|---|
| Passband | Passband | Peak | Plateau 1 | Plateau 2 | Peak | Plateau 1 | Plateau 2 | ( ergs) | ( ergs) |
| 7.62 | 26.66 | 27.57 | 5.04 (0.12) | 124.96 (3.40) | |||||
| 12.22 | 3.88 | 6.15 | 3.69 (0.08) | 22.28 (0.49) | |||||
| + | 4.69 | 3.38 | 5.03 | 8.67 (0.13) | 40.15 (0.63) |
Note. — Table of K-corrections and bolometric corrections for the BB15K/88Z model. For each of the passbands (first column), the passband that matches best in the restframe (second column), the K-correction , and the bolometric correction are shown. For both the K-correction and bolometric correction, we use 3 different SED’s for the 3 different light curve phases peak, plateau 1, and plateau 2. For the peak, we use a 15,000 K blackbody SED. Since the lightcurve and color evolution of the first and second plateau is similar to that of SN 1988Z, we use a spectrum of SN 1988Z from 04/06/1989 as SED for plateau 1, and an average of SN 1988Z spectra from 04/18/1990, 02/20/91, and 02/04/92 for plateau 2. The K-correction for the peak, plateau 1 and plateau 2 is shown in 3rd, 4th, and 5th column, respectively. The bolometric correction for the peak, plateau 1 and plateau 2 is shown in the 6th, 7th, and 8th column, respectively. We combine and in all restframe measurements since they match well to the same restframe passband. The 9th column shows the integrated energy in passband , and the 10th column the integrated bolometric energy derived from the passband photometry. The uncertainties quoted in and are the random uncertainties and don’t contain any of the systematic errors due to e.g. the interpolation of the lightcurves, K-correction, etc.
IV.5. Energy Emitted
The upper left panel of Figure 14 shows the luminosities in the rest frame , and combined passbands using the solar SED for the determination of the K-correction. In the upper right panel, the same luminosities are shown, but using a 15,000 K blackbody SED for the K-correction during peak, and SEDs from SN 1988Z for the K-corrections during the plateau phase. The K-corrections for the two models are listed in Table 5 and 6. Note that the differences in K-corrections and thus luminosity are not bigger than 20%.
We estimate the total emitted energy in the different passbands by integrating over time (see solid lines in lower panels of Figure 14, and 10th and 9th column in Tables 5 and 6, respectively). For the solar model, the emitted energy in rest-frame band is ergs, with a similar amount emitted in the rest-frame band of ergs. This is more than ten times the energy emitted by SN 1988Z in the B band over roughly the same period of time ( 4.3 year) of ergs [3]. By adding the luminosities in the rest frame and together, and integrating over the light curve, we calculate the energy emitted in the combined rest frame and to be ergs (black line in lower left panel of Figure 14). When we use the BB15K/88Z model for the K-correction, we get energies in , , and of , , and ergs, respectively. These energies differ by only from the energies based on the solar model, and we thus estimate that our systematic errors are .

The bolometric luminosities and hence bolometric energies have a strong dependency on the SED used to calculate the bolometric corrections. The dashed lines in the lower panels of Figure 14 show the bolometric energies derived from the different passbands using the solar and BB15K/88Z model on the left and right, respectively. The bolometric energies based on the solar model agree reasonably well and range between and ergs. However, the bolometric energies derived using the BB15K/88Z model significantly differ, e.g., a factor of five between rest frame ( ergs) and ( ergs), even though this model is physically more motivated.
This large difference between the rest frame and derived bolometric energy is mainly driven by the bolometric correction based on the SN 1988Z spectra for the two plateau phases. The late-time spectra of SN 1988Z-like SN are dominated by the strong H emission line on the one hand, and the blue pseudo-continuum on the other hand. At late phases, this blue continuum is detected in most interacting SNe, e.g., SN 2006jc [28], and has been shown by Smith et al. [84] to be fluorescence of a forest of emission lines that can only be resolved if the lines are narrow enough, e.g., SN 2005ip. The main difference between the spectral shape of these late-time spectra of SNe IIn is the relative strength of the H emission line (rest frame ) compared to the blue pseudo-continuum (rest frame and bluer). The rest frame color of SN 1988Z is significantly redder than the one of SN 2003ma, indicating that for SN 2003ma the relative strength of the H line compared to the UV pseudo-continuum is weaker than for SN 1988Z. Thus using the spectra of SN 1988Z leads to a bolometric over-correction in the rest frame band and an under-correction in the rest frame band, which explains the large discrepancy between the two estimated bolometric luminosities. By combining rest frame and , this effect gets largely compensated, and the bolometric energy of ergs is comparable to the bolometric energy using the solar model of ergs. We thus estimate the bolometric radiated energy of SN 2003ma to be ergs, with the error dominated by the systematic error in the bolometric correction. This is significantly more than the total radiated energy of 2.3 – 2.5 ergs by SN 2006gy in 0.6 years [81], and ergs for SN 2008es in 0.4 years [64], and ten times the energy radiated by SN 1988Z over 8.5 years of ergs [3]. Analogous to SN 1988Z, the true bolometric luminosity of SN 2003ma is probably a factor of 10 higher if you include emission from the radio to X-rays that is produced from the interaction of the SN shock with the CSM, resulting in a total radiated energy budget of at least 1052 ergs.
Even though SN 2003ma is not quite as bright at peak as the most luminous SNe like SNe 2005ap, 2006gy, and 2008es, its total emitted energy is larger since half of the radiated energy is emitted after 350 days due to its very long decline (see the dotted lines in Figure 14 for ), at times when the other extremely luminous SNe do not produce any significant radiation. Such a large amount of radiated energy can be achieved if two things coincide: (1) the initial explosion has a large total (combined radiative and kinetic) energy and (2) most of the kinetic energy is converted into radiation by interaction with a CSM.
IV.6. Peak Luminosity
The peak luminosity of a SN II from thermal energy deposited into the ejecta following shock break out can be estimated to be
| (4) | ||||
| (5) |
where is the energy of the SN explosion, is the mass of the ejecta, is the initial radius of the star, is a numerical constant related to the radiative diffusion time, and is the opacity [4]. Thus, the most luminous core-collapse SNe will result from progenitors with large initial radii and low densities. Given the measured total energy emitted in the optical of ergs, and ergs s-1, this implies cm, a value approaching the radii of the largest known RSGs [55]. If the progenitor were an Eta Carinae-type massive star with , this would require a radius ten times larger, which is difficult to reconcile with stellar radii predicted by stellar evolutionary models.
If the peak of the light curve is powered solely by radioactive decay, we expect
| (6) |
For SN 2003ma, which had ergs s-1 at days after explosion in the SN rest-frame, the initial 56Ni mass is 4 , which is one to two orders of magnitude larger than typically produced in SNe IIP [41]. Although this amount of 56Ni could be produced in a pair-instability explosion [75], the slow rise to maximum and constant slope of decay after maximum in such models are incompatible with the light curve of SN 2003ma.
IV.7. Kinetic Energy
Measuring the kinetic energy from a SN typically requires an ejecta mass and a velocity for the ejecta. For SN 2003ma we were unable to measure the velocity of the ejecta from any of our spectra. However, we can estimate the energy converted from shock energy to kinetic energy by examining the velocity of the post-shock material. If we assume that the pre-shock circumstellar material has a coherent velocity, and a mass, , it has a kinetic energy,
| (7) |
If we assume that the post-shock material has a one-dimensional RMS velocity, , then the post-shock kinetic energy of the circumstellar material is
| (8) |
and the shock deposited an energy,
| (9) |
If we assume that the pre-shock circumstellar material has a constant density, , and that the shock traveled at a velocity of with no appreciable deceleration, then
| (10) |
is the mass of circumstellar material swept up by the shock in a time after explosion.
Combining Equations 9 and 10 and assuming that , we find
| (11) |
If we have a constant conversion of kinetic energy to luminosity, then , where is the efficiency factor. The density can then be written as
| (12) |
¿From Equations 10 and 12, we have the total swept-up mass,
| (13) |
which is independent of any assumed ejecta velocity. At the time of the last spectrum, when ergs s-1, km s-1, and years, SN 2003ma had swept up 0.6 of circumstellar material and had at least ergs of kinetic energy if . These values are lower limits since if , the swept-up mass and kinetic energy increases.
IV.8. Dust
The Spitzer photometry in IRAC bands 1 – 4 and MIPS band 1 (see Table 2) is shown in Figure 15 with respect to the rest wavelengths (2.8, 3.5, 4.5, 6.2, and 18.5 µm, respectively) corresponding to the observed wavelengths of 3.6, 4.5, 5.8, 8.0, and 24 µm, respectively. There is a significant difference between the first epoch (2005 July 15 – 26; 580 days after maximum) and the second epoch (2005 October 26 – November 2; 675 days after maximum) at restframe 3.5, 4.5, and 6.2 µm: the fluxes at 3.5 and 6.2 µm increase by 4 and 10, respectively, whereas the 4.5 µm flux decreases by 4. Note that we use the relative flux error for the comparison of fluxes at different epochs, but the same filter (4th column in Table 2), as we have discussed in Section II.2. For all comparisons of fluxes from different bands, we use the total errors (6th column in Table 2), which includes the wavelength dependent error introduced by the crowdedness of the field.
Such a significant change in flux over such a short time span makes it highly likely that at least some of the measured infrared flux is caused by the SN. Note, however, that the direction of these differences across the bands is not in the same direction in neighboring bands, and therefore SN 2003ma would not have been considered a variable candidate according to the criteria used by Vijh et al. [97] for the SAGE-LMC variables list. The observed 24 µm flux is essentially unchanged and is either an IR echo as observed for other SNe (e.g., SN 2002hh, Barlow et al. 8, Meikle et al. 60; SN 2004et, Kotak et al. 49) or from other sources in the host galaxy.
The changes in flux cannot be explained by a simple change in temperature and/or flux of a blackbody, but rather requires emission bands of molecules or dust. The first detection of carbon monoxide (CO) in a SN in the fundamental (4.6 µm) and first overtone (2.3 µm) bands was in the spectra of SN 1987A [12, 59, 67, 88]. In addition to CO, silicon monoxide (SiO) emission bands were detected in SN 1987A at 7.9 and 8.5 µm [74, 61, 57]. Subsequently, MIR CO lines were detected in SNe 1995ad [86], 1998S [34, 24], 1998dl [87], 1999em [87], 2000ew [36] and 2004et [49], which also showed SiO lines. The wavelengths of the CO and SiO emission bands are indicated in Figure 15. The match between the CO and SiO lines with the observed flux changes is poor, except for possible contribution of the CO fundamental band at 4.6 µm. However, we note that for both SNe 1987A and 2004et the CO and SiO bands appeared 100 days after maximum and disappeared by 500 days, significantly earlier than the increase seen in the second epoch for SN 2003ma.
Another possible explanation is that the strong and variable emission detected in the 8 µm IRAC band is from the 6.2 µm emission feature of polycyclic aromatic hydrocarbon (PAH) nanoparticles. Such emission is routinely detected in the Milky Way and other galaxies [33, 98, 44, 20, 79, e.g.,].

Here we present a dust model that could explain the observed IR emission. First, we assume that the bulk of the emission observed at 3.6 µm (rest frame 2.3 µm) is stellar continuum and we extrapolate this to longer wavelengths assuming a Rayleigh-Jeans spectrum (short-dashed line in Figure 15). To this we add emission from a mixture of PAHs, graphite, and silicate dust, from the dust models of Draine & Li [20]. For SN 2003ma we assume the radiation field heating the dust to have the spectrum of a 15,000 K blackbody, and have solved for the temperature distribution functions for different grain sizes and compositions, and different radiation intensities. The emission model has two components: steady emission from the “warm” dust in the galaxy, plus a time-varying IR echo from “hot” dust heated by radiation from the SN.
To reproduce the 24 µm photometry, the warm dust must be hot enough for the silicate 18 µm feature to emit strongly. This is accomplished by a radiation field with ( is the dust heating rate relative to heating by the starlight background in the solar neighborhood). This dust component is assumed to have the same ionization fraction as a function of grain size as assumed by DL07 for the Galaxy, and which has been found to work well for the IR-submm emission from, e.g., the galaxies in the SINGS sample [19]. The PAH abundance in the warm dust component must be low, , in order to not overproduce the observed flux in IRAC bands 2 and 4. This component has a dust mass of ; for a normal dust-to-gas ratio, this corresponds to a hydrogen mass of . This is a plausible amount of gas for hot photodissociation regions in a starburst galaxy. The spectrum of this emission is shown in Figure 15. The total IR luminosity of this dust component is . There is presumably additional emission from a much larger mass of cool dust in the galaxy, but we lack longer wavelength observations to constrain this component.
The dust producing the IR echo is assumed to be very strongly heated, with . The IR echo dust mass is on day 584, and on day 683. The total IR luminosity of this component on day 683 is , requiring that the IR echo dust be absorbing a substantial fraction of the SN light. This dust is assumed to have a PAH abundance , similar to the PAH abundance in many solar-metallicity star-forming galaxies. The PAHs are assumed to be ionized by the radiation from the SN; the PAH neutral fraction in this component is assumed to be negligible (the absence of neutral PAHs lowers the ratio of 3.3 µm emission relative to 7.7 and 8.6 µm emission, which is needed in order to not overproduce the emission into IRAC band 2). The intense radiation heats the large grains to K; the contribution of the broad 9.7 µm silicate feature is apparent in this component of the model spectrum. Even in this intense radiation field, the emission in the 3.3 and 6.2 µm PAH features continues to be due primarily to single-photon heating.
This two component model, with the mass of the hot dust increasing by a factor 3 between days 584 and 683, reproduces most of the IR photometry. There is admittedly a discrepancy with the observed flux density in IRAC band 3 ( µm): the observed flux decreases by a factor 3 between days 584 and 683, and our model does not reproduce this. Perhaps CO 1-0 4.6 µm emission (not included in our model) contributes to the high flux measured on day 584.
The dust heating parameter corresponds to an energy density . The distance of the dust from the SN is not known, but it is reasonable to assume a distance 600 light-days (0.50 pc). For this distance, the SN luminosity required to produce is – consistent with the photometry in Figure 14.
A sphere of radius 0.5 pc with density cm-3 contains of dust (assuming ). Densities cm-3 would be expected for cool gas in the high-pressure environment of a starburst galaxy. The IR echo requires of dust at a distance 0.5 pc from the SN to produce the IR echo. This dust could be located in an interstellar cloud, or possibly in a swept-up shell of interstellar matter surrounding a stellar-wind bubble.
To summarize: (1) PAH emission features can explain the increase in the observed 4.5 and 8 µm flux densities; (2) the required dust mass of should be 0.5 pc from the SN, which is reasonable; (3) the intensity of the SN radiation at this distance is consistent with what is required to heat the dust to reproduce the observed emission. We conclude that the observed IR photometry of LMC 902 is consistent with an IR echo produced by normal interstellar dust at a distance 0.5 pc from the SN. We note, however, that the data does not sufficiently constrain the model to make it unique, and other explanations are possible.
V. Conclusions
This paper presents photometry and spectroscopy of SN 2003ma, an exceptional SN IIn at a redshift of behind the Large Magellanic Cloud.
SN 2003ma has an -band light curve with two long plateaus, and strong emission in the and bands for 1000 days, reminiscent of the long-lived emission seen in interacting SNe IIn like the prototype of the class, SN 1988Z. However, in contrast to all other SNe IIn with long-lived plateaus, SN 2003ma also has an exceptionally bright peak luminosity of M mag, placing it in the class of extremely luminous core-collapse SNe, such as SNe 2005ap, 2006gy, 2008es, and 2008fz. The combination of high peak luminosity and long-lasting plateau makes SN 2003ma more luminous than any other SN at 80 days past maximum brightness. Consequently, half of the radiated energy is emitted after 350 days past maximum light, while other extremely luminous SNe produce no significant radiation at such late times.
The derived bolometric luminosity, and hence bolometric energy, has a strong dependency on the SED used to calculate the bolometric corrections. In order to estimate the systematic bias of the assumed SED, we use different SEDs to calculate the bolometric corrections. Integrating the bolometric light curve, we find that a total bolometric output of ergs was emitted over 4.7 years – more than twice the total radiated energy of SNe 2006gy or 2008es, and ten times the energy radiated by SN 1988Z, making SN 2003ma the most energetic SN ever observed with respect to its radiative output. This value alone is within an order of magnitude of the maximum energy that a core-collapse explosion can produce outside of the neutrino channel.
The nearly flat late-time light curve over the long time-span of several years in combination with the persistent single-peaked intermediate-width H emission line are best explained by the conversion of the kinetic energy of the explosion into radiation by strong interaction of the SN with a dense circumstellar material. SN 2003ma is distinct from proto-typical SNe IIn in that the intermediate width line is unusually broad, and it does not have a broad component. If SN 2003ma has narrow emission lines cannot be answered conclusively since it is difficult to separate the narrow emission lines from the SN, if they exist, from the narrow emission lines of the starbursting host.
The fast velocity measured for the intermediate-width H component ( 6000 km s-1) also points towards an extremely energetic explosion ( ergs) which imparts a faster blast-wave speed to the postshock material and a higher luminosity from the interaction than is observed in typical SNe IIn such as SN 1988Z. The large amount of radiated energy can only be achieved if the initial explosion has a large total radiative and kinetic energy and most of its kinetic energy is converted into radiation by interaction with a CSM. A conventional core-collapse SN explosion can produce at most a few times ergs of energy that can couple to baryonic matter. The measured kinetic energy of SN 2003ma is comparable to this limit (and similar to GRB-associated SNe), and therefore SN 2003ma may have been produced by an alternative explosion mechanism such as the pair-instability SN.
The Spitzer IR photometry shows significant variations in the IR from 584 days to 683 days after maximum in restframe 3.5, 4.5, and 6.2 µm. Such a significant change in flux over such a short time span makes it highly likely that at least some of the measured infrared flux is caused by the SN. The changes in flux cannot be explained by a simple change in temperature and/or flux of a blackbody, but rather requires emission bands of molecules or dust. We find that the observed increase in the IR flux density at 4.5 and 8.0 µm is consistent with an IR echo of the SN produced by normal interstellar dust at a distance 0.5 pc from the SN in combination with PAH emission features.
By any measure, SN 2003ma is a remarkable object. Its discovery and extensive lightcurve coverage were made possible by long-duration microlensing surveys. Its prompt identification and initial spectrocopy reveal the power of well-implemented reduction pipelines and planned, timely coordination of large telescope facilities. The inclusion of satellite data provided important constraints of the environment of this object. Ground-based facilities devoted entirely to deep, time-domain discovery such as the Large Synoptic Survey Telescope and PanSTARRS are almost certain to reveal many more such objects and lead us towards even greater understanding of the progenitors required to produce extremely luminous core-collapse supernovae like SN 2003ma and illuminate the full range of observational characteristics for what, for now, remains a small and elusive set of truly cataclysmic events.
Appendix A Classification of SN 2003ma
In this section we summarize why we classify SN 2003ma as a SN and not one of these other options.
A.1. Event in Milky Way or LMC
From Figure 2, we see that SN 2003ma is arcsec from a resolved source in our template images. In 2008, SN 2003ma was much fainter than this source; therefore, our 2008 spectrum is dominated by this source, a starburst galaxy at . If the event is in the LMC or Milky Way, then it must be either a transient or variable source with a quiescent brightness mag fainter than at peak. This excludes most flaring variable stars such as M dwarfs and Ae/Be stars since the amplitude of their flares are generally small compared to the total flux. Additionally, we would not expect a prolonged, year decline from peak.
Another candidate is a nova, which could flare by mag. However, our spectra from 2003 does not show any emission lines at or near zero redshift, which we would expect since the event is 0.5 magnitude brighter than the source at that time and therefore should dominate the spectrum. Furthermore, the light curve is unlike any nova yet observed.
Considering all this, it is unlikely that SN 2003ma occurred in either the LMC or Milky Way.
A.2. Supermassive Black Hole Event
AGN are often variable at various time-scales. Here we discuss if it is likely that SN 2003ma is an AGN.
- •
If SN 2003ma originates from a black hole in the supposed host galaxy then the supermassive black hole is offset by 500 pc from the center of the galaxy.
- •
We calculate the weighted average of 42 SuperMACHO difference image fluxes before the event (MJD ) spanning 2 years, and find that it is within of zero, with a reduced . None of the 42 detections deviates from zero by more than , and typical lower limits on variability are 24.2 magnitudes. If we split up these 42 detections into three blocks , , and , we find again that the average fluxes are consistent with zero with reduced of 1.01, 0.96, and 1.73, respectively. Therefore the pre-event variability in is fainter than 24.2 magnitude during this 2-year time period.
We perform a similar analysis with the band light curve and find that the pre-event OGLE-II () and OGLE-III () data is consistent with being constant with a reduced of 1.65 and 1.51, respectively. We -clipped 4% of the data. When we bin the data (see Section II.1 and bottom panel in Figure 3), we find that all average fluxes are within of zero, with reduced ranging from 0.67 to 1.91.
- •
Another test for the presence of AGN activity in the host galaxy are the ratios of the narrow emission lines, which are measured for all spectra and presented in Table 4. The [O III]/H and [N II]/H, and [S II]/H ratios in the standard diagnostic line ratios [5, 96] classify the host galaxy as a star-forming galaxy. Although the emission lines may have a contribution from the transient object, in the post-peak spectra from the [O III]/H, [N II]/H, and [S II]/H ratios are constant within the errors, which implies that at late times the narrow-line emission is dominated by the host galaxy.
- •
We consider the rare case in which an otherwise dormant supermassive black hole tidally disrupts a star, and emits a flare of radiation from the accretion of the stellar debris. This could explain that the event itself is about 0.5 magnitude brighter than the host and shows no variability pre-event. These events are typically bright in the X-rays [48, 23] and UV [40, 37, 39], however several candidates have emerged that have also been detected at optical wavelengths [37, 39]. The strong evolution of the foreground extinction-corrected colors of SN 2003ma from at peak to for times later than 1 year after the peak (see Section IV.3), however, are inconsistent with the steady blue colors expected for the blackbody spectral energy distributions and effective temperatures associated with tidal disruption events ( K; Gezari et al. 39).
The narrow-line ratios, listed in Table 4, are all consistent with a star-forming galaxy. This, in combination with the lack of variability in the densely sampled SuperMACHO and OGLE difference imaging data over a baseline of 7 years before the SN, place strong constraints on the presence of an AGN in the host galaxy.
A.3. Supernova
Since SN 2003ma is unlikely to be caused by a supermassive black hole or Galactic or LMC variable, the remaining likely transient phenomenon is that of a SN. Its blue continuum in 2003 (see Figures 5 and 10) and 6000 km s-1 FWHM emission lines consistent with H in 2004 and 2008 are reminiscent of a SN of type IIn [78]. This identification is also consistent with the host galaxy being a star-forming galaxy. In Sections III.1 and III.2, we compare the spectroscopy and photometry of SN 2003ma to other SNe from the literature, and we find that the most consistent explanation for this event is that it is a SN IIn.
References
- [1] Agnoletto, I., et al. 2009, ApJ, 691, 1348
- [2] Allington-Smith, J., et al. 1994, PASP, 106, 983
- [3] Aretxaga, I., Benetti, S., Terlevich, R. J., Fabian, A. C., Cappellaro, E., Turatto, M., & della Valle, M. 1999, MNRAS, 309, 343
- [4] Arnett, D. 1996, Supernovae and nucleosynthesis. an investigation of the history of matter, from the Big Bang to the present (Princeton University Press)
- [5] Baldwin, A., Phillips, M. M., & Terlevich, R. 1981, PASP, 93, 817
- [6] Barbon, R., Benetti, S., Rosino, L., Cappellaro, E., & Turatto, M. 1990, A&A, 237, 79
- [7] Barkat, Z., Rakavy, G., & Sack, N. 1967, Physical Review Letters, 18, 379
- [8] Barlow, M. J., et al. 2005, ApJ, 627, L113
- [9] Blondin, S., Prieto, J. L., Patat, F., Challis, P., Hicken, M., Kirshner, R. P., Matheson, T., & Modjaz, M. 2009, ApJ, 693, 207
- [10] Bond, J. R., Arnett, W. D., & Carr, B. J. 1984, ApJ, 280, 825
- [11] Cardelli, J. A., Clayton, G. C., & Mathis, J. S. 1989, ApJ, 345, 245
- [12] Catchpole, R., et al. 1987, IAU Circ., 4457, 1
- [13] Chevalier, R. A., & Fransson, C. 1994, ApJ, 420, 268
- [14] Colina, L., Bohlin, R. C., & Castelli, F. 1996, AJ, 112, 307
- [15] Dessart, L., et al. 2008, ApJ, 675, 644
- [16] Dessart, L., & Hillier, D. J. 2006, A&A, 447, 691
- [17] Dessart, L., Hillier, D. J., Gezari, S., Basa, S., & Matheson, T. 2009, MNRAS, 394, 21
- [18] Di Carlo, E., et al. 2002, ApJ, 573, 144
- [19] Draine, B. T., et al. 2007, ApJ, 663, 866
- [20] Draine, B. T., & Li, A. 2007, ApJ, 657, 810
- [21] Drake, A. J., et al. 2010, ApJ, 718, L127
- [22] Elmhamdi, A., et al. 2003, MNRAS, 338, 939
- [23] Esquej, P., Saxton, R. D., Freyberg, M. J., Read, A. M., Altieri, B., Sanchez-Portal, M., & Hasinger, G. 2007, A&A, 462, L49
- [24] Fassia, A., et al. 2001, MNRAS, 325, 907
- [25] Filippenko, A. V. 1982, PASP, 94, 715
- [26] Foley, R. J., et al. 2009, AJ, 138, 376
- [27] ——. 2003, PASP, 115, 1220
- [28] Foley, R. J., Smith, N., Ganeshalingam, M., Li, W., Chornock, R., & Filippenko, A. V. 2007, ApJ, 657, L105
- [29] Fox, O., et al. 2009, ApJ, 691, 650
- [30] Fransson, C., et al. 2002, ApJ, 572, 350
- [31] Gal-Yam, A., et al. 2009, Nature, 462, 624
- [32] Garg, A., et al. 2007, AJ, 133, 403
- [33] Genzel, R., & Cesarsky, C. J. 2000, ARA&A, 38, 761
- [34] Gerardy, C. L., Fesen, R. A., Höflich, P., & Wheeler, J. C. 2000, AJ, 119, 2968
- [35] Gerardy, C. L., et al. 2002a, ApJ, 575, 1007
- [36] Gerardy, C. L., Fesen, R. A., Nomoto, K., Maeda, K., Hoflich, P., & Wheeler, J. C. 2002b, PASJ, 54, 905
- [37] Gezari, S., et al. 2008, ApJ, 676, 944
- [38] ——. 2009a, ApJ, 690, 1313
- [39] ——. 2009b, ApJ, 698, 1367
- [40] ——. 2006, ApJ, 653, L25
- [41] Hamuy, M. 2003, ApJ, 582, 905
- [42] Hook, I. M., Jørgensen, I., Allington-Smith, J. R., Davies, R. L., Metcalfe, N., Murowinski, R. G., & Crampton, D. 2004, PASP, 116, 425
- [43] Horne, K. 1986, PASP, 98, 609
- [44] Irwin, J. A., & Madden, S. C. 2006, A&A, 445, 123
- [45] Iwamoto, K., et al. 1998, Nature, 395, 672
- [46] Kelson, D. D. 2003, PASP, 115, 688
- [47] Kennicutt, Jr., R. C. 1998, ARA&A, 36, 189
- [48] Komossa, S. 2002, in Lighthouses of the Universe: The Most Luminous Celestial Objects and Their Use for Cosmology, ed. M. Gilfanov, R. Sunyeav, & E. Churazov, 436–+
- [49] Kotak, R., et al. 2009, ApJ, 704, 306
- [50] Kozasa, T., Hasegawa, H., & Nomoto, K. 1989, ApJ, 344, 325
- [51] Kozłowski, S., et al. 2010, ApJ, 722, 1624
- [52] Lejeune, T., Cuisinier, F., & Buser, R. 1997, A&AS, 125, 229
- [53] Leonard, D. C., Filippenko, A. V., Barth, A. J., & Matheson, T. 2000, ApJ, 536, 239
- [54] Leonard, D. C., et al. 2002, PASP, 114, 35
- [55] Levesque, E. M., Massey, P., Olsen, K. A. G., Plez, B., Josselin, E., Maeder, A., & Meynet, G. 2005, ApJ, 628, 973
- [56] Li, W., et al. 2010, ArXiv e-prints, 1006.4612
- [57] Liu, W., & Dalgarno, A. 1994, ApJ, 428, 769
- [58] Marshall, J. L., et al. 2008, in Society of Photo-Optical Instrumentation Engineers (SPIE) Conference Series, Vol. 7014, Society of Photo-Optical Instrumentation Engineers (SPIE) Conference Series
- [59] McGregor, P. J., Hyland, A. R., & Beresford, A. C. 1987, IAU Circ., 4468, 2
- [60] Meikle, W. P. S., et al. 2006, ApJ, 649, 332
- [61] Meikle, W. P. S., Spyromilio, J., Allen, D. A., Varani, G.-F., & Cumming, R. J. 1993, MNRAS, 261, 535
- [62] Meixner, M., et al. 2006, AJ, 132, 2268
- [63] Miknaitis, G., et al. 2007, ApJ, 666
- [64] Miller, A. A., et al. 2009, ApJ, 690, 1303
- [65] Moseley, S. H., Dwek, E., Glaccum, W., Graham, J. R., & Loewenstein, R. F. 1989, Nature, 340, 697
- [66] Ofek, E. O., et al. 2007, ApJ, 659, L13
- [67] Oliva, E., Moorwood, A. F. M., & Danziger, I. J. 1987, IAU Circ., 4484, 1
- [68] Pastorello, A., et al. 2010, ArXiv e-prints, 1008.2674
- [69] Quimby, R. M., Aldering, G., Wheeler, J. C., Höflich, P., Akerlof, C. W., & Rykoff, E. S. 2007, ApJ, 668, L99
- [70] Quimby, R. M., et al. 2009, Nature, submitted (arXiv:0910.0059)
- [71] Rest, A., et al. 2005, ApJ, 634, 1103
- [72] Rho, J., et al. 2008, ApJ, 673, 271
- [73] Riess, A. G., et al. 2005, ApJ, 627, 579
- [74] Roche, P. F., Aitken, D. K., & Smith, C. H. 1991, MNRAS, 252, 39P
- [75] Scannapieco, E., Madau, P., Woosley, S., Heger, A., & Ferrara, A. 2005, ApJ, 633, 1031
- [76] Schechter, P. L., Mateo, M., & Saha, A. 1993, PASP, 105, 1342
- [77] Schlegel, D. J., Finkbeiner, D. P., & Davis, M. 1998, ApJ, 500, 525
- [78] Schlegel, E. M. 1990, MNRAS, 244, 269
- [79] Smith, J. D. T., et al. 2007a, ApJ, 656, 770
- [80] Smith, N., Chornock, R., Li, W., Ganeshalingam, M., Silverman, J. M., Foley, R. J., Filippenko, A. V., & Barth, A. J. 2008a, ApJ, 686, 467
- [81] Smith, N., Chornock, R., Silverman, J. M., Filippenko, A. V., & Foley, R. J. 2009a, ApJ, submitted (arXiv:0906.2200)
- [82] Smith, N., Foley, R. J., & Filippenko, A. V. 2008b, ApJ, 680, 568
- [83] Smith, N., et al. 2007b, ApJ, 666, 1116
- [84] ——. 2009b, ApJ, 695, 1334
- [85] Sollerman, J., Cumming, R. J., & Lundqvist, P. 1998, ApJ, 493, 933
- [86] Spyromilio, J., & Leibundgut, B. 1996, MNRAS, 283, L89
- [87] Spyromilio, J., Leibundgut, B., & Gilmozzi, R. 2001, A&A, 376, 188
- [88] Spyromilio, J., Meikle, W. P. S., Learner, R. C. M., & Allen, D. A. 1988, Nature, 334, 327
- [89] Stetson, P. B. 1987, PASP, 99, 191
- [90] Sugerman, B. E. K., et al. 2006, Science, 313, 196
- [91] Trundle, C., et al. 2009, A&A, 504, 945
- [92] Turatto, M., Cappellaro, E., Danziger, I. J., Benetti, S., Gouiffes, C., & della Valle, M. 1993, MNRAS, 262, 128
- [93] Udalski, A. 2003, Acta Astronomica, 53, 291
- [94] Udalski, A., Kubiak, M., & Szymanski, M. 1997, Acta Astronomica, 47, 319
- [95] Udalski, A., et al. 2008, Acta Astronomica, 58, 89
- [96] Veilleux, S., & Osterbrock, D. E. 1987, ApJS, 63, 295
- [97] Vijh, U. P., et al. 2009, AJ, 137, 3139
- [98] Vogler, A., Madden, S. C., Beck, R., Lundgren, A. A., Sauvage, M., Vigroux, L., & Ehle, M. 2005, A&A, 441, 491
- [99] Wade, R. A., & Horne, K. 1988, ApJ, 324, 411
- [100] Woosley, S., & Janka, T. 2005, Nature Physics, 1, 147
- [101] Woosley, S. E. 1993, ApJ, 405, 273
- [102] Woosley, S. E., Blinnikov, S., & Heger, A. 2007, Nature, 450, 390
- [103] Wozniak, P. R. 2000, Acta Astronomica, 50, 421