The Search for Celestial Positronium via the Recombination Spectrum
Abstract
Positronium is the short-lived atom consisting of a bound electron-positron pair. In the triplet state, when the spins of both particles are parallel, radiative recombination lines will be emitted prior to annihilation. The existence of celestial positronium is revealed through gamma-ray observations of its annihilation products. These observations however have intrinsically low angular resolution. In this paper we examine the prospects for detecting the positronium recombination spectrum. Such observations have the potential to reveal discrete sources of for the first time and will allow the acuity of optical telescopes and instrumentation to be applied to observations of high energy phenomena.
We review the theory of the positronium recombination spectrum and provide formulæ to calculate expected line strengths from the production rate and for different conditions in the interstellar medium. We estimate the positronium emission line strengths for several classes of Galactic and extragalactic sources. These are compared to current observational limits and to current and future sensitivities of optical and infrared instrumentation. We find that observations of the Ps line should soon be possible due to recent advances in near-infrared spectroscopy.
Keywords:
elementary particles – line: formation – line: identificationI INTRODUCTION
Positronium (Ps) is the short-lived atom consisting of a bound electron-positron pair. Its existence was predicted by Mohorovičić [52] shortly after the discovery of the positron by Anderson [1]. Furthermore, Mohorovičić [52] suggested that Ps should be observable by its recombination spectrum and discussed its properties. Ps was first observed by Deutsch [22] in a laboratory experiment designed to measure the lifetimes of positrons in gases.
Ps is unstable and annihilates into two or more photons with a combined energy of 1022 keV, i.e. the rest mass of the atom (see § II.2). However, as discussed in § II, under certain conditions Ps is stable for long enough that electronic transitions can occur between the quantum states of the system, giving rise to a recombination spectrum. Since the reduced mass of Ps is half that of H, the wavelengths are twice those of the corresponding H series. For example, Ps Lyman (Ps Ly) has a wavelength of 2431Å and Ps Balmer (Ps) has a wavelength of 1.313m.
Ps Ly was first observed in laboratory experiments by Canter et al. [13]. So far, however, no detections have been made of recombination lines from celestial Ps. Nevertheless the existence of celestial Ps is inferred from observations of the 511keV annihilation line and continuum annihilation radiation seen both from the Sun (Chupp et al. 18) and from the Galactic centre (Leventhal et al. 44), combined with the fact that in most astrophysical environments are expected to form Ps before annihilation (cf. § II). The successful observation of Ps recombination lines would not only be of interest in its own right, but would also have important consequences for many areas of astrophysics. We now describe the motivation behind a search for Ps recombination lines.
Current knowledge of naturally occurring antimatter from astrophysical sources is limited to the poor spatial resolution () of -ray satellites. The formation of Ps, however, provides a natural heterodyne process that converts the -ray energies associated with the production of - pairs, to the optical/ near-infrared energies of Ps recombination. Thus observation of Ps recombination lines would allow the superior spatial and spectral resolution of optical/ near-infrared technologies to be applied to high energy astrophysical phenomena.
As a specific example, Ps observations could provide an important physical understanding of jets. It is still uncertain whether high energy radio jets consist of an -p plasma or - or some combination of both. Most attempts to answer this question have had to rely on indirect methods of searching for the presence of , such as arguments based on the total energy budget of the jets (e.g. Celotti & Fabian 16; Reynolds et al. 58; Wardle et al. 72; Hirotani 39), with inconclusive results. Direct searches for the 511keV annihilation signature in jets (Marscher et al. 48) have likewise failed to provide conclusive results due to the poor point source sensitivity of -ray telescopes. If the positrons from the jet thermalise when the jet impacts the surrounding medium allowing the formation of Ps, and if the acuity of optical observations can be brought to bear on this problem to allow a successful detection of Ps recombination lines, this would have significant implications for our understanding of the physical processes responsible for the production of jets – processes which take place deep within the AGN (Blandford & Levinson 9).
The origin of the positrons responsible for the annihilation radiation observed from the Galactic centre is uncertain. The current state-of-the-art observations are from the ESA’s INTEGRAL -ray observatory, which has detected extended Ps annihilation radiation centred on the Galactic centre with a FWHM of (Knödlseder et al. 42; Weidenspointner et al. 73). The results are most consistent with a source of originating from old stellar populations such as type Ia supernovæ, classical novæ, and low mass X-ray binaries, although more exotic sources, such as dark matter annihilation, cannot be ruled out. The angular resolution of INTEGRAL SPI is , and is therefore rather insensitive to the detection of point sources. The detection of Ps recombination lines would allow discrete point sources of to be searched for on sub-arcsecond scales (see § III) allowing direct confirmation of the production of specific sources for the first time.
Despite the benefits of detecting Ps recombination lines there have been very few attempts to do so, and there has been little work on the expected astrophysical signatures. McClintock [49] reviews the possibility of the optical detection of Ps, in particular the Ps Ly line. The conclusion reached is that a visual extinction of 1 or 2 magnitudes is enough to make the Balmer and Paschen lines more intense than the intrinsically more luminous Lyman lines. Since most previous studies have focussed on the Galactic centre as the most promising source of Ps recombination line emission (so far the only source other than the Sun in which Ps annihilation has been observed) and that at the Galactic centre the visual extinction is very high, it is not surprising that this idea has remained largely forgotten. Burdyuzha & Kauts [11] raised the possibility of optical/ IR detection of Ps again, and made predictions of the expected fluxes of the most important lines. However, the only published attempt to detect Ps recombination lines was made by Puxley & Skinner [57] who searched for Ps Paschen- from the Galactic centre in the band, and whose non-detection provides the only direct experimental constraints on the emission.
Until recently, the prospect of a near-infrared (NIR) detection of the Balmer series of Ps was rather bleak due to the relative insensitivity of NIR detectors and the strong foreground emission from the atmosphere. However, we argue that the time is now right for a reappraisal of this important window into the high energy universe. This renewed interest is motivated by several recent and imminent advances in technology. NIR detectors have improved remarkably and are now capable of dark currents as low as 1 per 1000 s, and read noises of (Smith et al. 63). Adaptive optics at NIR wavelengths can now deliver high Strehl ratios improving the signal to noise for faint sources. The future generation of ELTs will deliver AO corrected images of fields of view of tens of arcminutes with huge gains in sensitivity from the vast collecting areas. The JWST will provide unprecedented sensitivity at NIR wavelengths (Gardner et al. 30). Recent breakthroughs in photonic technologies promise superb background suppression in the NIR in the near future (Bland-Hawthorn et al. 8; Ellis & Bland-Hawthorn 27).
The purpose of this paper is to assess the probability of detecting Ps recombination spectra in light of these advances and to identify the most fruitful strategies and targets for an observational campaign. We collect together sources from a broad literature published over many decades and combine these to calculate the expected astrophysical signatures of Ps. The next section reviews the pertinent physical properties of Ps. We then discuss possible sources of Ps recombination line emission, both Galactic and extragalactic, including predictions on the strengths of these sources. Section IV then assesses the prospects of detection and observational strategies. Finally we summarise our findings in section V.
II PHYSICS OF THE POSITRONIUM RECOMBINATION SPECTRUM
II.1 Formation of Ps
The fate of positrons in astrophysical environments depends on their energy and the ionisation fraction of the surrounding medium. Positrons are formed in highly energetic processes ( keV as part of an - pair), and initially may be highly relativistic. In order that Ps may be formed the must first lose energy. We consider two stages in the formation of Ps, the in-flight phase during which the positrons are losing energy, and the thermalised phase, during which the are in thermal equilibrium with the surrounding medium.
II.1.1 In-flight phase
Positrons can lose energy via collisions with electrons or by excitation and ionisation of atoms and molecules. During this energy loss phase, once the has an energy of less than a few tens of eV, Ps can be formed via charge transfer with H, H2 or He. Guessoum et al. [33] and Bussard et al. [12] show that the fraction of forming Ps in flight is a strong function of the ionisation fraction of the medium. In a completely neutral medium consisting of atomic H, approximately 95 per cent of form Ps (via charge exchange). If the same medium were 50 per cent ionised, less than 10 per cent of would form Ps (Guessoum et al. 33). If the medium is collisionally ionised, then the ionisation fraction depends on the temperature and density of the gas. However, McClintock [49] notes that in most cases of generation from an astrophysical source (e.g. supernovæ, microquasars, etc.), a radiative source capable of photoionising the surrounding medium will be involved. In this case the ionisation fraction of the medium close to the source is of order unity and independent of gas temperature. Consequently, almost all will survive the in-flight phase and will eventually thermalise with the surrounding medium.
II.1.2 Thermalised phase
Once thermalised, may form Ps via radiative recombination or via charge exchange. The relative efficiencies of these processes are highly dependent on temperature (Bussard et al. 12; McClintock 49; Guessoum et al. 33). For a collisionally ionised gas, Ps formation by radiative recombination with free electrons dominates charge exchange at K (Guessoum et al. 33). However, for a photoionised gas radiative recombination is dominant at all temperatures K (McClintock 49).
It is possible for to annihilate directly with either free or bound without first forming Ps. Direct annihilation with free has a cross section that is an order of magnitude lower than radiative recombination for K (Guessoum et al. 33). Direct annihilation with bound can only take place at low temperatures ( K; Guessoum et al. 33). Therefore for most astrophysical environments (– K) Ps formation will be the dominant process leading to annihilation.
II.1.3 Formation in dust grains
Ps can form when a is captured by a dust grain. Dust grains have a much larger cross-section than the competing effects of recombination or charge-exchange and hence can play a significant role in the formation of Ps. The effects of Ps formation in dust was first discussed by Zurek [80] and the most recent treatment is given by Guessoum et al. [33]. We summarise the relevant findings here.
Guessoum et al. [33] give four possible reactions between and dust grains, re-emission, backscattering, Ps formation in the grain, Ps ejection. Ps formed in the grain always annihilates via para-Ps (see § II.2) since ortho-Ps will quickly convert to para-Ps via “electron pick-off” of the surrounding electrons in the dust grain. Ejected Ps will annihilate in the usual 3:1 ratio of ortho:para-Ps (see § II.2). Thus only the ejected Ps will contribute to any optical/NIR emission.
The significance of annihilation via Ps formation in dust grains is dependent on the temperature of the ISM. Guessoum et al. [33] find that the role of dust is insignificant at low ISM temperatures, since in this case dust grains are thought to be positively charged, which reduces the chance of capture. In the warm ionised (K) and hot (K) phases of the ISM dust is thought to be negatively charged and capture can become significant. The reaction rate for radiative recombination, direct annihilation and capture by dust grains are given by Guessoum et al. [33] as , and cm3 s-1 respectively for the warm ionised medium, and , and cm3 s-1 for the hot medium. Thus in the warm phases recombination is dominant but in the hot phases dust process are the dominant form of Ps formation.
We also wish to know the relative rates of the reactions that will generate recombination lines, and this requires annihilation via ortho-Ps (§ II.2). Guessoum et al. [33] estimate that about per cent of Ps formed in dust will be ejected before annihilation. Taking this factor and the 3:1 ortho:para ratio into account gives reaction rates in the hot phase of the ISM of and cm3 s-1 for the formation of ortho-Ps via radiative recombination and dust capture respectively.
II.2 Lifetime and Annihilation of Ps
Ps is unstable and will eventually annihilate. The process of annihilation is governed by the principle of invariance under charge conjugation (Yang 79; Wolfenstein & Ravenhall 78; Berko & Pendleton 5) and the mechansim depends on the total spin of the atom (see e.g. Debenedetti & Corben 21). Para-Ps annihilates into an even number of photons, with the most likely decay into two photons, whereas ortho-Ps annihilates into an odd number of photons with the most likely decay being into three photons. Furthermore conservation of energy and momentum requires that para-Ps decays into two photons of equal energy, giving rise to the 511keV emission line, whereas the energies of the three ortho-Ps annihilation photons can be any three energies that add to 1022keV, giving rise to a continuum of -ray photons keV. The different decay mechanisms give rise to different lifetimes for para- and ortho-Ps. Para-Ps in the ground state has a lifetime of s and ortho-Ps a lifetime of s (e.g. Berko & Pendleton 5). The lifetimes of excited states are longer by a factor (Wheeler 76). Since para-Ps is a singlet state and ortho-Ps is a triplet state the relative weights of ortho-Ps to para-Ps are 3:1.
II.3 Ps Recombination Spectrum
Ps has a reduced mass of , so the energy levels of Ps are almost exactly half those of hydrogen, which has a reduced mass . Correspondingly, the wavelengths of the recombination spectrum are twice those of hydrogen. This has been confirmed through laboratory observations of the Ps Ly line at 2431Å by Canter et al. [13].
Similarly, the radiative lifetimes are twice those of hydrogen. We have calculated the radiative lifetimes of Ps using the atomic hydrogen transition probabilities listed by Wiese et al. [77]. We use the ‘average’ values tables which are most applicable to astrophysical situations if it is assumed that all atomic sub-states are occupied according their statistical weights. In Table 1 we show the radiative and annihilation lifetimes for states –6 and (the annihilation lifetimes are almost entirely independent of ), and the ratios of these quantities. The ratio of annihilation lifetime to radiative lifetime () gives the approximate number of photons that could be emitted from that state before decay. For triplet Ps all states could emit more than one photon (significantly more for the lower energy states) before decay. Thus most triplet Ps annihilates from its ground state. Singlet Ps would decay before any radiation is emitted. We note however that in most cases Ps will form via case-A recombination and therefore after radiative recombination down to the level (perhaps via multiple transitions), we do not expect any re-excitation followed by further re-radiation, since this would require the presence of other Ps atoms nearby, which is unlikely in most cases. We also note that the probability of spin-flip before radiative transition is very small11 1 see Burdyuzha, Durouchoux & Kauts 1999, http://jp.arxiv.org/abs/astro-ph/9912550; the Einstein coefficient for spontaneous spin-flip, s-1. Collisionally induced spin-flip is highly unlikely as the lifetime of Ps is so short (§ II.2), and would require densities of particles in the ISM far in excess of those observed. Therefore we do not expect any spin-flip to occur before annihilation.
| Singlet Ps | Triplet Ps | ||||
|---|---|---|---|---|---|
| Radiative lifetime | Annihilation lifetime | Ratio | Annihilation lifetime | Ratio | |
| /s | /s | /s | |||
| 1 | – | – | – | ||
| 2 | 0.23 | 265 | |||
| 3 | 0.041 | 46.9 | |||
| 4 | 0.013 | 14.6 | |||
| 5 | 0.0053 | 6.03 | |||
| 6 | 0.0026 | 2.93 | |||
Wallyn et al. [70] calculate line widths and intensities for the radiative recombination spectrum of Ps in the limit of thermal positrons and low densities, including annihilation from excited states. The lines strengths are assumed to be dominated by electron-positron radiative recombination for free electrons, with a small fraction of Ly- emission resulting from electron capture through interaction of a positron with H or He.
For a given source producing positrons per second, the flux of Ps radiative emission in photons s-1 m-2 m-1 would be,
| (1) |
where is the fraction of which form Ps after thermalisation, the factor 3/4 is the fraction of Ps in the triplet state, is the number of emitted Ps Ly photons for each Ps atom, is the ratio of the intensity of Ps Ly to the line in question, is the luminosity distance of the source, the factor accounts for an absorption coefficient of , and is the line width in microns.
We note an important point: -ray observations of the 511keV line are observing the annihilation of para-Ps, whereas observations of the radiative recombination spectrum are observing ortho-Ps. Since the relative weights of para-Ps to ortho-Ps are 1:3 (singlet vs. triplet states), but there are 2511keV photons for each annihilation, but only one radiative recombination photon, the recombination line flux () can be related to the -ray line flux ( photons s-1 m-2) by,
| (2) |
The line width is given by Wallyn et al. [70] as
| (3) |
which is somewhat narrower than the assumption of purely thermally broadened Ps emission, and results from Monte-Carlo simulations of the combination process by Guessoum et al. [35] which show that the electron-positron system is not in exact thermal equilibrium with the gas.
Wallyn et al. [70] tabulate values of , and for different temperatures, which we include here for convenience in Table 2 along with the line widths of Ps Ly and Ps calculated from equation 3. The positronium fraction, , is calculated from the reaction rates for radiative recombination, charge exchange with H and He and direct annihilation given by Wallyn et al. [70]. The fraction of Ps which undergoes a Ly transition, , is given by Wallyn et al. [70] in their table 5. The ratio of the intensity of Ps Ly to Ps, , is derived from the absolute intensities of the transitions listed in table 6 of Wallyn et al. [70]. Note that there are two values of given, one for a neutral medium which includes Ps formation via charge exchange, and one for an ionised medium in which Ps only forms by radiative recombination.
| K | ionised | neutral | (Ps Ly)/ Å | (Ps)/ Å | ||
|---|---|---|---|---|---|---|
| 0.41 | 0.41 | 0.45 | 1.816 | 0.69 | 3.72 | |
| 0.87 | 0.88 | 0.37 | 2.192 | 1.40 | 7.55 | |
| 0.86 | 0.99 | 0.32 | 2.391 | 1.90 | 10.234 | |
| 0.84 | 1.0 | 0.28 | 2.586 | 2.57 | 13.89 | |
| 0.75 | - | 0.18 | 2.731 | 5.22 | 28.20 | |
| 0.41 | - | 0.09 | 2.242 | 14.38 | 77.67 |
For Ps Ly and Ps we assume and respectively (Rieke & Lebofsky 59).
III SOURCES OF POSITRONIUM
We now consider the expected Ps recombination line emission from various astrophysical sources. We discuss both Galactic and extragalactic sources and calculate fluxes for Ps Ly and Ps using the formulæ given in section II.3. We quote our results in terms of line flux densities, i.e. the total line strength divided by the line width. This allows for a more meaningful comparison to the source continuum spectrum and the atmospheric background, both of which are found to dominate the Ps emission line fluxes.
III.1 Galactic sources
So far the only detections of Ps outside laboratory experiments are from the Sun (first observed by Chupp et al. 18) and the Galactic centre (first identified by Leventhal et al. 44). All detections have been via annihilation radiation; no detection of the optical or NIR recombination lines exists.
Since the early pioneering detections of 511keV radiation much progress has been made, with significant increases in precision and sensitivity (see for example Murphy et al. 53 for recent observations of 511keV emission from the Sun). For the the Galactic emission the current state-of-the-art observations are from the ESA’s INTEGRAL -ray observatory, which has detected extended Ps 511keV line emission and continuum emission centred on the Galactic centre (Weidenspointner et al. 73). Broadly, the distribution of 511keV radiation toward the Galactic centre is extended with a FWHM of degrees (Knödlseder et al. 42) and the continuum emission is consistent with this (Weidenspointner et al. 74). More detailed analyses reveal a bulge and a disc component to the annihilation radiation (see Weidenspointner et al. 73 for a summary). However, the angular resolution of INTEGRAL SPI is degrees, and is therefore insensitive to the detection of point sources. The results are most consistent with a source of positrons originating from old stellar populations such as type Ia supernovæ, classical novæ, and low mass X-ray binaries, although more exotic sources cannot be ruled out. It is suggested that the reason for the diffuse nature of the annihilation radiation is that e+ are long lived, and the reaction rates with the ISM are small (Guessoum et al. 33) and positrons can diffuse long distances from their sources before thermalisation (Jean et al. 40, Gillard et al. 32). Thus e+ have a large mean free path before interaction and annihilation. Even allowing for the longevity of in the interstellar medium, and the resulting diffuse nature of Ps annihilation radiation, it is likely that some fraction of the Ps annihilation radiation results from discrete sources. (i) It is expected that individual energetic sources will emit and therefore these should be brighter than any diffuse background. (ii) The Sun is known to emit Ps 511keV radiation, and therefore more energetic sources of will also likely emit Ps 511keV radiation. (iii) There is a correlation between an asymmetry in the 511keV radiation originating from the inner Galactic disc and the distribution of -ray selected LMXBs (Weidenspointner et al. 75). (iv) The ISM is very inhomogeneous; the range of densities ranges from approximately electrons m-3 in the hot diffuse gas (K) to atoms m-3 in cold gas (K), and even higher in molecular clouds. Similarly the sizes of these regions vary significantly, from pc to pc, and we anticipate that some clumps will be more favourable for Ps formation, and therefore more luminous, than others. (v) The history of both the X-ray and the IR background cautions us to suspect that a large number of faint point sources may masquerade as a diffuse background (Shanks et al. 62, Hauser & Dwek 36).
Knödlseder et al. [42] have searched for point sources within the INTEGRAL data. They find that 8 individual point sources could describe the emission seen in the Galactic bulge, with a combined flux of photons s-1 m-2 , or roughly photons s-1 m-2 per source. In addition to this blind survey, Knödlseder et al. [42] also examine candidate sources including Sgr A*, microquasars, LMXBs, pulsars, SNRs, galaxies and AGN. No point sources are detected down to typical limits of – photons s-1 m-2. The upper limit for Sgr A* is 1 photons s-1 m-2. These results suggest that if point sources are responsible for the observed diffuse emission they are likely to be more than 8 and fainter than photons s-1 m-2. Assuming all sources to be of equal strength we therefore empirically relate the 511keV flux of individual point sources to the total number of sources, , by,
| (4) |
Combining equation 4 with equations 2 and 3 and using the parameters listed in Table 2 we can calculate the line flux per source as a function of the number of sources. This is plotted in Figure 1 for both Ps Ly and Ps for a range of temperatures. It was assumed that the extinction towards the Galactic centre was mag, although we note that there are several windows of low extinction (Dutra et al. 25), such as Baade’s window, which may be used to obtain deeper observations of the Galactic centre. It is clear that Ps emission is much brighter than Ps Ly despite the fact that Ps Ly is intrinsically brighter. For a temperature of K the flux density is higher for Ps for any visual extinction mag, for the total integrated line strength Ps is brighter for mag.


We defer an assessment of the feasibility of observing such sources to section IV, but we note as a guide sources that with flux densities ph s-1 m-2 m-1 may be considered bright, whereas those with ph s-1 m-2 m-1 may be considered faint, c.f § IV.2. First we discuss individual types of sources and make estimates of their likely Ps recombination line emission. Guessoum et al. [33] list the following processes for the production of a) decay of radioactive nuclei; b) decay into , which decays and gives off a positron; c) pair (electron-positron) production through photon-photon interactions; d) pair production by the interaction of an electron with a strong magnetic field. All these processes are thought to occur naturally in the Universe. In the Galaxy, the main sources of are thought to be supernovæ, novæ, microquasars and pulsars, cosmic rays and -ray bursts, in that order (Guessoum et al. 33). To this list we add the decay of 26Al, which is produced via nucleosynthesis in core-collapse supernovæ, novæ, asymptotic giant branch stars and massive stars (Knödlseder et al. 41), and is expected to make a significant contribution to the content of the Galactic disc (Knödlseder et al. 42). We also add decaying super-symmetric dark matter particles (Boehm et al. 10; Beacom et al. 3). We discuss each of these in turn below, except for cosmic rays and dark matter decays. Both these processes are intrinsically diffuse, and thus while possibly significant in terms of the Galactic positron budget they are unlikely candidates for Ps emission line observations.
Most of the sources listed above inject into the ISM, where they thermalise before forming Ps and annihilating. Once in the ISM the will diffuse along magnetic field lines. The diffusion depends primarily on the conditions in the ISM (assuming a restricted energy range for the injected MeV) and not on the source of , thus the average distance over which the will be essentially identical for all injecting sources. We therefore preface our discussion of the individual sources with a discussion of the diffusion of in the ISM.
III.1.1 Diffusion of in the interstellar medium
Before annihilation, diffuse through the ISM along magnetic field lines. Jean et al. [40] have calculated the propagation distances of in the ISM based on the cross-sections of Guessoum et al. [33]. They consider three regimes of propagation, a quasi-linear regime in which are transported in resonance with Alfvén waves, a collisional in-flight phase in which the are losing energy and a collisional thermalised phase. Combining the propagation modes with the Ps formation and annihilation cross sections they calculate a maximum distance, , over which the can propagate before annihilation. It is found that in the warm phases of the ISM (8000 K) do not propagate more than pc in a typical annihilation time of yrs. Even those which survive longer than the typical annihilation time do not propagate much further since the diffusion constant in the collisional regime is very small ( for a warm ionised ISM). Thus except in hot phases ( K), escaping remain local to the source and we call this associated volume .
III.1.2 Supernovæ
Supernovæ (SNe) are thought to be a major, and possibly dominant, contributor to the origin of the Galactic (Milne et al. 50). SNe Ia produce from radioactive decay of , with a smaller contribution from , and still a lesser contribution from (Chan & Lingenfelter 17). The contribution from SNII is thought to be fewer by about an order of magnitude (Milne et al. 50) and here we only consider SNIa.
Milne et al. [51] find the average positron yield from SNe Ia is (see their table 4). Of these, after 2000 days, approximately 2–6 per cent escape the supernova, whilst less than 1 per cent of the trapped survive. We assume that all other annihilate. Thus we may consider the Ps recombination line emission from SNe Ia in two components: the initial emission from the Ps formed in the supernova explosion, and the emission from the Ps formed from the escaping . In the following we assume an escape fraction of 5 per cent.
We assume that 95 per cent of annihilate in the first 2000 days after a type Ia SN explosion. If we conservatively assume that this takes place evenly across the 2000 days we have a source rate of s-1. We make the further simplifying assumption that all which annihilate in the ejecta thermalise before doing so, and we assume that the temperature of the ejecta is K. Thus using equation 1 and the appropriate value from Table 2 we can calculate the line flux density. The results are shown in Figure 2 for both Ps and Ps Ly, as a function of distance from Galactic SNe to the distance of the Virgo cluster assuming a high visual extinction of mag, such as would be appropriate for the Galactic centre. The feasibility of detection is deferred until section IV.

We now consider the fate of the which survive and escape the ejecta. We assume these are thermalised in the interstellar medium, and consist of 5 per cent of original SN yield. Milne et al. [51] show that the typical energy of an escaped is keV. The lifetime of in the ISM is determined by the energy of the , the density of the ISM, and the cross-sections for the processes of radiative, recombination, charge-exchange and direct annihilation, etc. These cross-sections have been calculated by Guessoum et al. [33] for various phases of the ISM: molecular (10 K), cold (80 K), warm neutral (8000 K), warm ionised (8000 K), hot ( K).
Knödlseder et al. [42] discuss the SNIa rate and distribution in the Galaxy. Although the exact numbers are not known, estimates based on the 511keV line flux (Knödlseder et al. 42) and from extragalactic SNe rates (Tammann et al. 67; Cappellaro et al. 14; Mannucci et al. 45) suggest that there are 0.3–1.1 SNIa per century in the bulge, although Prantzos [56] predict a much lower value of SNIa per century based on extrapolations from SNIa rates in early type galaxies. We assume a value of 0.5 SNIa per century in the bulge or a timescale of yr. Thus in a volume (see § III.1.1), there would be a typical timescale between SNe of . For typical values in the bulge of yr and pc at K (Jean et al. 40), therefore we may consider each SN event individually since the probability of multiple SNe in the same volume within a few -folding timescales is very small.
The number of in a volume following a SN is governed by the differential equation
| (5) |
hence,
| (6) |
where is the time since the SNe and is the initial number of surviving per SN, and the annihilation timescales, are given by Jean et al. [40]. Since we are interested in the formation of Ps we need to distinguish between the timescale for annihilation by any means, , which includes Ps formation and direct annihilation, and the timescale for Ps formation alone22 2 This is the timescale for annihilation of free in the ISM, and includes the timescale for the formation of Ps. This should not be confused with the timescale for Ps annihilation, . The former will govern the depletion of Ps in the ISM, and the latter will govern the formation rate of Ps. So the number of Ps formed as a function of time is therefore
| (7) |
where as before is the fraction of which form Ps. Thus the Ps formation rate is
| (8) |
This expression can be substituted for in equation 1 to give the total line flux for originating from SNIa.
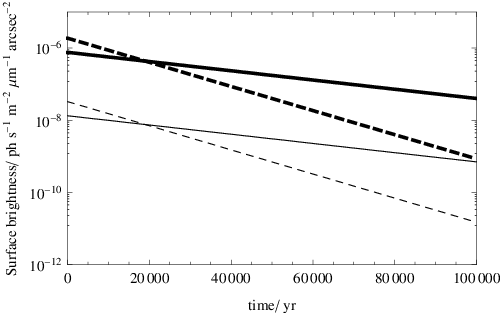
Using values of and from Jean et al. [40] (for 1Mev ), values of from Guessoum et al. [33], and from Wallyn et al. [70] (and assuming the 8000K values from Jean et al. 40 are appropriate for the K values of Wallyn et al. 70), we have calculated the surface brightness of Ps Ly and Ps from SNIa as a function of time for both a neutral and ionised ISM at K. We assume the SN is located at the Galactic centre with a distance 8kpc and mag. The results are shown in Figure 3, and are exceedingly faint — orders of magnitude below the detection limit for any planned space or ground based mission.
These fluxes correspond to a total annihilation rate over the entire bulge of s-1, assuming one SN every 200 yrs, which is in good agreement with the values Milne et al. [50] of s-1 for the entire Galaxy with bulge/disc ratios of 0.2–3.3. This annihilation rate corresponds to a total flux of 511 keV photons of photons s-1 m-2, which is in order of magnitude agreement with the value of 11.2 photons s-1 m-2 reported by Knödlseder et al. [42].
III.1.3 Novæ
Novæ are potentially significant sources of positrons. Novæ are caused by a runaway thermonuclear reaction due to the accretion of hydrogen rich material onto the surface of a white dwarf. Positrons are expected to be produced by decay of radioactive nuclei produced during the runaway, and carried to the surface of the nova by rapid convection (Clayton & Hoyle 19). Detailed calculations of the expected annihilation signatures were first calculated by Leising & Clayton [43]. These show an early peak in emission due to decay from 13N followed by decay from 18F, with lesser contributions from 15O, 14O and 34mCl. This early peak lasts days, but may be followed by longer duration, but fainter, emission from 22Na. This is particularly relevant for ONe novæ which have a larger abundance of Na than CO novæ. The longer duration emission is pertinent since the bright early peak occurs before the maximum in visual luminosity, i.e. before discovery (Hernanz et al. 37).
Hernanz et al. [38] provide updated light curves of the expected 511 keV radiation from both CO and ONe novæ. We use their table 2 of the fluxes at various epochs along with equation 2 to calculate the expected Ps Ly and Ps line strengths. Leising & Clayton [43] assume that the thermalise before forming Ps, and have a temperature of K, such that Ps formation dominates over direct annihilation. Following this prescription we assume a temperature of K and an ionised medium and use the appropriate values from Table 2. Novæ are thought to reside mainly in the bulge of the Galaxy, therefore we assume a distance of 8kpc and a conservative extinction of mag. Figure 4 shows the resulting Ps and Ps Ly fluxes for the CO and ONe novæ. The flatter light curve of the ONe novæ is due to the higher abundance of 22Na. We defer a discussion of the feasibility of detection to § IV.

III.1.4 Low mass X-ray binaries and microquasars
Microquasars are a promising source of in the Galaxy (Guessoum et al. 34). The accretion disc of a low mass X-ray binary will produce - pairs, which in a microquasar are ejected into the ISM via a relativistic jet in a manner analogous to AGN (see § III.2.1), though not as powerful. Guessoum et al. [34] have examined the expected contribution from microquasars in accounting for the Galactic Ps annihilation radiation, and have also examined misaligned microquasars, in which the jet impinges on the secondary star as a promising Ps point source. Binary systems with colliding winds, or jet-wind interactions, can also be highly energetic sources capable of producing MeV -rays (Tavani et al. 68), which are also potentially promising point sources of .
There is good evidence that even those LMXBs which do not produce a jet are an important source of in the Galaxy; there is an asymmetric distribution of 511keV radiation from the inner Galactic disc, which coincides with the asymmetric distribution of LMXBs (Weidenspointner et al. 75). For LMXBs without a jet, the can escape in a stellar wind. Since the origin of the is the same as for microquasars, and since the annihilation timescale is long compared to the diffusion timescale, the diffuse annihilation radiation is expected to be identical for LMXBs and microquasars. However, as discussed below microquasars have the important distinction that in some cases the jet can collide with the secondary star, producing a point source of emission.
From consideration of energetics, and from an empirical analysis of the INTEGRAL SPI data, Guessoum et al. [34] calculate a typical flux of s-1 from a microquasar. The annihilation in the jet is expected to be small (see the discussion for AGN in § III.2.1), and once the jet collides with a gas cloud, thermalisation will take place very quickly (§ III.2.1). Thereafter the will diffuse along the magnetic field of the ISM as described in § III.1.1, and will eventually annihilate as described in § II.3. Thus the Ps recombination line emission from ejected from microquasars and LMXBs will form an extended emission region pc across. Assuming the Ps recombination line emission is uniform over the distance given by Jean et al. [40] we have calculated the surface brightness of a cloud using the same assumptions for , , and as in § III.1.2. The resulting surface brightness of the escaped from microquasars is very faint, and are listed in Table 3.
| Surface brightness/ ph s-1 m-2 arcsec-2 m-1 | ||
| T/ K | Ps Ly | Ps |
| 10 | ||
| 80 | ||
| 8000 (neutral) | ||
| 8000 (ionised) | ||
| 1000000 | ||
Guessoum et al. [34] also consider misaligned microquasars, in which the jet from the accretion disc impinges on the secondary star, as a possible class of point sources of annihilation radiation. Their model accounts for deformation of the stellar surface due to the jet, and the fraction of annihilation photons which escape the atmosphere of the star and the jet induced cavity in the direction of the observer. Thus they calculate expected 511keV fluxes for several confirmed and candidate misaligned microquasars.
We have converted these fluxes into the equivalent recombination line fluxes using the assumptions implicit in equation 2 with the further assumption that recombination line photons emitted in a upward direction escape the surface of the star. This assumption is reasonable since the interaction depth at which relativistic from the jet are slowed down enough to form Ps via charge exchange is g cm-2 (Guessoum et al. 34), whereas the mean free path of visible photons in a typical stellar photosphere is g cm-2, and assuming this value is valid for the wavelengths of both Ps Ly and Ps upward photons should escape the star. The resulting fluxes are given in Table 4 for a K and a K gas. We assume the visual extinction corrections, , from Schlegel et al. [61], but note these may not be accurate for sources close to the Galactic plane.
| K | K | |||
|---|---|---|---|---|
| Source | Ps Ly | Ps | Ps Ly | Ps |
| GRO J1655-40 | 249 | 73.8 | 9.25 | 2.70 |
| V4641 Sgr | 62.7 | 8.74 | 2.33 | 0.320 |
| XTE J1550-564 | 51.3 | 24.7 | 1.90 | 0.903 |
| XTE J1118+480 | 3810 | 299 | 141 | 11.0 |
| LSI+61∘ 303 | 302 | 166 | 11.2 | 6.06 |
| Cyg X-1 | 134 | 99.4 | 4.99 | 3.64 |
| Sco X-1 | 997 | 114 | 36.9 | 4.19 |
| LS5039 | 2.27 | 39.8 | 0.0843 | 1.46 |
| SS433 | 11.5 | 22.8 | 0.425 | 0.835 |
| GRS 1758-258 | 0.114 | 4.10 | 0.00423 | 0.150 |
| Cyg X-3 | 0.386 | 4.41 | 0.0143 | 0.161 |
| CirX-12 | 0.0325 | 2.52 | 0.00121 | 0.0923 |
| GRS 1915+1052 | 0.0000398 | 0.546 | 1.48 | 0.0200 |
| GX 339-4 | 48.2 | 12.4 | 1.79 | 0.454 |
| XTE J1748-288 | 1.33 | 0.00243 | 4.94 | 0.0000891 |
| 1E 1740.7-2942 | 2.62 | 0.000251 | 9.72 | 9.20 |
| IGR J17091-3624 | 109 | 12.7 | 4.05 | 0.464 |
| IGR J17303-0601 | 71.2 | 11.8 | 2.64 | 0.433 |
| IGR J17464-3213 | 0.934 | 5.80 | 0.0346 | 0.212 |
| IGR J18406-0539 | 9.83 | 0.194 | 3.65 | 0.00711 |
III.1.5 Pulsars
Pulsars produce via pair-production due to the interaction of an with the strong magnetic field. We will mainly consider the Ps formation rates for escaping the pulsar, but first we briefly consider forming Ps in the atmosphere of the pulsar.
Usov & Melrose [69] describe a model in which Ps is formed from the decay of synchroton -ray radiation produced in the strong magnetic fields of pulsars. It is argued that the Ps escape from the polar gap with Lorentz factors of , and thereafter quickly dissociate. The Lorentz factors for the Ps in the pulsar are thus so high that the emission lines will be very highly redshifted for any orientation of the beam, even toward or tangential to the observer, due to time dilation. Baring & Harding [2] argue that Ps will be short lived in the atmosphere of pulsars except in the case of very high Lorentz factors or for a narrow range of magnetic field strengths. Thus we will not consider direct observation of Ps in the atmospheres of pulsars further.
We now turn our attention to Ps formed from escaping the pulsar. Sturrock & Baker [66] estimate the production rate from the Crab pulsar to be s-1. Wang et al. [71] examine pair-production from three separate catogories of pulsars: normal pulsars (e.g. the Crab pulsar), magnetars in gamma-ray burst (GRB) progenitors, and milli-second pulsars. They estimate - injection rates of s-1 and s-1 for the Crab and Vela pulsars respectively. For millisecond pulsars they estimate an injection rate of s-1. We do not consider the magnetar GRB progenitors here, since although they may contribute to the diffuse annihilation radiation they are too infrequent in the Galaxy ( yr-1; Piran 55) to be a tenable observational target.
We assume that the leaving the pulsar thermalise before forming Ps, thus they will first diffuse through the ISM according to § III.1.1. The number of positrons as a function of time in the volume around the source, (see § III.1.1), will be
| (9) |
where is the positron injection rate and is the annihilation timescale, and we have made the simplifying assumption that thermalise instantly on injection into the ISM. Thus the number of Ps atoms formed as a function of time is
| (10) |
where as before is the fraction of which form Ps before annihilation. Therefore the Ps formation rate in the volume around a pulsar is
| (11) |
which in the limit becomes
| (12) |
Thus assuming a positron injection rate of s-1 for the Crab pulsar and following the same assumptions as in § III.1.2 we can calculate the Ps surface brightnesses for Ps and Ps Ly around pulsars. The results are given in Table 5; the surface brightnesses for escaped from pulsars are extremely faint.
| Temp/ K | Surface brightness/ | |
|---|---|---|
| ph s-1 m-2 m-1 arcsec-2 | ||
| Ps Ly | Ps | |
| 10 | ||
| 80 | ||
| 8000 (neutral) | ||
| 8000 (ionised) | ||
| 1000000 | ||
III.2 Extragalactic sources
The only detected sources of Ps annihilation radiation are from our own Galaxy and the Sun. However the production processes responsible for the generation of within the Galaxy will also be active in other galaxies, and hence in principle they too should be sources of Ps recombination line emission. This is discussed in § III.2.2. The pair production processes in jets discussed in § III.1.4 will be applicable to the jets of AGN, in which the much larger energies will produce many more pairs, as discussed in § III.2.1. In addition to these sources it is possible that very bright individual sources, such as SNe and GRBs, which are too rare to be observed in our own Galaxy, may be detected in other galaxies.
Observing extragalactic sources of Ps presents its own problems, most apparently the distance to the sources and the corresponding decrease in flux. However, there are some advantages. The combined Ps output of all sources in a galactic bulge will be observable together, providing an increase in the intrinsic luminosity of the Ps compared to individual Galactic sources. Sources can be selected such that the Ps emission, which lies in the infrared region is not coincident with bright atmospheric emission lines.
III.2.1 Active galactic nuclei jets
Powerful relativistic jets are a property of many AGN. These jets emit strongly at radio wavelengths with a power-law spectrum which is interpreted as being due to synchrotron emission from carried at relativistic energies along the magnetic field lines emanating from the poles of the AGN. These jets must be electrically neutral otherwise the potential difference induced by the jet would impede and eventually halt the jet.
It is an unsolved issue whether the positive component of jets consists of protons, positrons or a mixture of both. From a theoretical viewpoint it is expected that AGN jets should contain some - pairs; a pair plasma has the advantage of explaining -ray jets (Blandford & Levinson 9) and the very high Lorentz factors () required to account for superluminal bulk velocities of jets (Begelman et al. 4). From an observational view point the situation is unclear as most attempts to answer this question have had to rely on indirect methods of searching for the presence of . For example estimates on the bulk kinetic energy contained in jets on a variety of scales have been used to argue for both -p plasma (Celotti & Fabian 16) and - plasma (e.g. Reynolds et al. 58; Wardle et al. 72; Hirotani 39).
Marscher et al. [48] searched for the 511 keV annihilation signature in 3C 120, and their non-detection places upper limits on the content of jets (albeit not significantly constraining). In doing so they have also developed theoretical arguments for the content of jets which we will use here to estimate the Ps formation rate due to jets. Marscher et al. [48] show that the flux of in a jet is given by
| (13) |
where is the cross-sectional radius of the jet, is the fraction of the jet which consists of a pair plasma (i.e. is the fraction of the jet), is the Lorentz factor for the bulk velocity of the jet, is the minimum energy of the power-law distribution of relativistic -, is the spectral index of the synchrotron radiation from the jet () and is the normalisation of the - number density per unit energy such that
| (14) |
The parameters , , , and possibly should be determined independently for individual AGN (e.g. as in Marscher et al. 48 for 3C 120). Marscher [47] gives formulæ to relate to observational parameters, viz. the angular size of the source, ; the frequency of synchrotron self-absorption turnover, ; the flux density at , ; the spectral index ; the redshift ; the luminosity distance ; and the Doppler beaming factor ( is the angle of the velocity vector away from the line of sight and is the velocity divided by ).
Ghisellini et al. [31] provide measurements of the above observable parameters for different classes of AGN, viz. BL Lacs, core-dominated quasars (low and high polarisation), lobe dominated quasars and radio galaxies. We have followed the formulæ of Marscher [47] to calculate assuming a spectral index and median values of , since these measurements are not available for all the sources. With the further assumption that (i.e. ) and , and setting m (as calculated for 3C 120 by Marscher et al. 48), we can calculate the positron flux for all the AGN in Ghisellini et al. [31]. We report the mean, median and standard deviation of the fluxes calculated for each class of source in Table 6. For the sources of Ghisellini et al. [31] the blazars are the most powerful emitters. Blazars also have the advantage that the jet is aligned along the line of sight of observations, and is thus not obscured by the dusty torus which surrounds the AGN. Therefore we focus our attention on blazars as the most promising AGN candidate for a successful Ps detection and we assume the mean value of s-1 as the default flux. We note that the assumption of a uniform jet implicit in these calculations may result in the flux being too small by a factor (cf. Marscher et al. 48; see also a similar discussion for uniform/ non-uniform wind Marscher 46). Furthermore there are significant uncertainties in the parameters taken from Ghisellini et al. [31], particularly the self-absorption frequency and consequently the flux at the self-absorption frequency for which it was assumed that the frequency of the VLBI observation is equal to the self-absorption frequency. Bearing these caveats in mind, the values in Table 6 should be treated as approximate.
| Class | No. of sources | Mean/ / s | Median/ /s | / /s |
|---|---|---|---|---|
| BL Lac objects | 22 | |||
| Core-dominated high-polarisation quasars | 24 | |||
| Core-dominated low-polarisation quasars | 24 | |||
| Lobe-dominated quasars | 11 | |||
| Radio galaxies | 8 |
Having calculated the flux from AGN jets we are now in a position to estimate the Ps flux. We assume that the Ps formation rate in the jet is insignificant since the have energies above the ionisation energy of Ps. Furthermore Furlanetto & Loeb [28] show that annihilation before thermalisation occurs for only per cent of produced in jets. When the jet interacts with a gas cloud, the positrons will thermalise on a timescale,
| (15) |
(Furlanetto & Loeb 28), which for K and cm-3 is 0.12 yr. Thus we assume that thermalise instantly on interaction with a cloud.
After thermalisation the diffusion distance will be very small (cf. § III.1.1; Jean et al. 40), thus the interaction of a jet with a cloud will produce a bright spot of Ps formation. Thus assuming s-1 and mag we have calculated the Ps flux for Ps Ly and Ps as a function of redshift, and the results are plotted in Figure 5.


III.2.2 Galaxies
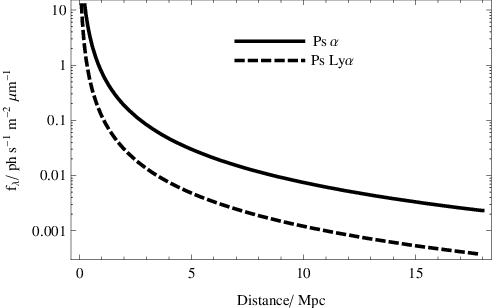
The total 511keV emission from the Galactic bulge and disc is and ph s-1 m-2 respectively (Knödlseder et al. 42). Using equation 2 and assuming a temperature of K and a visual extinction of mag this translates into a line flux density of and 1900 ph s-1 m-2 m-1 for Ps and Ps Ly respectively. We assume that this value holds for all other large spiral galaxies. Thus for local galaxies we can compute the expected line flux density by scaling the above numbers by , where is the distance to the galaxy in kpc; we show results out to a distance of the Virgo cluster (18 Mpc) in Figure 6.
We note that the assumption of the similarity of other galaxies to the Milky Way in terms of production and annihilation can only be considered an approximate estimate; different classes of galaxies could produce different amounts of than the Milky Way. In particular starbursts and ULIRGs could be copious emitters due to the SNe and other high energy processes associated with star-formation regions.
III.2.3 Supernovæ and gamma-ray bursts
Supernovæ and gamma ray bursts are both expected to produce copious amounts of positrons (see § III.1.2). They are too rare to be useful candidates of Galactic Ps, and their remnants are too diffuse, but they could be very promising candidates for observation in other galaxies.. Figure 2 shows the estimated line flux density for SNIa as a function of distance.
The results are expected to be similar for GRBs. Furlanetto & Loeb [29] estimate to be released in a GRB, with only a “small fraction” annihilating in the early stages during which the ejecta expands (cf. 5 per cent for SNeIa in § III.1.2). Similarly Cassé et al. [15] predict to be produced by a GRB.
IV PROSPECTS FOR DETECTION
Having examined potential sources of Ps recombination lines, and estimated the strength of the sources we now assess the feasibility of observation. We begin with a summary of the expected Ps fluxes with a comparison to current upper limits based on the non-detections of Ps Paschen- by Puxley & Skinner [57], the non-detection of Galactic 511keV point sources by Knödlseder et al. [42] and the non-detection of 511keV annihilation in the jets of 3C 120 by Marscher et al. [48]. We then examine the sensitivity of current and upcoming instruments to Ps Ly and Ps emission. We finish by simulating observations of Ps in AGN.
IV.1 Current observational limits to Ps recombination line emission
IV.1.1 Puxley & Skinner [57]
The most direct observational constraint on Ps recombination emission line strengths comes from the non-detection by Puxley & Skinner [57] who searched for Ps Paschen- from the Galactic centre. They found an upper-limit to the line strength of W m-2. If we assume a temperature of the ISM of K and an extinction of mag, we can use the relative line strengths predicted by Wallyn et al. [70] to convert this to a line strength of Ps Ly= and Ps= ph s-1 m-2 m-1, where we have also divided by the line width as given by equation 3. These upper-limits are not constraining compared to the expected fluxes calculated in § III.
IV.1.2 Knödlseder et al. [42]
We have discussed the limits on the Ps recombination emission line strength provided by current 511keV observations as given by Knödlseder et al. [42] in § III.1. For instance, if we assume that there are 100 sources of equal strength responsible for the total Galactic 511keV radiation then this equates to line strengths of Ps Ly= and Ps= ph s-1 m-2 m-1, see Figure 1.
Knödlseder et al. [42] also provide 511keV 3 flux limits for individual sources (see their table 4). We convert these to Ps Ly and Ps flux limits again assuming K and using the appropriate extinction values from Schlegel et al. [61] or mag for sources close the Galactic plane for which the extinction models are inaccurate. We use the most constraining observations for each class of source and compare these to our predictions in Table 7. From our predictions it is not expected that any of the sources would have been observed.
IV.1.3 Marscher et al. [48]
Marscher et al. [48] searched for annihilation radiation in the jet of 3C 120 and find a 2 upper limit of ph s-1 m-2. We again convert to Ps emission line strengths assuming K with mag, and find Ps Ly= and Ps= ph s-1 m-2 m-1.
IV.1.4 Comparison of observational limits to expected fluxes
We summarise the results of § III in Table 7 and compare the results to the upper limits discussed above. For the sources for which we gave surface brightnesses (e.g. supernovæ) we convert to the flux over the entire object for comparison to the upper limits. We also convert the fluxes predicted in § III to the appropriate distance and extinction for the source in question. We quote the results as flux densities (per m-1), which takes into account the width of the line and makes a comparison to the background more meaningful. From our estimates of the fluxes of the sources it is not expected that any of the sources should have been detected in the 511keV observations.
| Source | Predicted Flux | Upper limit | ||
| ph s-1 m-2 m-1 | ||||
| Ps Ly | Ps | Ps Ly | Ps | |
| Kepler SNR | 1.6 | 7.9 | 12a | 60a |
| LMXB GX 5-1 | 0.065 | 3.7 | 0.65a | 37a |
| Crab Pulsar | 130 | 110 | 190a | 160a |
| 3C 120 | 8.9 | 1.5 | 170b | 50b |
IV.2 Expected sensitivity of current and future instruments
We now examine the sensitivity of current and future instruments to Ps emission line radiation. The signal to noise ratio is given by
| (16) |
where is the exposure time, is a factor which takes into account the efficiency of the instrument and collecting area of the telescope, is the background, is the detector dark current and is detector read out noise. Since the expected Ps recombination line emission is faint in all cases it is likely that the background will also include continuum emission from the source in question as well as the usual night sky background etc.
We first address the issue of whether it is more efficient to observe Ps Ly or Ps. Ps Ly is always intrinsically brighter than Ps. It does not follow however, that it is more efficient to observe Ps Ly than Ps. This is because the interstellar extinction, the line width, the background and the seeing all very with wavelength.
Interstellar extinction is greater for Ps Ly than for Ps. This means that the integrated line strength for Ps is greater than that for Ps Ly for visual extinctions mag, where the exact value depends on the temperature of the ISM in which the Ps is forming, see Figure 7. However, the line width is also greater for Ps compared to Ps Ly so the line flux density, , which is more meaningful to compare to the background is greater for Ps for visual extinctions mag, see Figure 8.


A proper assessment of the most fruitful observing strategy depends on other factors, most notably the background emission and the efficiency of the instruments. Therefore we now discuss the different backgrounds for Ps Ly and Ps, and then determine the expected sensitivity of observations compared to the expected brightnesses of example objects.
The U band background at a typical good observing site is mag arcsec-2, which is equivalent to a background of ph s-1 m-2 m-1 arcsec-2, which we assume is also appropriate for observations at 2430Å.
The background in the near-infrared is dominated by atmospheric hydroxyl emission lines. Thus the background depends sensitively on the wavelength and the resolution of the observations. Figure 9 shows the logged background around the Ps line, taken from the model of Ellis & Bland-Hawthorn [27]. There is a very bright OH emission line very close to the Ps line. Note that Figure 9 is at the intrinsic resolution of the night sky, i.e. the width of the lines is the natural width due Doppler and pressure broadening; when observed with a spectrograph, the resolution and scattering of the spectrograph will cause the OH line to severely contaminate the Ps line. Subtracting the OH line results in a high Poisson and systematic noise (see Davies 20; Ellis & Bland-Hawthorn 27). Indeed, we postulate that this is the reason that Ps has never been observed serendipitously.

The brightness of the near-infrared sky is problematic for many areas of observational astronomy, as exemplified by the particular science case of detecting Ps. For this reason there have been significant technological developments aimed at tackling this problem. The implementation of several of these projects is now imminent, promising much darker near-infrared skies in the near future. These technological developments are the motivation behind our renewed interest in the long standing observational challenge of detecting Ps recombination emission lines.
There are two technologies in particular which should be very beneficial for the detection of Ps. These are the James Webb Space Telescope33 3 JWST http://www.jwst.nasa.gov/ (see e.g. Gardner et al. 30) and OH suppressing fibre Bragg gratings (Bland-Hawthorn et al. 8, Bland-Hawthorn et al. 6). The James Webb Telescope mission is designed specifically to achieve very low infrared backgrounds, both for imaging and moderate resolution spectroscopy (–3000).
Bland-Hawthorn et al. [8] and Bland-Hawthorn et al. [6] present a novel photonic solution to the problem of the NIR night sky for ground based telesopes. Used in conjunction with adaptive optics and large telescopes OH suppression offers very low backgrounds; fibre Bragg gratings can suppress the OH lines by factors of dB at a resolution 10,000. For an estimate of the performance and impact of FBG OH suppression on astrophsyical observations see Ellis & Bland-Hawthorn [27]; for a demonstration of their performance in on-sky tests see Bland-Hawthorn et al. [7].
Thus future NIR spectrographs will benefit from much lower backgrounds. The thick black line in Figure 9 shows the expected background around the Ps line after suppression with FBG technology based on current performance. We note that at NIR wavelengths the background can be further reduced with adaptive optics which permits the use of a smaller aperture to collect the same object flux. After OH suppression the background flux density at the wavelength of Ps is less than that of Ps Ly, assuming the interline continuum in the model of Ellis & Bland-Hawthorn [27] is correct.
The calculation of the difference in backgrounds is complicated by the fact that the line width of Ps is greater than that of Ps Ly and so the background must be integrated over a larger wavelength range for Ps. Conversely the seeing is smaller at longer wavelengths, and so the Ps background can be measured from a smaller aperture than for Ps Ly; this effect is even more pronounced with adaptive optics which can further reduce the necessary aperture in the infrared, but not in the ultraviolet.
In order to take into account all these various effects we have calculated the Ps Ly and Ps flux limits to obtain a signal-to-noise of 10 as a function of time for backgrounds corresponding to Ps Ly in natural seeing and Ps in natural seeing and adaptive optics corrected and with and without OH suppression. The results are shown in Figure 10. (Note that here we quote the results as total line strengths since the signal to noise calculation requires integrating the emission line and the background over the line width.) We assume that the Ps lines are resolved, and the backgrounds integrated over the line width are 0.0272, 13.05 and 0.197 ph s-1 m-2 arcsec-2 for Ps Ly, Ps and OH suppressed Ps respectively. We assume that natural seeing is 1 arcsec in the UV and 0.5 arcsec in the NIR and that AO delivers a PSF of 0.1 arcsec FWHM. We assumed a 8m telescope and a total system efficiency of 0.2.

The limiting fluxes are compared to the average expected flux for microquasars (specifically we compare to GROJ1655-40 the brightest confirmed mis-aligned microquasar, cf. Table 3) as calculated above in § III.1.4. Both the Ps Ly and the Ps lines should easily be detectable. We also compare to the fluxes for 3C 120, assuming the same backgrounds as for Ps at (note that the NIR background is a strong function of wavelength so this assumption is approximate in the case of no OH suppression). In this case the Ps emission lines are too faint to be detected in natural seeing and natural backgrounds for both Ps Ly and Ps. However with OH suppression and or AO correction Ps should be detectable.
IV.3 Simulations
We have estimated the Ps recombination emission line strengths for a wide variety of sources; the expected fluxes are fainter than current observational limits for Ps Ly and marginal for Ps. However with the development of OH suppressing technologies and the future launch of the JWST (Gardner et al. 30) we are on the threshold of a new era in NIR spectroscopy with much lower backgrounds and consequently much more sensitivity. The improved sensitivity will make the detection of Ps lines feasible.
The most promising targets for observation are mis-aligned microquasars and active galactic nuclei. Emission from other candidates is generally too diffuse. Mis-aligned microquasars should have a spot of Ps emission where the jet impacts the secondary star. AGN should have similar spots of emission where the jet impacts gas clouds surrounding the nucleus. In the case of AGN there will be bright emission from the nucleus itself, which must be subtracted off to reveal the faint Ps emission.
We have simulated observations of Ps from an AGN. We use the observations of NGC 4151 by Storchi-Bergmann et al. [65] as our template for the the AGN emission. Specifically we model the spectrum of the region 0.7 arcsec E of the nuclues (see their figure 2, panel B), taking emission line fluxes from their table 1 and using a continuum value of erg s-1 cm-2 Å-1. We model the Ps line by taking the flux for 3C120 based on the calculations of Marscher et al. [48] (see Table 7) and scaling it to the redshift of NGC 4151. The background spectrum is taken from Ellis & Bland-Hawthorn [27]. The simulated components of the spectrum are shown in Figure 11.

The simulations assume OH suppressed observations on an 8m telescope with a 1 arcsec diameter fibre bundle as described in Ellis & Bland-Hawthorn [27], with adaptive optics correction delivering a Strehl ratio of 0.3. The spectral resolution was assumed to be . The simulations assume a varying night-sky background and systematic errors in wavelength calibrations between reads. For further details see Ellis & Bland-Hawthorn [27].
Since the AGN continuum is much brighter than the Ps it must be treated as background, and observations will be required of the AGN plus Ps and of the AGN alone. For this reason we anticipate that integral field spectroscopy will allow the greatest chance of a successful detection, since fluxes from many regions of the AGN can be differenced, nullifying the requirement to know a priori in which region Ps might be forming.
For the purposes of the simulation we assume that the AGN continuum can be precisely scaled between these two locations (i.e. in the simulations we assume the AGN emission does not change). The simulation assumes a 6hr observation (composed of 1230 min individual exposures) of both regions. The resulting background and continuum subtracted spectrum is shown in Figure 12. The Ps line is clearly visible. Without OH suppression the Ps is much fainter than the noise from the residual sky lines, and any detections would be marginal.

V SUMMARY AND DISCUSSION
The existence of astrophysical sources of Ps is revealed through observations of Ps annihilation radiation emanating from the Galactic bulge, with a weaker component originating in the disc (e.g. Weidenspointner et al. 73). It is expected that those Ps atoms in the triplet state will emit recombination emission lines prior to annihilation (McClintock 49). The wavelengths of the recombination spectral lines will be twice those of the corresponding hydrogen lines (Mohorovičić 52). In this paper we have assessed the possibility of observing the Ps recombination spectrum.
In § II we reviewed the physics of the formation, annihilation and recombination spectrum of Ps. It was argued that Ps formation will not take place in most astrophysical environments until the are in thermal equilibrium with the ISM. The reason is that are produced in high energy processes, and they are initially relativistic. They must therefore lose energy before they can radiatively recombine with a free electron or undergo charge exchange with a H atom to form Ps. We note that for photoionised astrophysical environments with temperatures in the range – K, Ps formation by radiative recombination dominates both charge exchange and the direct annihilation of with bound or free electrons. This will be this case in close proximity to most astrophysical sources of Ps, which will also emit strong ultraviolet radiation which will ionise the surrounding medium. We emphasise that this is not the case for most , which will travel far from their origin (§ III.1.1); in a collisionally ionised medium charge exchange dominates radiative recombination for temperatures K (McClintock 49). However, in the case of point sources of Ps recombination emission lines, we are interested in the regime in which the Ps is formed in close proximity to the source and therefore assume that radiative recombination dominates. Following these arguments, we gave formulæ to calculate the Ps emission line strengths for sources of known production rate under different conditions in the ISM. We also developed a formula to convert 511keV fluxes to Ps recombination line fluxes.
In § III we reviewed possible sources of , both Galactic and extragalactic, and estimated production rates from the literature. The production rates were used to calculate Ps emission line strengths. Taking into account diffusion in the ISM (cf. § III.1.1 and Jean et al. 40) showed that for sources in which the are ejected isotropically into the ISM the resulting Ps emission line has very low surface brightness. Thus whilst sources such as SNe, novæ and pulsars may produce a potentially significant fraction of the total Galactic budget, they are not promising candidates for Ps recombination line observations.
On the other hand sources such as microquasars, LMXBs and AGN jets are potentially promising candidates in which to observe Ps recombination lines. The reason being that the are anisotropic and may therefore produce a point source of emission if the jet collides with a dense cloud in the ISM. For example in mis-aligned microquasars the jet impacts the secondary star, in LMXBs the jet may collide with stellar winds, and in AGN the jet will impact the gas clouds surrounding the galactic nucleus.
In § IV we examined the prospects for detecting such sources. We first compared our predictions of Ps recombination line fluxes to existing observational constraints. All predicted fluxes are lower than current upper limits to the Ps emission line fluxes. We therefore examined the sensitivity of current instrumentation, cf. Figure 10. The brightest mis-aligned microquasars should be detectable with current technology; more moderate sources are below current sensitivity limits. The brightest AGN are below the sensitivity of current instrumentation. In order to observe large samples of objects, e.g. to constrain the Galactic positron budget for a particular class of sources, requires deeper observations than are currently feasible.
The flux limits of observations of Ps Ly are rather sensitive to the extinction, sources with low extinction will be brighter at Ps Ly than Ps (cf. Figures 7 and 8). Thus deep observations with careful continuum subtraction may yield Ps Ly detections.
The current handicap to observations of Ps is the brightness of the background; this situation will not last for much longer. Several imminent advances in near-infrared spectroscopy will allow much deeper observations than currently possible. In particular the long standing problem of the night-sky is very close to being solved both by the launch of the JWST, and through photonic OH suppression from the ground (Bland-Hawthorn et al. 8, Bland-Hawthorn et al. 6). Combined with advances in adaptive optics and NIR detector technology the prospect of detecting Ps in the near future is propitious, cf. Figure 10.
The successful detection of Ps recombination lines has the potential to yield immediate advances in our knowledge of several topics of interest. Observations of Ps recombination lines at the location of AGN jet-cloud interactions would provide direct confirmation that jets are composed of a pair plasma – a long standing problem which is still controversial (e.g. Celotti & Fabian 16; Reynolds et al. 58; Wardle et al. 72; Hirotani 39). We suggest an observing campaign of several classes of AGN, e.g. targeting the regions around the jets of blazars, offering a potentially unobscured view of the most energetic region of the AGN, and the possibility of Ps formation in the regions adjacent to the jet. Similarly observations of the radio lobes of AGN offer the possibility of detecting the location at which the surviving the jet thermalise with the ISM.
An immediate and direct advance in our knowledge of the origin Galactic would result from a detection of Ps emission from a class of Galactic sources such as microquasars. This would place direct constraints on the significance of such sources the Galactic budget, and indirect constraints on the significance of other sources through comparison with the total budget from 511keV observations. Similarly, such detections would place constraints on the astrophysical processes responsible for the production of in the sources.
Looking further into the future, one can envisage more ambitious experiments. For example, many models of dark matter invoke a super-symmetric dark matter particle. In this case the dark matter particle will annihilate (albeit with a small cross section), resulting in the eventual production of an - pair (see e.g. Boehm et al. 10). Such a mechanism has been proposed to account for the Galactic 511keV radiation described above. If significant constraints can be placed on the astrophysical origin of Galactic this may have implications on the masses or existence of super-symmetric dark matter particles. If dark matter were found to be a significant source of Galactic then one could in principle use observations of Ps recombination lines to infer the masses and density profiles of dark matter haloes. Such experiments are not feasible with any envisaged telescopes, but are a theoretically interesting possibility.
VI ACKNOWLEDGMENTS
We thank the referee for useful comments which have improved this manuscript. We thank Alan Marscher for advice on the calculation of the flux in AGN jets. JBH is supported by a Federation Fellowship from the Australian Research Council.
References
- [1] Anderson, C. D. 1933, Phys. Rev., 43, 491
- [2] Baring, M. G., Harding, A. K. 2001, ApJ, 547, 929
- [3] Beacom, J. F., Bell, N. F., Bertone, G. 2005, Physical Review Letters, 94, 171301
- [4] Begelman, M. C., Blandford, R. D., Rees, M. J. 1984, Reviews of Modern Physics, 56, 255
- [5] Berko, S., Pendleton, H. N. 1980, Annual Review of Nuclear and Particle Science, 30, 543
- [6] Bland-Hawthorn, J., Buryak, A., Kolossovski, K. 2008, Journal of the Optical Society of America A, 25, 153
- [7] Bland-Hawthorn, J., Ellis, S., Haynes, R., Horton, A. 2009, Anglo-Australian Observatory Newsletter, 115, 15
- [8] Bland-Hawthorn, J., Englund, M., Edvell, G. 2004, Optics Express, 12, 5902
- [9] Blandford, R. D., Levinson, A. 1995, ApJ, 441, 79
- [10] Boehm, C., Hooper, D., Silk, J., Casse, M., Paul, J. 2004, Physical Review Letters, 92, 101301
- [11] Burdyuzha, V. V., Kauts, V. L. 1997, Ap&SS, 258, 329
- [12] Bussard, R. W., Ramaty, R., Drachman, R. J. 1979, ApJ, 228, 928
- [13] Canter, K. F., Mills, Jr., A. P., Berko, S. 1975, Physical Review Letters, 34, 177
- [14] Cappellaro, E., Turatto, M., Tsvetkov, D. Y., Bartunov, O. S., Pollas, C., Evans, R., Hamuy, M. 1997, A&A, 322, 431
- [15] Cassé, M., Cordier, B., Paul, J., Schanne, S. 2004, ApJ, 602, L17
- [16] Celotti, A., Fabian, A. C. 1993, MNRAS, 264, 228
- [17] Chan, K.-W., Lingenfelter, R. E. 1993, ApJ, 405, 614
- [18] Chupp, E. L., Forrest, D. J., Higbie, P. R., Suri, A. N., Tsai, C., Dunphy, P. P. 1973, Nature, 241, 333
- [19] Clayton, D. D., Hoyle, F. 1974, ApJ, 187, L101
- [20] Davies, R. I. 2007, MNRAS, 375, 1099
- [21] Debenedetti, S., Corben, H. C. 1954, Annual Review of Nuclear Science, 4, 191
- [22] Deutsch, M. 1951, Phys. Rev., 83, 866
- [23] Dirac, P. 1933, Camb. Phil. Soc. Proc., 30, 150
- [24] Dolgov, A. D. 2002, Nuclear Physics B Proceedings Supplements, 113, 40
- [25] Dutra, C. M., Santiago, B. X., Bica, E. 2002, A&A, 381, 219
- [26] Eisberg, R., Resnick, R. 1985, Quantum Physics of Atoms, Molecules, Solids, Nuclei, and Particles, 2nd Edition (Quantum Physics of Atoms, Molecules, Solids, Nuclei, and Particles, 2nd Edition, by Robert Eisberg, Robert Resnick, pp. 864. ISBN 0-471-87373-X. Wiley-VCH , January 1985.)
- [27] Ellis, S. C., Bland-Hawthorn, J. 2008, MNRAS, 386, 47
- [28] Furlanetto, S. R., Loeb, A. 2002, ApJ, 572, 796
- [29] Furlanetto, S. R., Loeb, A. 2002, ApJ, 569, L91
- [30] Gardner, J. P., et al. 2006, Space Science Reviews, 123, 485
- [31] Ghisellini, G., Padovani, P., Celotti, A., Maraschi, L. 1993, ApJ, 407, 65
- [32] Gillard, W., Jean, P., Marcowith, A., Ferrière, K. 2007, in ESA Special Publication, Vol. 622, ESA Special Publication, 65–+
- [33] Guessoum, N., Jean, P., Gillard, W. 2005, A&A, 436, 171
- [34] Guessoum, N., Jean, P., Prantzos, N. 2006, A&A, 457, 753
- [35] Guessoum, N., Ramaty, R., Lingenfelter, R. 1991, ApJ, 378, 170
- [36] Hauser, M. G., Dwek, E. 2001, ARA&A, 39, 249
- [37] Hernanz, M., Gómez-Gomar, J., José, J. 2002, New Astronomy Review, 46, 559
- [38] Hernanz, M., José, J., Coc, A., Gómez-Gomar, J., Isern, J. 1999, ApJ, 526, L97
- [39] Hirotani, K. 2005, ApJ, 619, 73
- [40] Jean, P., Knödlseder, J., Gillard, W., Guessoum, N., Ferrière, K., Marcowith, A., Lonjou, V., Roques, J. P. 2006, A&A, 445, 579
- [41] Knödlseder, J., et al. 1999, A&A, 344, 68
- [42] Knödlseder, J., et al. 2005, A&A, 441, 513
- [43] Leising, M. D., Clayton, D. D. 1987, ApJ, 323, 159
- [44] Leventhal, M., MacCallum, C. J., Stang, P. D. 1978, ApJ, 225, L11
- [45] Mannucci, F., Della Valle, M., Panagia, N., Cappellaro, E., Cresci, G., Maiolino, R., Petrosian, A., Turatto, M. 2005, A&A, 433, 807
- [46] Marscher, A. P. 1977, ApJ, 216, 244
- [47] Marscher, A. P. 1983, ApJ, 264, 296
- [48] Marscher, A. P., Jorstad, S. G., Gómez, J. L., McHardy, I. M., Krichbaum, T. P., Agudo, I. 2007, ApJ, 665, 232
- [49] McClintock, J. E. 1984, ApJ, 282, 291
- [50] Milne, P. A., Kurfess, J. D., Kinzer, R. L., Leising, M. D. 2002, New Astronomy Review, 46, 553
- [51] Milne, P. A., The, L.-S., Leising, M. D. 1999, ApJS, 124, 503
- [52] Mohorovičić, S. 1934, Astron. Nachr., 253, 93
- [53] Murphy, R. J., Share, G. H., Skibo, J. G., Kozlovsky, B. 2005, ApJS, 161, 495
- [54] Ore, A., Powell, J. L. 1949, Phys. Rev., 75, 1696
- [55] Piran, T. 2004, Rev. Mod. Phys., 76, 1143
- [56] Prantzos, N. 2006, aanda, 449, 869
- [57] Puxley, P. J., Skinner, C. K. 1996, in Astronomical Society of the Pacific Conference Series, Vol. 102, The Galactic Center, ed. R. Gredel, 439
- [58] Reynolds, C. S., Fabian, A. C., Celotti, A., Rees, M. J. 1996, MNRAS, 283, 873
- [59] Rieke, G. H., Lebofsky, M. J. 1985, ApJ, 288, 618
- [60] Sakharov, A. D. 1967, Soviet Journal of Experimental and Theoretical Physics Letters, 5, 24
- [61] Schlegel, D. J., Finkbeiner, D. P., Davis, M. 1998, ApJ, 500, 525
- [62] Shanks, T., Georgantopoulos, I., Stewart, G. C., Pounds, K. A., Boyle, B. J., Griffiths, R. E. 1991, Nature, 353, 315
- [63] Smith, R., et al. 2006, in Presented at the Society of Photo-Optical Instrumentation Engineers (SPIE) Conference, Vol. 6276, High Energy, Optical, and Infrared Detectors for Astronomy II. Edited by Dorn, David A.; Holland, Andrew D.. Proceedings of the SPIE, Volume 6276, pp. 62760R (2006).
- [64] Steigman, G. 1976, ARA&A, 14, 339
- [65] Storchi-Bergmann, T., McGregor, P. J., Riffel, R. A., Simões Lopes, R., Beck, T., Dopita, M. 2009, MNRAS, 394, 1148
- [66] Sturrock, P. A., Baker, K. B. 1979, ApJ, 234, 612
- [67] Tammann, G. A., Loeffler, W., Schroeder, A. 1994, ApJS, 92, 487
- [68] Tavani, M., et al. 2009, ArXiv e-prints
- [69] Usov, V. V., Melrose, D. B. 1996, ApJ, 464, 306
- [70] Wallyn, P., Mahoney, W. A., Durouchoux, P., Chapuis, C. 1996, ApJ, 465, 473
- [71] Wang, W., Pun, C. S. J., Cheng, K. S. 2006, A&A, 446, 943
- [72] Wardle, J. F. C., Homan, D. C., Ojha, R., Roberts, D. H. 1998, Nature, 395, 457
- [73] Weidenspointner, G., et al. 2008a, New Astronomy Review, 52, 454
- [74] Weidenspointner, G., et al. 2006, A&A, 450, 1013
- [75] Weidenspointner, G., et al. 2008b, Nature, 451, 159
- [76] Wheeler, J. A. 1946, Ann. N. Y. Acad. Sci., 48, 219
- [77] Wiese, W. L., Smith, M. W., Glennon, B. M. 1966, Atomic transition probabilities. Vol.: Hydrogen through Neon. A critical data compilation (NSRDS-NBS 4, Washington, D.C.: US Department of Commerce, National Buereau of Standards, 1966)
- [78] Wolfenstein, L., Ravenhall, D. G. 1952, Physical Review, 88, 279
- [79] Yang, C. N. 1950, Physical Review, 77, 242
- [80] Zurek, W. H. 1985, ApJ, 289, 603