BLAST: the far-infrared/radio correlation in distant galaxies
Abstract
We investigate the correlation between far-infrared (FIR) and radio luminosities in distant galaxies, a lynchpin of modern astronomy. We use data from the Balloon-borne Large Aperture Submillimetre Telescope (BLAST), Spitzer, the Large Apex BOlometer CamerA (LABOCA), the Very Large Array (VLA) and the Giant Metre-wave Radio Telescope (GMRT) in the Extended Chandra Deep Field South (ECDFS). For a catalogue of BLAST 250-m-selected galaxies, we re-measure the 70–870-m flux densities at the positions of their most likely 24-m counterparts, which have a median [interquartile] redshift of 0.74 [0.25, 1.57]. From these, we determine the monochromatic flux density ratio, (= log10 []), and the bolometric equivalent, . At , where our 250-m filter probes rest-frame 160-m emission, we find no evolution relative to for local galaxies. We also stack the FIR and submm images at the positions of 24-m- and radio-selected galaxies. The difference between seen for 250-m- and radio-selected galaxies suggests star formation provides most of the IR luminosity in 100-Jy radio galaxies, but rather less for those in the mJy regime. For the 24-m sample, the radio spectral index is constant across , but exhibits tentative evidence of a steady decline such that – significant evolution, spanning the epoch of galaxy formation, with major implications for techniques that rely on the FIR/radio correlation. We compare with model predictions and speculate that we may be seeing the increase in radio activity that gives rise to the radio background.
Keywords:
galaxies: evolution — infrared: galaxies — radio continuum: galaxies.1 Introduction
The correlation between FIR and radio luminosities (van der Kruit, 1971; Dickey & Salpeter, 1984; de Jong et al., 1985; Helou et al., 1985, e.g.) is believed to be due to a common link with massive, dust-enshrouded stars. During their brief lives these stars warm the dusty molecular clouds in which they were born, expel dust in their winds, then create radio-luminous supernova remnants (which are believed to accelerate cosmic-ray electrons), perhaps generating more dust during this finale (Dunne et al., 2009b, e.g.).
The empirical FIR/radio correlation is regularly exploited in a variety of ways – to calibrate the relationship between radio luminosity and star-formation rate (Condon, 1992; Bell, 2003), for example, or to estimate the distance to luminous starbursts (Carilli & Yun, 1999, e.g.), or their dust temperatures (Chapman et al., 2005, – e.g.), or to define samples of radio-excess active galactic nuclei (Donley et al., 2005, AGN – e.g.). The correlation has thus become a cornerstone of modern astronomy. It is clearly important to know whether the correlation breaks down at extreme luminosities, or varies with redshift, perhaps due to variations in magnetic field strength (Bernet et al., 2008, e.g.), IR photon density, initial mass function (IMF), dust composition or cosmic-ray flux (Rengarajan, 2005, e.g.).
Recent efforts have concentrated on determining the relationship between radio and 24-m flux densities, = , taking advantage of Spitzer’s sensitivity to hot dust emission from very distant star-forming galaxies (Appleton et al., 2004; Ibar et al., 2008, e.g.). A galaxy’s 24-m luminosity is not a particularly reliable tracer of its FIR luminosity, however, being prone to uncertain contamination by AGN continuum emission and by spectral features due to silicates and polycyclic aromatic hydrocarbons (Pope et al., 2006; Desai et al., 2007, PAHs –).
Appleton et al. noted that ‘Ideally, it would be better to measure a bolometric , but insufficient data are available at longer wavelengths to do this reliably’. Here, we exploit new data from BLAST (Devlin et al., 2009) and the LABOCA ECDFS Submm Survey (Weiss et al., 2009, LESS –) to explore the correlation between bolometric IR luminosity and -corrected radio luminosity. We do this separately for FIR-, 24-m- and radio-selected galaxies. The latter catagories are explored in §4.4, stacking at the positions of 24-m and radio emitters.
Before we describe our analysis, the question of how best to explore the FIR/radio correlation for FIR-selected galaxies merits discussion. A thorough treatment of the IR and radio properties of FIR-selected galaxies must be able to deal with the potentially FIR-loud and radio-weak fractions of the sample. If the available FIR data were well matched in resolution to typical optical/IR or radio imaging then comparing FIR and radio properties would be trivial. As things stand, however, the BLAST 250-m beam covers 500 more area than a typical VLA synthesised beam and matching FIR and radio sources is non-trivial (§3.1).
We must consider how to deal with cases where counterparts to our FIR emitters cannot be found. This leaves us with no way to determine their positions unambigiously, or even their FIR flux densities since they are often blended, or their radio flux densities (or appropriate limits), or their redshifts. We can not begin the analysis by pinpointing the FIR emitters in the radio waveband since this introduces a strong bias in favour of the most luminous radio emitters. Marsden et al. (2009) showed that the 24-m galaxy population detected by Spitzer (Magnelli et al., 2009) can account for all of the FIR background, as measured by the Cosmic Background Explorer (Puget et al., 1996; Fixsen et al., 1998). We have already noted that the correlation between 24-m and FIR luminosities is poor, but every FIR source should have a 24-m counterpart and our approach to pinning down the positions and radio properties of the parent sample is to adopt the 24-m identifications proposed by Dye et al. (2009) or, where Dye et al. opts for a radio identification, our own 24-m identifications. Armed with these positions, we determine the radio properties and redshifts of the appropriate counterparts, including appropriate limits for any that lack radio emission.
Our paper is laid out as follows. In §2 we introduce a 250-m-selected sample of galaxies from BLAST and the Spitzer, LABOCA, VLA and GMRT data used to determine their IR and radio spectral energy distributions (SEDs). In §3.1 we cross-match our FIR sample with radio emitters, demonstrating how difficult this will be for deep surveys with Herschel. We cross-match with the most likely 24-m counterparts (§3.2), enabling us to explore the FIR/radio correlation for our 250-m-selected galaxies in §4, unbiased by radio selection. We also investigate the correlation for 24-m- and radio-selected samples (§4.4 and 4.5), via the stacking technique (Ivison et al., 2007a; Dunne et al., 2009a; Marsden et al., 2009, e.g.), looking at the effect of corrections using several SED templates. We state our conclusions in §5.
Throughout this paper we assume a Universe with , and km s-1 Mpc-1 (Spergel et al., 2007).
2 Observations
Our primary dataset, known as ‘BLAST GOODS South – Deep’ (Dickinson et al., 2003, where GOODS is the Great Observatories Origins Deep Survey –) was taken during BLAST’s Antarctic flight in 2006 (Devlin et al., 2009) and comprises maps11 1 Available at http://blastexperiment.info covering the ECDFS at 250, 350 and 500 m. We combine them with panchromatic data, including the deepest available 70–160-m imaging from Spitzer – from the Far-Infrared Deep Extragalactic Legacy survey (FIDEL), with 870-m LABOCA imaging from the 12-m Atacama Pathfinder EXperiment (APEX) telescope (Weiss et al., 2009), with high-resolution 1,400-MHz imaging from the VLA (Miller et al., 2008; Biggs et al., 2009) and with new 610-MHz imaging from the GMRT. This latter dataset allows us to -correct the 1,400-MHz radio luminosity accurately out to , and beyond if the spectra are intrinsic power laws. Previous work assumes radio emitters share a common spectral index, (where ) – a poor approximation, as shown by Ibar et al. (2009). Together, these data are capable – prior to operations with Herschel – of determining the bolometric IR luminosities of distant galaxies.
In order to take full advantage of the best available multi-wavelength coverage, we limit the areal coverage of this study to that of the deep VLA imaging described in §2.4, a region of radius 17.2 arcmin centred on (see Fig. 1). This area coincides with the deepest of the BLAST surveys.

2.1 BLAST 250-, 350- and 500-m measurements
The 1.8-m Balloon-borne Large Aperture Telescope, BLAST, is a forerunner of the Spectral and Photometric Imaging Receiver (Griffin et al., 2009, SPIRE –) on the 3.5-m Herschel Space Observatory. Data here are from the successful 2006 flight, lasting 270 hr, of which 90 hr was spent surveying a field centred on the ECDFS.
In the part of this survey used here, the mean instrumental [confusion] noise levels are 11 [21], 9 [17] and 6 [15] mJy beam-1 at 250, 350 and 500 m, respectively, where the beams had fwhm of 36, 42 and 60 arcsec (Devlin et al., 2009; Marsden et al., 2009) and the noise values were determined in beam-smoothed maps.
As our parent catalogue we adopt the sample of 250-m BLAST sources described by Devlin et al. (2009), cutting at a signal-to-noise ratio (SNR) of three, where the uncertainty in flux comprised the quadrature sum of the instrumental noise (used to define SNR in the Devlin et al. catalogue) and the confusion noise. The reliability of our sample is thus similar to those of the first submm galaxy (SMG) catalogues (Smail et al., 1997; Hughes et al., 1998; Barger et al., 1998, e.g.). Thus defined, our parent catalogue comprises 22 sources, listed in Table 1 and marked in Fig. 1.
For the FIR measurements described in the sections that follow, the BLAST image in each of the three filters has been convolved with the appropriate noise-weighted point spread function (Truch et al., 2009, PSF –). This is equivalent to calculating the maximum-likelihood point-source flux density by which the PSF would have been scaled to fit an isolated point source centred in each pixel. Flux densities in each band are taken from these convolved maps at the appropriate positions.
Since the differential 250-m source counts fall rapidly with flux (Patanchon et al., 2009, – see), the effects of Eddington bias and source confusion have conspired to boost the fluxes in our parent catalogue. To determine the degree of boosting, we simulate these effects by injecting a source population consistent with the BLAST counts (Patanchon et al., 2009) into a Gaussian noise field resembling the instrumental fluctuations in the BLAST GOODS South – Deep field and then measuring the flux densities of those sources at the input positions (Eales et al., 2009, see Appendix B of ). These simulations allow us to apply appropriate first-order corrections and to estimate the uncertainties associated with those corrections (see later in §4.2). The corrections are statistical in nature and can be tailored to individual sources only in the sense that a source with a given SNR is likely to have been boosted by factor, , where ranges from 1.1–1.6 for the range of SNRs present in our sample. A full treatment of flux boosting in the BLAST data – including the influence of clustering and multi-band source selection – will be explored in future work.
2.2 Spitzer 70- and 160-m measurements
All of the raw FIDEL (P.I.: Dickinson), GO (P.I.: Frayer), and GTO (P.I.: Rieke) Spitzer data covering ECDFS were reduced and combined using the techniques developed by Frayer et al. (2006). We adopted the updated calibration factors, including corrections for colour and for the point-source-response function (PRF) given by Frayer et al. (2009).
The Spitzer flux density measurements are made at the positions discussed later and the quoted uncertainties represent the r.m.s. noise at those positions, combined with an additional 10 (15) per cent uncertainty at 70 m (160 m) due to possible systematics affecting the calibration factors.
2.3 LABOCA 870-m measurements
LESS covers around 900 arcmin2 of ECDFS at a wavelength of 870 m, with a beamwidth of 19.2 arcsec fwhm (Greve et al., 2009; Coppin et al., 2009; Weiss et al., 2009), to an average depth of mJy beam-1 as measured in a beam-smoothed map across the region in which our 250-m sample was selected. The 870-m flux densities, at the positions discussed later, are measured in the same manner discussed in §2.1 and 2.2.
2.4 VLA 1,400-MHz imaging
Deep, high-resolution 1,400-MHz imaging of the ECDFS was described by Miller et al. (2008) and we use their image to identify radio counterparts for our parent 250-m-selected source catalogue (see §3).
We use the techniques described by Ibar et al. (2009) to generate a new, deeper 1,400-MHz catalogue and to correct for effects such as flux boosting at low SNRs. This catalogue was cut at 4 , where was determined from the local background.
In cases where the emission is found to be heavily resolved, e.g. for the large spiral associated with BLAST J033235275530, we measure the total radio flux density using tvstat within .
2.5 GMRT 610-MHz imaging

To test the feasibility of deep radio observations in ECDFS, a small amount of new 610-MHz data were obtained using the GMRT22 2 We thank the staff of the GMRT who made these observations possible. GMRT is run by the National Centre for Radio Astrophysics of the Tata Institute of Fundamental Research. in 2008 November. During seven 9-hr sessions we obtained data centred on the six positions chosen by Miller et al. (2008) for their VLA survey (§2.4), recording 128 channels every 16 s in the lower and upper sidebands (602 and 618 MHz, respectively) in each of two polarisations. The integration time in each field was 3 hr, made up of 30-min scans sandwiched between 5-min scans of the nearby calibrator, 0240231, with 10-min scans of 3C 48 and 3C 147 for flux and bandpass calibration.
Calibration followed standard recipes within (31dec09). A bandpass table was generated after self-calibrating 3C 48 and 3C 147 in phase with a solution interval of 1 min. This was applied during subsequent loops of calibration and flagging (with uvflg, tvflg, spflg and flgit). The error-weighted flux densities of 0240231 were found to be and Jy at 602 and 618 MHz, respectively; the r.m.s. scatter of the flux density measurements over the seven days was 0.12 and 0.10 Jy which suggests that the flux calibration should be accurate to better than 5 per cent.
The calibrated data were averaged down to yield 41 channels in each sideband and the data from the seven days were concatenated using dbcon. The resulting datasets were then self-calibrated in phase (solmode=p!a), with a solution interval of 2 min, using clean components from our own reduction of the VLA A-configuation data. This process yielded accurate phases; the astrometric reference frame was also tied to that of the 1,400-MHz image as a result. Subsequent imaging entailed the creation of a mosaic of 37 facets – to cover most of the primary beam in each of the six pointings – each facet with 5122 pixels (1.52-arcsec2 per pixel). A further 10–20 bright sources outside these central regions, identified in heavily tapered maps, were also imaged for each pointing. Subsequent self-calibration was carried out in phase alone, then in amplitude and phase (first with cparm = 0, 1, 0 then with cparm = 0), with a solution interval of 2 min, staggered by 1 min. The data were weighted using robust = 0.5, uvrange = 0.9, 100 k, guard = 1, uvtaper = 30, 60 k and uvbox = 10.
After clean components were subtracted from the data, more manual flagging was undertaken. Almost one third of the baselines were rejected, in total. clean components were re-introduced (uvsub, factor=1), then the final six mosaics were convolved to a common beam size (6.5 arcsec 5.4 arcsec, with the major axis at position angle 174∘), then knitted together using flatn. An appropriate correction was made for the shape of the primary beam, with data rejected at radii beyond the half-maximum level. The final image has a noise level of 40 Jy beam-1 and covers the entire VLA image, with insignificant levels of bandwidth smearing. We exploit it here to determine the 610-MHz flux densities, and hence the spectral indices between 610 and 1,400 MHz, , of the radio identifications described in §3. These measurements are listed in Table 1. Our 610-MHz image is available on request33 3 E-mail: rji@roe.ac.uk.
| BLAST name | X-ray?‡ | Spec | Phot | |||||||||
|---|---|---|---|---|---|---|---|---|---|---|---|---|
| J2000 | J2000 | /mJy | J2000 | J2000 | /mJy | /Jy | /Jy | |||||
| J033235275530 | 03:32:35.09 | 27:55:31.0 | 176.8 10.9 | 03:32:35.07 | 27:55:32.6 | 4.7 | 680 34⋆ | 565 99 | 0.22 | Y | 0.038 | 0.051 |
| J033229274414 | 03:32:29.74 | 27:44:14.4 | 156.7 10.9 | 03:32:29.87 | 27:44:24.2 | 11.1 | 1,558 55⋆ | 1,670 84 | 0.08 | Y | 0.077 | 0.077 |
| J033250273421 | 03:32:50.01 | 27:34:21.3 | 159.3 11.1 | 03:32:50.41 | 27:34:20.3 | 2.9 | 470 20⋆ | 706 56 | 0.49 | N | 0.251 | 0.251 |
| J033128273916 | 03:31:28.71 | 27:39:16.1 | 105.3 11.1 | 03:31:28.82 | 27:39:16.7 | 0.46 | 34.8 7.5 | 0.80 | N | — | — | |
| J033249275842 | 03:32:49.47 | 27:58:42.0 | 101.2 11.0 | 03:32:49.34 | 27:58:44.7 | 0.32 | 216 16 | 296 49 | 0.38 | N | — | 2.215 |
| J033124275705 | 03:31:24.05 | 27:57:05.5 | 96.3 11.1 | 03:31:23.48 | 27:56:58.5 | 1.3 | 165 16 | 183 52 | 0.12 | N | — | 2.732 |
| J033152273931 | 03:31:52.82 | 27:39:31.5 | 93.4 11.0 | 03:31:52.07 | 27:39:26.6 | 0.20 | 965 16 | 765 52 | 0.28 | Y | — | 2.296 |
| J033258274322 | 03:32:58.24 | 27:43:22.3 | 92.6 11.1 | 03:32:59.20 | 27:43:25.1 | 0.53 | 148 17 | 205 43 | 0.39 | N | — | 1.160 |
| J033129275722 | 03:31:29.79 | 27:57:22.6 | 91.6 11.0 | 03:31:29.92 | 27:57:22.4 | 0.27 | 144 16 | 169 51 | 0.19 | N | — | 1.571 |
| J033319275423 | 03:33:19.37 | 27:54:23.2 | 90.7 10.9 | 03:33:18.89 | 27:54:33.8 | 0.37 | 60.2 15.0 | 0.80 | N | — | 0.488 | |
| J033246275744 | 03:32:46.05 | 27:57:44.0 | 90.0 10.9 | 03:32:45.88 | 27:57:44.8 | 2.7 | 337 17⋆ | 364 89 | 0.09 | Y | 0.103 | 0.105 |
| J033149274335 | 03:31:49.71 | 27:43:35.9 | 86.6 11.0 | 03:31:49.69 | 27:43:26.4 | 0.95 | 192 16 | 271 97 | 0.41 | N | 0.618 | 0.603 |
| J033217275905 | 03:32:17.07 | 27:59:05.8 | 85.3 11.0 | 03:32:16.99 | 27:59:16.0 | 0.37 | 178 17 | 395 45 | 0.96 | N | 0.126 | 0.220 |
| J033318274610 | 03:33:18.13 | 27:46:10.3 | 82.6 10.9 | 03:33:17.78 | 27:46:05.9 | 0.43 | 100 14 | 194 48 | 0.80 | N | — | 2.059 |
| J033216280345 | 03:32:16.08 | 28:03:45.0 | 82.1 11.0 | 03:32:15.90 | 28:03:47.1 | 0.77 | 192 20 | 268 49 | 0.40 | N | — | 0.452 |
| J033145274635 | 03:31:45.54 | 27:46:35.5 | 80.2 10.9 | 03:31:45.36 | 27:46:40.2 | 0.29 | 42.2 7.3 | 171 53 | 1.68 | N | — | — |
| J033308274805 | 03:33:08.56 | 27:48:05.9 | 79.7 10.8 | 03:33:09.72 | 27:48:01.3 | 0.20 | 433 19 | 496 45 | 0.16 | N | 0.180 | 0.190 |
| J033151274431 | 03:31:51.15 | 27:44:31.8 | 74.0 10.9 | 03:31:51.09 | 27:44:37.1 | 0.52 | 96.3 13 | 0.53 | Y | — | 1.911 | |
| J033130275604 | 03:31:30.07 | 27:56:04.5 | 74.0 10.9 | 03:31:30.05 | 27:56:02.2 | 0.90 | 1,270 64⋆ | 1,330 67 | 0.06 | Y | 0.677 | 0.727 |
| J033218275216 | 03:32:18.03 | 27:52:16.8 | 73.6 10.9 | 03:32:18.25 | 27:52:24.9 | 0.21 | 23.7 7.2 | 0.80 | N | 0.739 | 0.724 | |
| J033240280314 | 03:32:40.11 | 28:03:14.7 | 72.7 11.0 | 03:32:39.69 | 28:03:10.5 | 0.34 | 168 30⋆ | 707 180 | 1.73 | N | — | 0.956 |
| J033145274205 | 03:31:45.02 | 27:42:05.2 | 72.8 11.0 | 03:31:44.46 | 27:42:12.0 | 0.43 | 122 19 | 181 45 | 0.47 | N | — | 1.056 |
Notes: †Flux densities before deboosting (see §4.2); these uncertainties include only instrumental noise (§2.1) and should be added in quadrature with the confusion noise ( mJy – Marsden et al. 2009) to arrive at realistic SNRs; ⋆Total flux density, determined using tvstat. ‡24-m position coincident – within 2 arcsec – of a Chandra source (Lehmer et al., 2005; Luo et al., 2008). No further matches are made if the search radius is doubled.
3 Identifications
In order to avoid introducing a strong radio-related bias, and despite the problems caused by the high surface density of 24-m emitters (evident in Fig. 2), we use the 24-m counterpart identifications of Dye et al. (2009) for our parent sample. Where Dye et al. does not present an association, or where they favour a radio identification over a 24-m source, we adopt our own 24-m identifications based on the probabilistic approach outlined in the next section.
Before we discuss the 24-m identifications – and although we do not use them hereafter – we first describe the identification of radio counterparts to the parent FIR catalogue. Radio imaging remains the ‘gold standard’ for pinpointing submm and FIR galaxies because of the tight flux correlation and the low surface density of radio emitters relative to optical/IR sources, and relative to the large submm beam sizes. It is important, therefore, that we identify any impending problems facing deep FIR surveys with Herschel, particularly in the SPIRE bands (250–500 m) where Devlin et al. (2009) predict confusion limits only 1.5 lower than those suffered by BLAST.
3.1 Radio identifications

The positional uncertainty of a source found in a map is given by
| (1) |
for a situation where the counts obey a power law of the form (Ivison et al., 2007b). The SNR term here is determined optimally in a beam-smoothed map and includes any variance due to confusion. The signal is uncorrected for flux boosting and the positional offset is not radial but is instead measured in Right Ascension or Declination.
To associate radio emitters with the FIR sources in our sample, we utilise the technique of Downes et al. (1986), as implemented by Ivison et al. (2002) and by most FIR/submm identification work thereafter. According to Downes et al., is the probability of a random association and depends on the surface density of radio emitters and the radius within which one searches. The recent convention has been to accept associations as secure identifications where . We assume a slope of 1.5 for the radio counts in the relevant flux density regime (40–400 Jy) and fine-tune the absolute level of the counts with Monte Carlo simulations.
In choosing the search radius, we wish to maximise the number of secure, unambiguous identifications and to minimise the number of real counterparts missed. Fig. 3 illustrates how the total number of secure identifications and the integrated value of for those sources [hereafter ] varies with choice of search radius. equates directly to the expected number of spurious identifications in the sample. It is not intuitively obvious why there is a well-defined peak in when the total number of secure identifications is roughly constant with search radius: we see this because faint, real radio identifications compete (in terms of low ) with rare, bright sources – radio-loud AGN, entirely unrelated to the FIR source; as the search radius increases, correct identifications drop out of the integral (simply because their rises above 0.05); the resulting reduction in secure identifications is balanced by radio-loud AGN – contaminants; since they are very bright, their tends to zero as soon as they are within the search radius; thus drops gently while the number of apparently ‘secure’ identifications is maintained. Allowing a search radius well beyond that of the peak is therefore not advisable.
We express the search radius in terms of multiples of to maintain an appropriate dependence on the SNR of the source for which a counterpart is sought. Based on Fig. 3, we search within a radius of 3 , though values as low as 1.5 are defensible choices. This yields 12 statistically secure identifications with an expectation that 0.24 lie outside the search area (calculated via the cumulative Rayleigh distribution function).
At face value, the fraction of 250-m sources with secure radio identifications, 55 per cent, is similar to that found for SMGs (Smail et al., 2000; Ivison et al., 2002; Ivison et al., 2007b; Pope et al., 2006, e.g.), which are expected to have higher luminosities and higher redshifts (Chapman et al., 2005). However, close examination of Fig. 2, in which we have superimposed the radio and 250-m data on a 24-m greyscale image of each BLAST source, reveals that our ability to securely associate radio counterparts with FIR emitters has been compromised. Broadly speaking, the BLAST sources are associated with either large spirals or clumps of faint, radio and/or 24-m galaxies – sometimes several of the former or as many as seven of the latter (e.g. BLAST J033152273931). At least half of the FIR sources appear to be blends of two or more faint galaxies – each often with faint radio identifications – i.e. confusion is a major problem (Condon, 1974; Blain et al., 1998). This is compounded by the large number of radio sources found by chance in the required search area (a situation that worsens at 24 m, as mentioned earlier). Both issues are related to the relatively large size of the 250-m beam (and the situation is worse at 350 and 500 m).
As an alternative approach, we inspected the data shown in Fig. 2 by eye, rejecting seven sources with complicated 250-m morphologies suggestive of multiple, blended emitters. Of the remaining fifteen, nine have statistically secure radio identifications; of these, only three have unambiguous, single identifications. In total, therefore, only 14 per cent of our parent sample have secure, unambiguous radio identifications, based on this more subjective approach.
Thus, the purely statistical technique advocated previously for SMG identification work proves unhelpful – even misleading – in the confusion-dominated regime faced by BLAST and anticipated for the deepest survey work with Herschel (see Fig. 1 caption). Working through the Spitzer and Photodetector Array Camera and Spectrometer (Poglitsch et al., 2008, PACS –) bands to identify the dominant contributors to SPIRE flux densities may be more fruitful – but this has yet to be tested. This argues that a stacking approach may be the most enlightening – we turn to this later.
| Name | (obs) | Adopted | ||||||||
|---|---|---|---|---|---|---|---|---|---|---|
| /mJy | /mJy | /mJy | /mJy | /mJy | /mJy | /k | /10-15 W m-2 | /W Hz-1 | ||
| BLAST J033235275530 | 93.9 11.2 | 351.1 65.0 | 176.8 10.9 | 75.4 8.6 | 29.8 6.0 | 1.23 1.16 | 25.2 | 8.28 1.79 | 2.18 1021 | 0.038 |
| BLAST J033229274414 | 136.6 15.4 | 368.0 65.8 | 141.6 10.8 | 71.7 8.5 | 36.8 6.0 | 0.88 1.17 | 27.2 | 10.5 2.8 | 2.13 1022 | 0.077 |
| BLAST J033250273421 | 30.1 4.9 | 203.5 43.1 | 154.8 11.0 | 76.9 8.7 | 40.3 6.0 | 1.82 1.22 | 21.5 | 4.22 1.24 | 8.45 1022 | 0.251 |
| BLAST J033128273916 | 7.1 1.9 | 88.5 25.2 | 105.3 11.1 | 69.6 8.7 | 39.8 6.3 | 4.02 1.18 | 18.1 | — | — | — |
| BLAST J033249275842 | 8.4 2.1 | 72.6 21.7 | 101.2 10.9 | 66.4 8.6 | 22.6 6.0 | 1.75 1.13 | 19.3 | 1.28 0.63 | 6.38 1024 | 2.215 |
| BLAST J033124275705 | 8.7 2.3 | 100.7 30.1 | 83.2 11.1 | 47.2 8.7 | 33.3 6.2 | 2.99 1.20 | 19.0 | 1.40 0.70 | 7.07 1024 | 2.732 |
| BLAST J033152273931 | 3.0 1.4 | 31.9 14.4 | 78.3 11.0 | 64.3 8.6 | 53.1 6.0 | 3.49 1.14 | 15.9 | 0.77 0.42 | 2.35 1025 | 2.296 |
| BLAST J033258274322 | 7.4 2.0 | 82.8 24.8 | 71.5 11.1 | 53.6 8.7 | 34.3 6.0 | 4.31 1.17 | 18.3 | 1.21 0.61 | 9.48 1023 | 1.160 |
| BLAST J033129275722 | 3.6 1.7 | 49.0 19.9 | 91.6 11.0 | 54.4 8.7 | 46.3 6.2 | 5.11 1.14 | 16.1 | 0.93 0.49 | 1.78 1024 | 1.571 |
| BLAST J033319275423 | 3.9 1.4 | 36.0 14.9 | 84.2 11.0 | 20.4 8.5 | 13.2 5.9 | 1.12 1.13 | 18.8 | 0.71 0.41 | 5.24 1022 | 0.488 |
| BLAST J033246275744 | 46.0 6.0 | 147.9 32.9 | 90.0 10.9 | 46.7 8.5 | 18.7 5.9 | 1.30 1.14 | 24.3 | 3.03 1.34 | 8.49 1021 | 0.103 |
| BLAST J033149274335 | 15.7 2.8 | 100.5 24.3 | 81.5 11.0 | 46.6 8.6 | 30.9 5.9 | 2.46 1.16 | 20.7 | 1.51 0.79 | 2.75 1023 | 0.618 |
| BLAST J033217275905 | 39.5 5.9 | 110.4 30.4 | 80.5 11.0 | 63.6 8.5 | 30.4 6.0 | 1.62 1.14 | 23.9 | 2.00 1.04 | 7.17 1021 | 0.126 |
| BLAST J033318274610 | 5.6 1.7 | 62.3 20.8 | 79.9 10.8 | 72.5 8.6 | 51.4 5.9 | 3.84 1.13 | 17.7 | 1.00 0.56 | 2.94 1024 | 2.059 |
| BLAST J033216280345 | 16.0 3.2 | 85.7 24.5 | 82.1 11.0 | 39.2 8.5 | 0.3 6.0 | 2.04 1.30 | 21.2 | 1.31 0.70 | 1.31 1023 | 0.452 |
| BLAST J033145274635 | 0.3 1.0 | 12.0 10.4 | 75.2 10.8 | 11.0 8.5 | 12.8 5.9 | 0.30 1.14 | 15.2 | — | — | — |
| BLAST J033308274805 | 53.0 6.6 | 97.9 26.6 | 66.1 10.8 | 37.0 8.5 | 31.7 5.9 | 2.02 1.16 | 25.9 | 1.99 1.04 | 3.65 1022 | 0.180 |
| BLAST J033151274431 | 6.0 1.7 | 77.5 20.2 | 74.0 10.8 | 63.8 8.5 | 37.4 5.9 | 4.18 1.16 | 17.9 | 1.05 0.61 | 2.13 1024 | 1.911 |
| BLAST J033130275604 | 28.5 4.1 | 83.2 24.7 | 74.0 10.8 | 20.9 8.5 | 44.9 6.0 | 3.05 1.15 | 23.0 | 1.61 0.91 | 2.10 1024 | 0.677 |
| BLAST J033218275216 | 5.3 1.4 | 54.2 17.8 | 71.4 10.8 | 52.6 8.5 | 46.8 5.9 | 7.74 1.17 | 16.1 | 0.88 0.52 | 5.63 1022 | 0.739 |
| BLAST J033240280314 | 6.8 2.0 | 50.7 18.6 | 72.7 11.0 | 61.8 8.5 | 30.6 6.1 | 4.05 1.25 | 18.2 | 0.90 0.54 | 9.53 1023 | 0.956 |
| BLAST J033145274205 | 4.8 1.6 | 45.0 17.2 | 56.0 11.0 | 27.0 8.7 | 28.4 6.2 | 1.98 1.14 | 18.8 | 0.70 0.45 | 6.38 1023 | 1.056 |
3.2 24-m identifications
Using a different probabilistic approach to our own, Dye et al. (2009) listed the most likely 24-m counterparts for many of our 250-m-selected galaxies. To their list, we added BLAST J033229274414, an obvious blend of two galaxies at (Fig. 2), and in a further six cases where Dye et al. listed no association we added the most likely of our own 24-m identifications. We list the 24-m positions in Table 1, together with the radio properties at those positions. The FIR and submm properties at the 24-m positions are given in Table 2.
As already noted, we adopt these 24-m counterparts to avoid introducing a strong radio-related bias, and despite the problems caused by the high surface density of 24-m emitters, exacerbated by FIR confusion.


4 Results
4.1 Redshift distribution
Of the most likely 24-m counterparts for our 250-m sample, eight have spectroscopic redshifts (Croom et al., 2001; Le Fèvre et al., 2004; Szokoly et al., 2004; Vanzella et al., 2008; Eales et al., 2009, see) and another 11 have photometric redshifts (Rafferty et al., 2009, in preparation). For every spectroscopic case, both types of estimate are available, and these agree reasonably well (, with one outlier). We were unable to assign redshifts with confidence in two cases (see Tables 1 and 2).
The redshift distribution of 24-m-identified, 250-m-selected sources is shown in Fig. 4. The median is = 0.74 with an interquartile range of = 0.25–1.57, so slightly beyond the 70-m-selected sample of Symeonidis et al. (2009) which had a median of 0.42. Inset in the same plot is a histogram of . This ratio should increase with redshift as the SED peak shifts to longer wavelengths and we find a strong tendency for those above the median redshift to have higher ratios.
4.2 Far-infrared SEDs
Flux boosting of nearly the same magnitude as that experienced in the BLAST wavebands (§2.1) also influences our Spitzer measurements and, to a lesser extent, those made using LABOCA. We therefore apply deboosting factors appropriate for the BLAST 250-m sources – appropriate to the level of precision required (Eales et al., 2009) – to , which we define to be the flux observed between rest-frame 8 and 1,000 m. The large uncertainty in the deboosting factor is propagated in quadrature with other uncertainties. could be determined via modified blackbody fits to the 70-, 160-, 250-, 350-, 500- and 870-m flux measurements with fixed to 1.5 (for example). However, with such well-sampled SEDs at our disposal, we concluded that is better determined by interpolating between the measured flux densities at 24–870 m, and extrapolating outside the data range to rest-frame 8 and 1,000 m with spectral indices of (appropriate for an M 82-like SED) and , respectively, then deboosting according to the recipe in Eales et al. (2009). These are the values listed in Table 2. Fig. 5 shows the deboosted IR luminosity as a function of redshift for our sample.
We do use modified blackbody fits to estimate the effective dust temperature, , and these are also presented in Table 2. We note that several dust components with a range of temperatures would be required to replicate the SEDs accurately over the full wavelength range. The average observed-frame is 20.5 3.5 k. Fig. 6 shows the relationship between rest-frame and . We expect and see a strong correlation, following the work by Dunne et al. (2000) and Chapman et al. (2005): at 250 m we are sensitive to a particular observed temperature regime; rest-frame is higher (by a factor 1 + ) than observed , so for more distant detected sources we expect hotter dust. scales with a high power of , yielding the strong correlation evident in Fig. 6.
4.3 The FIR/radio correlation
We have explored trends in the FIR/radio correlation, both the monochromatic version, e.g., as defined by Appleton et al. (2004) – where -correcting both and requires assumptions about SED shape if a significant range of redshift is present – and the correlation between bolometric and -corrected radio flux density, where both quantities are well constrained.
We adopt a standard routine so that we can compare like with like. First, we exclude a radio-loud AGN, identified on the basis of its radio morphology (BLAST J033130275604). We do not exclude the X-ray emitters (see Table 1). Next, we calculate the error-weighted mean and standard deviation of the relevant parameter, noting points that deviate from the mean by more than 3 (these being ‘radio-excess AGN’ candidates, as described by Donley et al. 2005). The resultant statistics (and notes) are reported in Table 3.
4.3.1 Monochromatic correlations
The monochromatic relationship between and , = is shown in Fig. 7 as a function of redshift, and the resultant statistics are reported in Table 3. Also shown as a grey box in Fig. 7 is the range of measured for the 57 members of the Spitzer IR Nearby Galaxies Survey (SINGS) sample which are detected at both 160 m and 1,400 MHz (Dale et al., 2007). At , where the BLAST 250-m filter samples rest-frame 160-m emission, values of and are entirely compatible with the SINGS average, with or without the small radio correction. We interpret this as evidence for a low rate of evolution, at least out to .


| Type | Mean | Standard | correction(s) |
| of | deviation | or stacking parameters | |
| 250-m-selected galaxy sample: | |||
| 2.26 | 0.35 | None | |
| 1.85⋆ | 0.43 | M 82 SED, | |
| 1.82⋆ | 0.43 | Arp 220 SED, | |
| 2.08 | 0.34 | Fig. 9 SED, | |
| 1.94 | 0.34 | M 82 SED, measured | |
| 1.91 | 0.34 | Arp 220 SED, measured | |
| 2.18 | 0.28 | Fig. 9 SED, measured | |
| 2.40 | 0.29 | None | |
| 2.37 | 0.31 | ||
| 2.41 | 0.20 | Measured | |
| SINGS sample (Dale et al., 2007): | |||
| 2.68 | 0.41 | None | |
| Stacking on 24-m-selected galaxies: | |||
| 2.70 | 0.08 | None | |
| 2.00 | 0.37 | M 82 SED, measured | |
| 2.31 | 0.18 | Fig. 9 SED, measured | |
| 2.89 | 0.06 | None | |
| 2.67 | 0.17 | Measured | |
| Stacking on radio-selected galaxies (no correction): | |||
| 2.05 | 0.34 | Measured | |
| 2.42 | – | Jy [507] | |
| 2.17 | – | Jy [224] | |
| 1.81 | – | Jy [69] | |
| 1.56 | – | Jy [16] | |
| 1.96 | 0.34 | Measured | |
| 2.25 | – | Jy [507] | |
| 2.11 | – | Jy [224] | |
| 1.87 | – | Jy [69] | |
| 1.29 | – | Jy [16] | |
† With M 82-like power-law SED () shortward of the peak;
⋆ One radio-excess AGN present.
4.3.2 -corrected monochromatic correlations
Next, we looked at the effect of ‘ correcting’ the monochromatic relationship between 250-m and 1,400-MHz flux densities, where is the function that transforms a quantity observed at some frequency into an equivalent measurement in the rest frame of the source being observed. Taking the simple case of a power-law SED, where and are the -corrected luminosity density and observed flux density, respectively, and is the luminosity distance (in m),
| (2) |
where the term takes care of the extra width of the differential frequency element in the observed frame. Now imagine we are working on a sample of galaxies at 1,400 MHz: the factor converts – radiation emitted at 2,800 MHz and seen at 1,400 MHz – into , the 1,400-MHz flux density in the rest frame of the emitter. Using the definitions of and spectral index, , i.e. and , we find that , so
| (3) |
For the radio spectrum we use the measured slope between 610 and 1,400 MHz, adopting where this is consistent with the 610-MHz upper limit, or where no measurement is available. This results in a median of 0.4. In the FIR waveband, we explored two options. One is to adopt the observed SED of M 82, which Ibar et al. (2008) found gave the least scatter in . corrections44 4 Our idl-based -correction code, together with SED templates and filter profiles, are available on request. appropriate for an M 82 SED template in the Spitzer, BLAST and LABOCA wavebands, calculated using accurate filter transmission profiles, are shown in Fig. 8. We also tried the SED of Arp 220 and an SED built from those 250-m-selected galaxies with secure identifications and redshifts, normalised at 250 m using the technique of Pope et al. (2006) – see Fig. 9. The latter SED made an appreciable difference to the absolute value of and resulted in less scatter. Relevant statistics for under each set of assumptions are reported in Table 3.


4.3.3 -corrected bolometric correlations
Moving from the monochromatic correlation to bolometric quantities, where a correction is required only in the radio waveband. Helou et al. (1985) defined such that
| (4) |
where they defined as the flux between 42.5 and 122.5 m and is the frequency at their mid-band, 80 m. Working at 42.5–122.5 m would exploit only one tenth of the wavelength coverage now at our disposal so, although we adopt this definition, we use – the flux between rest-frame 8 and 1,000 m – instead of .
4.4 Assessing redshift evolution of the FIR/radio correlation by stacking
Marsden et al. (2009), Pascale et al. (2009) and Patanchon et al. (2009) have demonstrated the power of stacking analyses based on confusion-limited maps and the very steep BLAST source counts. We have applied those same techniques to study the evolution of and by stacking at the positions of the thousands of mid-IR-selected galaxies with photometric redshifts in ECDFS. We thus eliminate the biases introduced by starting from a flux-boosted and confused FIR-selected sample and the problems of demanding secure identifications in a densely populated 24-m image. Since Marsden et al. (2009) has shown that the BLAST catalogue only comprises 10 per cent of the total flux in the maps, stacking, which uses all of the pixels, has the potential to greatly increase the sensitivity of the analysis.
However, some new problems are introduced. We have to worry about selection effects due to the catalogue of positions upon which we stack – in this case a 24-m-selected sample, with flux densities determined using IRAC positions as priors (Magnelli et al., 2009), with the redshift distribution shown in Fig. 4 and with a non-trivial correction (see Fig. 8). §5 of Pascale et al. (2009) provides a practical demonstration of the paradigm described by Marsden et al. (2009) and shows that our fundamental approach to stacking is accurate to the level of precision required here.


Median-stacking in the radio regime should reduce the consequences of radio-loud AGN becoming more prevalent at high redshift (Dunlop & Peacock, 1990). Stacking should, therefore, allow us to probe the evolution of for galaxies more representative of the general population than is possible for a sample requiring both FIR and radio detections, modulo 24-m selection biases.
We adopt the technique of Ivison et al. (2007a), dividing the Magnelli et al. catalogue into six redshift bins, evenly spaced in log between = 0 and 3, containing 561, 1,441, 2,205, 1,823, 1,900 and 372 galaxies, respectively. Error-weighted mean postage-stamp images are obtained in all the FIR filters, allowing us to assess the level of any background emission. Median images are made from the VLA and GMRT stacks, to reduce the influence of radio-loud AGN. In the radio regime, where the spatial resolution is relatively high, making images allows us to conserve flux density that would otherwise be lost due to smearing by astrometric uncertainties and finite bandwidth (chromatic aberration) at the cost of larger flux density uncertainties. Total flux densities are measured using Gaussian fits within ; we determine the appropriate source centroid and width by making radio stacks using every available 24-m source (SNR 50), then fix these parameters to minimise flux density uncertainties and avoid spurious fits; at 1,400 MHz, where both forms of smearing are most prevalent, flux densities were 2 higher than the peak values. Such losses are not expected where the astrometry is accurate to a small fraction of a beam, as it is at 70–870 m.
The top and middle panels of Fig. 11 show the evolution with redshift of the overall SED and the median radio spectral index, , for the Magnelli et al. (2009) sample. We see that the rest-frame 8–100-m portion of the SED becomes progressively more important – in terms of its relative contribution to – as we move to higher redshifts, despite the 870-m flux density increasing slightly with redshift (Blain & Longair, 1993, as expected –). We find no evidence of significant deviations from the error-weighted mean spectral index, , nor of a significant trend in across . A weighted least-squares fit yields .
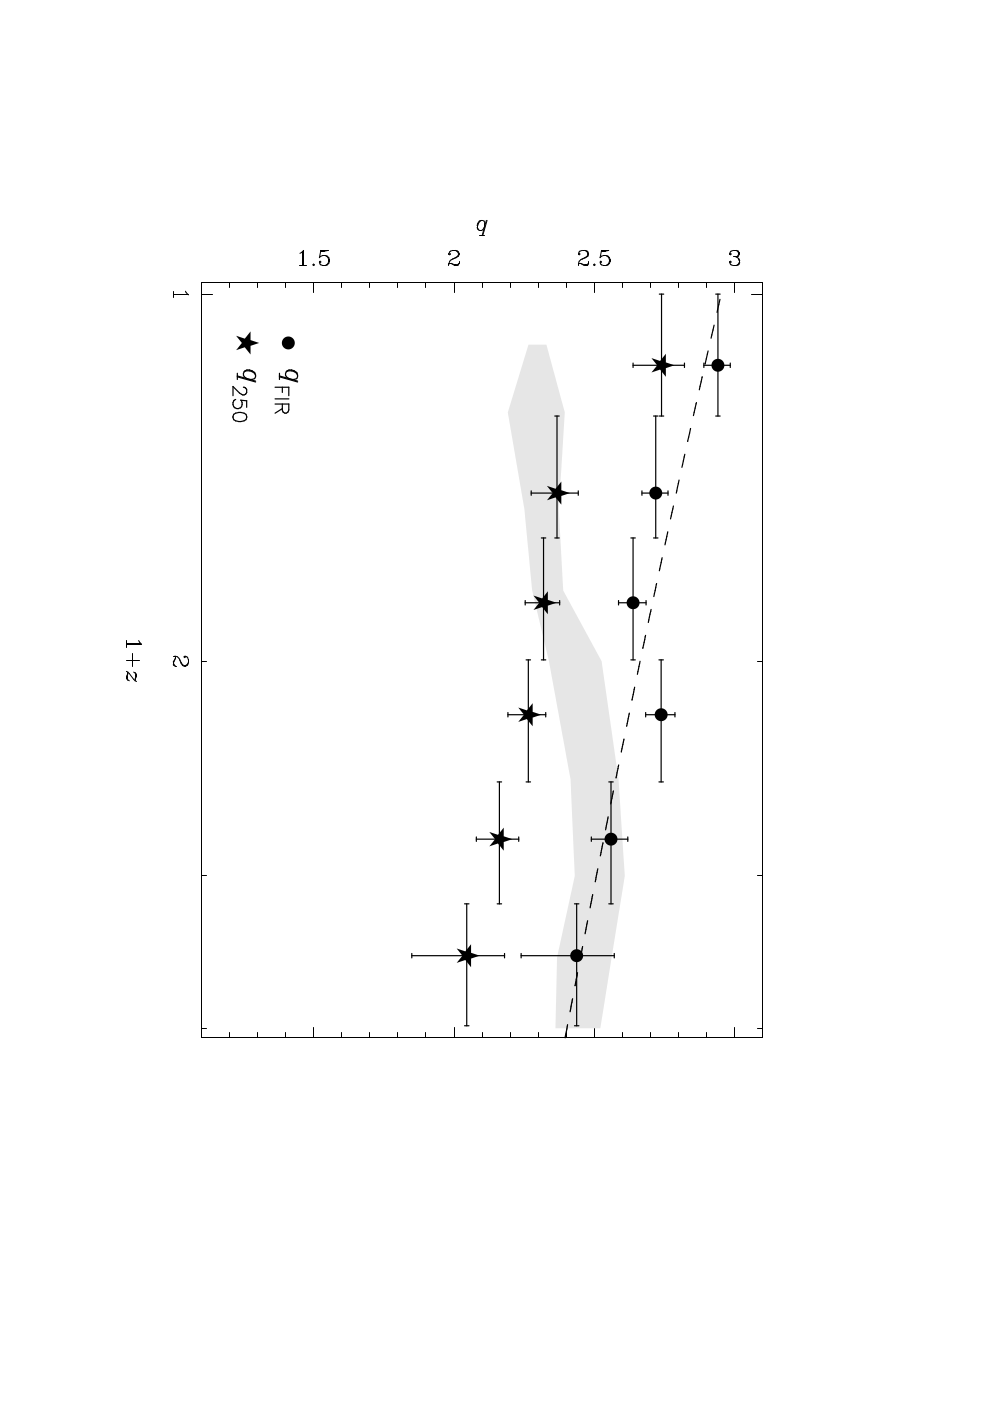
The lower panel of Fig. 11 shows the evolution with redshift of and , the former -corrected using the SED template described in §4.3 and shown in Fig. 9, both -corrected using measured radio spectra. Mean values of both and lie within 1 of the mean values found for our 250-m-selected galaxies (Table 3). We find, however, that evolves with redshift, even across where incompleteness should not be a major issue in our 24-m sample. A weighted least-squares fit suggests . is also found to evolve, though the form of the evolution is strongly dependent on the choice of SED adopted for correction, i.e. on the shape of the template SED shortward of 200 m, emphasising the importance of good spectral coverage. The evolution is even stronger for M 82 and Arp 220 SEDs. The different behaviour with respect to redshift seen in Figs 10 and 11 is presumably due to selection biases: the lack of evolution seen in Fig. 10 reflects the FIR sample selection employed there; the evolution seen in Fig. 11 reflects the IR and radio characteristics of the increasingly luminous 24-m emitters upon which we are stacking at progressively higher redshifts.
The use of median radio images should exclude radio-loud AGN at least as effectively as the 3- clip employed in §4.3, so the influence of the anticipated evolution (with redshift) of radio-loud AGN on the stacked values of should be minimised. Using means instead, which we view as an inferior approach, the average spectral index, , falls to as would be expected if steep-spectrum AGN contaminate the stacks. This, together with the 3 higher mean radio flux densities, shifts by , although the form of the redshift evolution remains similar, with .
Responding to reports that the radio background is significantly brighter than the cumulative intensity seen in discrete radio emitters (Fixsen et al., 2009; Seiffert et al., 2009), Singal et al. (2009) have speculated that we should see the FIR/radio correlation evolve, driven by 0.01–10-Jy radio activity amongst ordinary star-forming galaxies. Since this is the flux density regime we are probing with our stacking analysis, one might hope to catch a glimpse of such evolution. Indeed, the basic form of the evolution we see in is consistent with the idea of Singal et al., and our spectral index is consistent with that of the radio background (, Fixsen et al. 2009).
Swinbank et al. (2008) used the galform semi-analytical galaxy-formation model to predict mild evolution of for luminous starbursts due to the 5-Myr timelag between the onset of star formation and the resulting supernovae, in keeping with the mild evolution claimed by Kovács et al. (2006) on the basis of 350-m observations of 15 SMGs. Kovács et al. suggested that a change of the radio spectral index might account for the deviation in . Revisiting the galform work of Swinbank et al. (2008) – calculating and for galaxies with L⊙ in a manner consistent with this work – results in evolution of the form shown by the shaded area in Fig. 11 (lower panel), i.e. the evolution progresses in the opposite sense to that seen, with quantitative agreement only in the regime.
The evolution seen here has implications for all the areas that rely on the FIR/radio correlation, e.g. the median redshift of SMGs determined via the oft-used flux density ratio would be lower. It will be interesting to discover whether the evolution we report is confirmed by Herschel in the deepest multi-frequency radio fields (Owen & Morrison, 2008, e.g.).
Taking the average properties of the 24-m- and 250-m-selected samples to be representative, so = , we can suggest a simple transformation between radio flux density and SFR, appropriate for samples in which radio-loud AGN constitute only a small fraction: a radio flux density of () can be converted into a bolometric IR flux (rest-frame 8–1,000 m in W m-2) via:
| (5) |
and thence into a star-formation rate (SFR) via:
| (6) |
where is 1.7 for a Salpeter IMF () covering 0.1–100 M⊙ (Condon, 1992; Kennicutt, 1998a; Kennicutt, 1998b, see also Scoville & Young 1983; Thronson & Telesco 1986; Inoue et al. 2000).


4.5 Stacking at the positions of sub-mJy radio galaxies
The value of found in the previous section is weighted by the types of galaxies found in the 24-m catalogue. To investigate whether is different for a radio-selected population, we stack the FIR/submm images at the positions of 816 robust radio emitters (5 , Jy), divided into seven flux density bins, spaced evenly in log.
The FIR SEDs of the radio-selected galaxies are qualitatively similar to those of low-redshift 24-m-selected galaxies (compare the top panels of Figs 11 and 12). We find that and are lower for radio-selected galaxies than for those selected in the mid-IR or FIR wavebands (Table 3), as one might expect given the selection criterion. However, the difference is surprisingly small: for Jy we obtain = 2.42 and = 2.25, cf. the equivalent (pre--correction) values for our FIR-selected galaxy sample, = and = . Bear in mind that, at a redshift of unity, would rise by 0.06 due to the radio correction and fall by 0.15 due to the shift of = 8–1000 m to lower observed frequencies – an overall shift of . This suggests that star formation plays a significant role in powering faint radio galaxies, providing over half of their IR luminosity. Radio selection will inevitably have favoured galaxies with recently injected relativistic electrons so this is likely to be a lower limit. We find that and anti-correlate with radio flux density (Fig. 12, lower panel) and we suggest this is due to the increasing prevalence of radio-loud AGN as one moves into the mJy regime (Ibar et al., 2009, e.g.).
5 Conclusions
We have defined a sample of 250-m-selected galaxies using data from BLAST. The noise is dominated by confusion, which severely limits the number of robust detections and hampers the identification of secure, unambiguous mid-IR or radio counterparts. These problems were not always apparent when using an objective, probabilistic approach to cross-identifying the galaxies.
We find that the most likely 24-m counterparts to our small sample of 250-m galaxies have a median [interquartile] redshift of 0.74 [0.25, 1.57].
At , where the BLAST 250-m filter probes rest-frame 160-m emission, we find no evidence for evolution of relative to measured for the SINGS sample of local galaxies.
We find that is better correlated with radio flux density than , and that -correcting the radio luminosity using measured spectral slopes reduces the scatter in the correlation.
– the logarithmic ratio of bolometric IR and monochromatic radio fluxes – is determined for FIR-, mid-IR and radio-selected galaxies. We provide a simple recipe to convert a radio flux density into an instantaneous SFR, via bolometric IR luminosity, for mid-IR- or FIR-selected samples that do not contain a large fraction of radio-loud AGN.
is found to be similar for our 250-m- and radio-selected galaxies, which suggests that star formation is responsible for over half of the IR luminosity in the latter, especially the faintest radio galaxies (Jy). This fraction could well be higher given that radio selection favours galaxies with recent injections of relativistic electrons.
Stacking into 610- and 1,400-MHz images at the positions of 24-m-selected galaxies, we find no evidence that the spectral slope at radio wavelengths evolves significantly across . However, we find tentative evidence that does evolve, even across where incompleteness in the parent sample should not be a serious issue. The evolution is of the form, , across the peak epoch of galaxy formation. This has major implications for many techniques that rely on the FIR/radio correlation. We compare with semi-analytical model predictions and speculate that we may be seeing an increase in radio activity amongst ordinary, star-forming galaxies – relative to their IR emission – amongst that has been suggested may give rise to the radio background (Fixsen et al., 2009; Singal et al., 2009).
It will remain difficult to associate galaxies detected in Herschel/SPIRE surveys unambiguously with IR or radio counterparts, since the modest increase in telescope aperture and the steep source counts will ensure that confusion remains an issue (Devlin et al., 2009). However, alongside 70-, 100- and 160-m imaging from Herschel/PACS and 450- and 850-m SCUBA-2 data from the 15-m James Clerk Maxwell Telescope, it should be possible to fine-tune the astrometry to arcsec and to deblend sources in deep SPIRE images. For the 1–2 deg2 of FIR/submm coverage planned for the fields with the deepest available radio and Spitzer data, e.g. GOODS, the Subaru/XMM-Newton Deep Survey and the Lockman Hole, with Jy beam-1 and Jy (Biggs & Ivison 2006; Owen & Morrison 2008; Miller et al. 2008; Morrison et al., in preparation; Arumugam et al., in preparation), almost every deblended FIR source should have relatively secure 24-m and radio identifications, the majority unambiguous, providing a complete redshift distribution and less biased estimates of for FIR-selected galaxies.
Acknowledgements
We thank John Peacock for his patient and good-natured assistance. We acknowledge the support of the UK Science and Technology Facilities Council (STFC), NASA through grant numbers NAG5-12785, NAG5-13301, and NNGO-6GI11G, the NSF Office of Polar Programs, the Canadian Space Agency, and the Natural Sciences and Engineering Research Council (NSERC) of Canada.
References
- Appleton et al. (2004) Appleton P. N. et al., 2004, ApJS, 154, 147
- Barger et al. (1998) Barger A. J., Cowie L. L., Sanders D. B., Fulton E., Taniguchi Y., Sato Y., Kawara K., Okuda H., 1998, Nature, 394, 248
- Bell (2003) Bell E. F., 2003, ApJ, 586, 794
- Bernet et al. (2008) Bernet M. L., Miniati F., Lilly S. J., Kronberg P. P., Dessauges-Zavadsky M., 2008, Nature, 454, 302
- Biggs et al. (2009) Biggs A. D. et al., 2009, MNRAS, in preparation
- Biggs & Ivison (2006) Biggs A. D., Ivison R. J., 2006, MNRAS, 371, 963
- Blain et al. (1998) Blain A. W., Ivison R. J., Smail I., 1998, MNRAS, 296, L29
- Blain & Longair (1993) Blain A. W., Longair M. S., 1993, MNRAS, 264, 509
- Carilli & Yun (1999) Carilli C. L., Yun M. S., 1999, ApJ, 513, L13
- Chapman et al. (2005) Chapman S. C., Blain A. W., Smail I., Ivison R. J., 2005, ApJ, 622, 772
- Condon (1974) Condon J. J., 1974, ApJ, 188, 279
- Condon (1992) Condon J. J., 1992, ARA&A, 30, 575
- Coppin et al. (2009) Coppin K. E. K. et al., 2009, MNRAS, 395, 1905
- Croom et al. (2001) Croom S. M., Warren S. J., Glazebrook K., 2001, MNRAS, 328, 150
- Dale et al. (2007) Dale D. A. et al., 2007, ApJ, 655, 863
- de Jong et al. (1985) de Jong T., Klein U., Wielebinski R., Wunderlich E., 1985, A&A, 147, L6
- Desai et al. (2007) Desai V. et al., 2007, ApJ, 669, 810
- Devlin et al. (2009) Devlin M. J. et al., 2009, Nature, 458, 737
- Dickey & Salpeter (1984) Dickey J. M., Salpeter E. E., 1984, ApJ, 284, 461
- Dickinson et al. (2003) Dickinson M., Giavalisco M., The Goods Team , 2003, in Bender R., Renzini A., eds, The Mass of Galaxies at Low and High Redshift, p. 324
- Donley et al. (2005) Donley J. L., Rieke G. H., Rigby J. R., Pérez-González P. G., 2005, ApJ, 634, 169
- Downes et al. (1986) Downes A. J. B., Peacock J. A., Savage A., Carrie D. R., 1986, MNRAS, 218, 31
- Dunlop & Peacock (1990) Dunlop J. S., Peacock J. A., 1990, MNRAS, 247, 19
- Dunne et al. (2000) Dunne L., Eales S., Edmunds M., Ivison R., Alexander P., Clements D. L., 2000, MNRAS, 315, 115
- Dunne et al. (2009a) Dunne L. et al., 2009a, MNRAS, 394, 3
- Dunne et al. (2009b) Dunne L. et al., 2009b, MNRAS, 394, 1307
- Dye et al. (2009) Dye S. et al., 2009, ArXiv e-prints
- Eales et al. (2009) Eales S. et al., 2009, ArXiv e-prints
- Fixsen et al. (1998) Fixsen D. J., Dwek E., Mather J. C., Bennett C. L., Shafer R. A., 1998, ApJ, 508, 123
- Fixsen et al. (2009) Fixsen D. J. et al., 2009, ArXiv e-prints
- Frayer et al. (2006) Frayer D. T. et al., 2006, ApJ, 647, L9
- Frayer et al. (2009) Frayer D. T. et al., 2009, ArXiv e-prints
- Greve et al. (2009) Greve T. R. et al., 2009, ArXiv e-prints
- Griffin et al. (2009) Griffin M. et al., 2009, in EAS Publications Series, Vol. 34, Pagani L., Gerin M., eds, EAS Publications Series, p. 33
- Helou et al. (1985) Helou G., Soifer B. T., Rowan-Robinson M., 1985, ApJ, 298, L7
- Hughes et al. (1998) Hughes D. H. et al., 1998, Nature, 394, 241
- Ibar et al. (2008) Ibar E. et al., 2008, MNRAS, 386, 953
- Ibar et al. (2009) Ibar E., Ivison R. J., Biggs A. D., Lal D. V., Best P. N., Green D. A., 2009, MNRAS, 397, 281
- Inoue et al. (2000) Inoue A. K., Hirashita H., Kamaya H., 2000, PASJ, 52, 539
- Ivison et al. (2007a) Ivison R. J. et al., 2007a, ApJ, 660, L77
- Ivison et al. (2007b) Ivison R. J. et al., 2007b, MNRAS, 380, 199
- Ivison et al. (2002) Ivison R. J. et al., 2002, MNRAS, 337, 1
- Kennicutt (1998a) Kennicutt R. C., Jr., 1998a, ARA&A, 36, 189
- Kennicutt (1998b) Kennicutt R. C., Jr., 1998b, ApJ, 498, 541
- Kovács et al. (2006) Kovács A., Chapman S. C., Dowell C. D., Blain A. W., Ivison R. J., Smail I., Phillips T. G., 2006, ApJ, 650, 592
- Lacey et al. (2008) Lacey C. G., Baugh C. M., Frenk C. S., Silva L., Granato G. L., Bressan A., 2008, MNRAS, 385, 1155
- Le Fèvre et al. (2004) Le Fèvre O. et al., 2004, A&A, 428, 1043
- Lehmer et al. (2005) Lehmer B. D. et al., 2005, ApJS, 161, 21
- Luo et al. (2008) Luo B. et al., 2008, ApJS, 179, 19
- Magnelli et al. (2009) Magnelli B., Elbaz D., Chary R. R., Dickinson M., Le Borgne D., Frayer D. T., Willmer C. N. A., 2009, A&A, 496, 57
- Marsden et al. (2009) Marsden G. et al., 2009, ArXiv e-prints
- Miller et al. (2008) Miller N. A., Fomalont E. B., Kellermann K. I., Mainieri V., Norman C., Padovani P., Rosati P., Tozzi P., 2008, ApJS, 179, 114
- Owen & Morrison (2008) Owen F. N., Morrison G. E., 2008, AJ, 136, 1889
- Pascale et al. (2009) Pascale E. et al., 2009, ArXiv e-prints
- Patanchon et al. (2009) Patanchon G. et al., 2009, ArXiv e-prints
- Poglitsch et al. (2008) Poglitsch A. et al., 2008, in Society of Photo-Optical Instrumentation Engineers (SPIE) Conference Series, Vol. 7010, Society of Photo-Optical Instrumentation Engineers (SPIE) Conference Series
- Pope et al. (2006) Pope A. et al., 2006, MNRAS, 370, 1185
- Puget et al. (1996) Puget J.-L., Abergel A., Bernard J.-P., Boulanger F., Burton W. B., Desert F.-X., Hartmann D., 1996, A&A, 308, L5
- Rafferty et al. (2009) Rafferty D. A. et al., 2009, ApJ, in preparation
- Rengarajan (2005) Rengarajan T. N., 2005, ArXiv Astrophysics e-prints
- Scoville & Young (1983) Scoville N., Young J. S., 1983, ApJ, 265, 148
- Seiffert et al. (2009) Seiffert M. et al., 2009, ArXiv e-prints
- Silva et al. (1998) Silva L., Granato G. L., Bressan A., Danese L., 1998, ApJ, 509, 103
- Singal et al. (2009) Singal J., Stawarz L., Lawrence A., Petrosian V., 2009, ArXiv e-prints
- Smail et al. (1997) Smail I., Ivison R. J., Blain A. W., 1997, ApJ, 490, L5
- Smail et al. (2000) Smail I., Ivison R. J., Owen F. N., Blain A. W., Kneib J.-P., 2000, ApJ, 528, 612
- Spergel et al. (2007) Spergel D. N. et al., 2007, ApJS, 170, 377
- Swinbank et al. (2008) Swinbank A. M. et al., 2008, MNRAS, 391, 420
- Symeonidis et al. (2009) Symeonidis M., Page M. J., Seymour N., Dwelly T., Coppin K., McHardy I., Rieke G. H., Huynh M., 2009, MNRAS, 397, 1728
- Szokoly et al. (2004) Szokoly G. P. et al., 2004, ApJS, 155, 271
- Thronson & Telesco (1986) Thronson H. A., Jr., Telesco C. M., 1986, ApJ, 311, 98
- Truch et al. (2009) Truch M. D. P. et al., 2009, ArXiv e-prints
- van der Kruit (1971) van der Kruit P. C., 1971, A&A, 15, 110
- Vanzella et al. (2008) Vanzella E. et al., 2008, A&A, 478, 83
- Weiss et al. (2009) Weiss A. et al., 2009, ApJ, submitted