Ultradeep INFRARED ARRAY CAMERA Observations Of Sub- And Galaxies in the HUBBLE ULTRA DEEP FIELD: the Contribution of Low-Luminosity Galaxies to the Stellar Mass Density and Reionization Alternate Affiliation: Based on observations made with the NASA/ESA Hubble Space Telescope, which is operated by the Association of Universities for Research in Astronomy, Inc., under NASA contract NAS 5-26555. These observations are associated with programs #11563, 9797. Based on observations with the Spitzer Space Telescope, which is operated by the Jet Propulsion Laboratory, California Institute of Technology under NASA contract 1407. Support for this work was provided by NASA through contract 125790 issued by JPL/Caltech. Based on service mode observations collected at the European Southern Observatory, Paranal, Chile (ESO Program 073.A-0764A). Based on data gathered with the 6.5 m Magellan Telescopes located at Las Campanas Observatory, Chile.
Abstract
We study the Spitzer Infrared Array Camera (IRAC) mid-infrared (rest-frame optical) fluxes of 14 newly WFC3/IR-detected dropout galaxies and 5 -dropout galaxies. The WFC3/IR depth and spatial resolution allow accurate removal of contaminating foreground light, enabling reliable flux measurements at m and m. None of the galaxies are detected to (AB, ), but a stacking analysis reveals a robust detection for the -dropouts and an upper limit for the dropouts. We construct average broadband spectral energy distributions using the stacked ACS, WFC3, and IRAC fluxes and fit stellar population synthesis models to derive mean redshifts, stellar masses, and ages. For the dropouts, we find , , reddening , stellar mass (Salpeter initial mass function). The best-fit ages Myr, , and Gyr-1 are similar to values reported for luminous galaxies, indicating the galaxies are smaller but not much younger. The sub galaxies observed here contribute significantly to the stellar mass density and under favorable conditions may have provided enough photons for sustained reionization at . In contrast, the -dropouts have stellar masses that are uncertain by 1.5 dex due to the near-complete reliance on far-UV data. Adopting the upper limit on the , the stellar mass density to declines from Mpc-3 to Mpc-3, following over . Lower masses at would signify more dramatic evolution, which can be established with deeper IRAC observations, long before the arrival of the James Webb Space Telescope.
Subject headings
galaxies: evolution — galaxies: high-redshiftI. Introduction
The reionization epoch represents the latest observational frontier of galaxy formation. Little is known about the galaxy properties during this time, including feedback, metal production, and their contribution to reionization. Extensive studies have been done of galaxies selected by the dropout technique out to (see e.g., Stanway et al. 35, Yan et al. 42, Bouwens et al. 2, McLure et al. 25). Pushing these studies to has proven extraordinarily challenging: only 25 high-quality candidates are currently known [3, 27, 9, 30, R. J. Bouwens et al. in preparation].
The arrival of WFC3/IR aboard Hubble Space Telescope (HST) heralds a dramatic improvement in our ability to survey the reionization era, allowing us to identify the predominant low-luminosity galaxies at by their redshifted light. Whereas HST remains crucial for identifying the galaxies, longer-wavelength data are necessary for constraining the stellar masses and ages. Access to the rest-frame optical is offered by the Infrared Array Camera (IRAC; Fazio et al. 13) on Spitzer, which by itself has permitted estimates of stellar masses for large numbers of sources [11, 43, 36], and even a few at [12, 20]. One surprising early finding was the number of quite massive galaxies with appreciable ages (Myr) suggesting the galaxies formed substantial amounts of stars at even earlier times, well into the epoch of reionization [37, 43].


In this Letter, we extend the stellar mass and age estimates to lower luminosities () and higher redshift by analyzing the IRAC mid-IR fluxes of the robust -dropout and -dropout galaxy samples found by Oesch et al. [28] and Bouwens et al. [4] in the newly acquired WFC3/IR data (GO-11563, PI Illingworth) over the Hubble Ultra Deep Field (HUDF; see also Bunker et al. 6, McLure et al. 26). We adopt an cosmology with km s-1Mpc-1. Magnitudes are in the AB photometric system [29]. Imaging depths refer to AB point source total magnitude, unless stated otherwise.
II. Observations and Photometry
The recent dropout and dropout samples were selected from exceptionally deep WFC3/IR imaging, to AB magnitude in ,,, allowing the study of fainter sources than the NICMOS based samples presented in Labbé et al. [20] and Gonzalez et al. [15]. We discuss briefly the IRAC photometry of 14 of the 16 dropouts found by [28] and the 5 dropouts reported by Bouwens et al. [4] (see Labbé et al. 20 for the two dropouts found earlier with NICMOS).
Spitzer data over this field were obtained from the Great Observatories Origins Deep Survey (GOODS; M. Dickinson et al. in preparation), which observed the HUDF with IRAC in two epochs of hr each11 1 This paper uses data release DR3 of epoch 1 and data release DR2 of epoch 2, available from http://data.spitzer.caltech.edu/popular/goods/. The IRAC depths in the and bands are 27.7 and 27.2 (AB). We supplement the observations with deep -band data from the Very Large Telescope and Magellan to K (I. Labbé et al. in preparation).
A critical aspect is obtaining reliable IRAC fluxes of the candidates. This is challenging because of extended wings of the IRAC point-spread function (PSF), causing flux contamination from nearby foreground sources. We use the technique of Labbé et al. [20] to fit and subtract the foreground sources using the flux profiles in the ultradeep WFC3/IR detection images as priors (see Gonzalez et al. 15 for a more complete description and Wuyts et al. 47 for illustrative examples).
After cleaning the IRAC images, we first performed conventional aperture photometry in and bands in 25 diameter apertures. We define the photometric error as the quadratic sum of random fluctuations in the aperture (determined from empty apertures on the nearby background; e.g., Labbé et al. 19) and the fit uncertainties to each individual neighbor. We performed the photometry independently on the first and second epoch IRAC data, which are rotated by and therefore have different PSFs and contamination (see Labbé et al. 20). Two of the 14 -dropouts and 1 -dropout were too close to bright sources to be successfully measured and were removed from the sample (later we assume average for these galaxies). Of the remaining galaxies none were detected () in the epochs individually or combined (to , total).
III. Stacking
Owing to the extreme faintness of the dropout and dropout samples over the WFC3 HUDF09 field, we derive average properties by registering and stacking the confusion corrected IRAC maps. The resulting stacked image for the 12 -dropouts is shown in Figure 1, featuring an unambiguous source coincident with the dropout location, with an average magnitude of (AB, measured in a 25 diameter aperture and corrected to total). To evaluate robustness of the detection we also create a median stack, which is resistant against outliers, to ensure that the signal is not coming from only a few sources. We derive uncertainties by bootstrap resampling the images in the stack 200 times, finding signal-to-noise ratio . The implied rms in a 25 aperture is (total). The same procedure was carried out in the band showing a fainter source ().
Detecting the dropouts is even more challenging. Not only are the -dropouts in our samples fainter, there are also fewer to stack (4 versus 12), and they might be bluer due to younger ages, lower metallicities, or other effects (e.g., Bouwens et al. 5). The resulting stacked image for the 4 is shown in the lower panels of Figure 1, showing no detection to a limit (, total). The formal measurement is . The photometry is presented in Table 1.
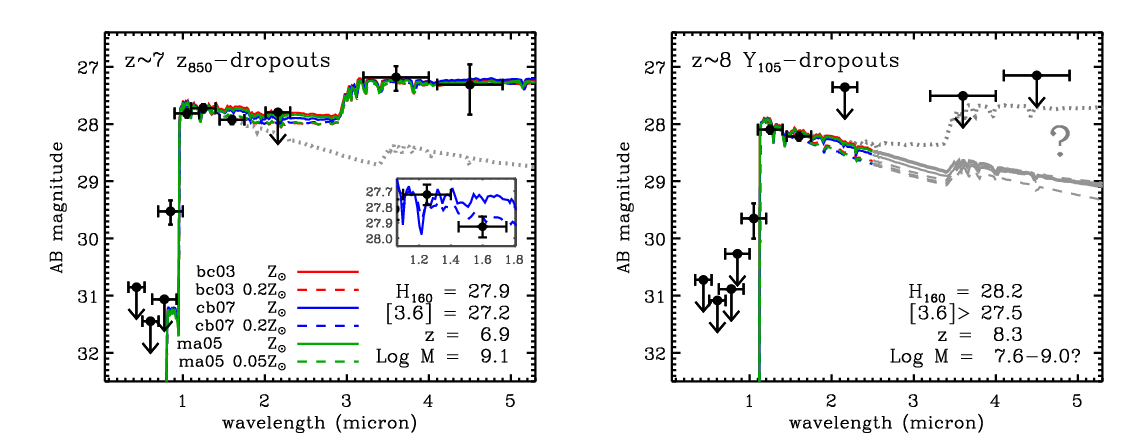
The average SED shape of the faint dropout galaxies, shown in Figure 2, is remarkably similar to that of the more luminous and massive NICMOS sample presented by [15]. The rest-frame far-UV slope is extremely blue (Bouwens et al. 5 find ), suggesting low ages or sub-Solar metallicities. However, note the relatively red color, suggesting the presence of a modest Balmer break between the bands, indicative of evolved stellar populations.
IV. Stellar populations
We use standard techniques to derive stellar masses and redshifts by fitting stellar populations synthesis models to the average -band flux densities of the dropouts and dropouts. We use Bruzual & Charlot [7, BC03] models and assume Solar metallicity and a Salpeter [32] initial mass function (IMF) between and . This choice enables straightforward comparison with previous results, but we also review the effect of different assumptions and models. Furthermore, we assume constant star formation (CSF) as opposed to exponentially declining models, motivated by the lack of evolution of the star formation rate (SFR) per unit mass (specific SFR,(SSFR)) between and [15, 36]. Up to mag Calzetti et al. [8] starburst reddening is allowed, where we note that galaxies have blue UV-continuum slopes and low dust extinction (e.g., Lehnert & Bremer 22, Stanway et al. 33, Bouwens et al. 2, Bouwens et al. 5). We use the -fitting code FAST [16] which provides best-fit parameters and uncertainties using Monte Carlo simulations. We fit the average SED fluxes to models smoothed to a resolution of 100 Å rest frame, corresponding to the approximate width of the dropout selection windows. The modeling results are presented in Table 2 and overplotted in Figure 2.
The best-fit redshifts of the dropouts and dropouts are and , respectively, in agreement with expectations from simulations (see Oesch et al. 28, Bouwens et al. 4). The extremely blue rest-frame far-UV slope of the galaxies is a challenge to fit, requiring , and sub-Solar metallicity rather than Solar models ( versus ). Consistently, the relatively red color favors evolved models (ageMyr22 2 Following [20] and [15], we report SFH weighted age (for CSF), where is the time elapsed since the start of star formation.). We caution that emission lines can contribute to the flux, but for the redshift distribution and color of this sample we estimate the effect is only mag.
Interestingly, Maraston [24] and Charlot and Bruzual (in preparation; CB07) models produce nearly identical results as the BC03 models. Derived stellar masses are quite robust with at most 0.1 dex systematic variation between the different model choices. The only important effect on the masses is IMF: a more reasonable Kroupa [17] IMF reduces the stellar masses and SFRs by dex, but does not change other parameters or the quality of fit. More detailed exploration of the stellar ages and star formation histories (SFHs) is presented by [15].
The stellar masses and ages of the dropout galaxies are not well constrained. The low S/N of the IRAC stack causes the fit to be determined by the and fluxes, producing a formal best-fit with minimal allowed masses and ages Myr and 1.5 dex uncertainties. However, if we refit the stack without IRAC data we also find very low masses and ages and large uncertainties. This underscores the crucial importance of deep IRAC data and suggests that model fits relying exclusively on far-UV data should be regarded with caution. Even though the fits may suggest a strong evolution of the stellar populations, we can not exclude that galaxies at have similar masses, ages, and s as faint galaxies.

V. Discussion
The reionization epoch represents the latest frontier of galaxy formation theory,
which is now being probed to extreme depths with the amazingly efficient WFC3/IR
camera aboard HST. Using the conservative dropout and dropout samples of
Oesch et al. [28] and Bouwens et al. [4] we find Spitzer/IRAC capable of an equally
remarkable feat: the stacked detection of even the faintest
galaxies found by WFC3/IR, providing direct proof that IRAC
can probe much deeper than widely accepted. In addition we derive upper limits for the
newly discovered galaxies, some of which may well be at higher redshift than
the currently most distant GRB [34, 38]. We
now elaborate on various implications.
1) Stellar populations at
Spitzer/IRAC places two important constraints on the stellar populations. First, the
combination of the blue far-UV slope and the moderately red color
in the ultrafaint () galaxies indicates the presence of
a modest Balmer break, expected for evolved stellar populations. Very young
stellar ages are ruled out (CSF ageMyr at %).
Interestingly, low-metallicity models, which produce bluer far-UV colors at fixed
age, provide significantly better fits than do Solar, but for both it is
challenging to reproduce the extremely blue observed far-UV slope ( as found
by Bouwens et al. 5).
Second, the average stellar masses indicate appreciable
mass-to-light ratios M/L and M/L. The ratios
are comparable those of the more massive sample of [15],
suggesting that the ratios do not strongly depend on luminosity or mass.
We find no appreciable difference between the best-fit parameters of BC03, MA05, and
CB07 models, although IMF variations are a potentially significant source of systematic
uncertainty: a steeper high-mass slope (e.g., Weidner & Kroupa 45) would lower the
inferred stellar ages, a higher characteristic mass (e.g., “bottom light”, van Dokkum 44)
would lower the total stellar masses and s, and any
evolution with time would complicate comparisons between SFR and stellar mass
across epochs.
2) Star formation histories
SFHs are notoriously hard to constrain from observations of individual
galaxies. However, statistical constraints can be obtained by comparing the SSFRs
as a function of time and mass, as different shapes of the
SFH give rise to distinctly different evolution (e.g., Labbé et al. 21). One
remarkable recent result is the observation that the SSFR at fixed
does not evolve from [36, 15]. Here we benefit from the extreme
depths of the WFC3/IR data to probe the lowest luminosities, suggesting that
the SSFR at is also not strongly
dependent on luminosity or stellar mass over the range . This may imply
that the SFR correlates with stellar mass with a logarithmic slope close to 1.
Both results (with redshift and mass) qualitatively agree with numerical
simulations for early galactic star formation (, which
robustly predict that SFR is proportional to M*, with similar SFHs in haloes of different
masses [10], and that the SFRs of individual galaxies are constantly
rising [14].
3) Evolution of the stellar mass density to
The low-luminosity galaxies probed in this paper are expected to contribute significantly
to the stellar mass density owing to their substantial .
Following the approach of Gonzalez et al. [15], we derive integrated stellar mass
densities at by multiplying the UV-luminosity densities of Bouwens et al. [4], integrated
to , with the mean derived for the galaxy samples in this Letter.
For the dropouts at , this results in Mpc-3.
The evolution of the mass density is shown in Figure 3, compared to previous
luminous samples, which were corrected to the same luminosity limit assuming a constant .
The stellar masses at are uncertain by dex due to the weak constraints
from IRAC, so instead of plotting the best-fit we show the 95% confidence upper limit.
The integrated mass density to a limit of
then declines to Mpc-3. This is
marginally consistent with the extrapolation of the evolution over the
range . The upper limit may be evidence for a more rapid evolution
toward , but deeper IRAC data and larger samples are needed to establish this firmly.
The uncertainties quoted above do not include cosmic variance, which is estimated to be
% for the sample and % at [39].
4) Reinionization since
Combined, the results have profound implications for the ability
of the universe to be reionized by photons from star formation –
and to remain so for an extended period. Crucially, the
large stellar mass density in low-luminosity galaxies points to
significant amounts of star formation at earlier times.
We can therefore ask whether this corresponds to enough
ionizing photons at higher redshift to keep the universe reionized.
Let us assume the stellar mass density Mpc-3 was assembled
in the Myr between , in the reionization era (WMAP5, Komatsu et al. 18).
Correcting by 10% to account for mass loss in stellar evolution, the possible sustained SFR density
would then be yr-1Mpc-3, significantly
higher than that has been derived for luminous galaxies alone [15].
However, the primary uncertainty is the fiducial critical SFR
density needed for reionization [23],
which depends sensitively on the values for the H II IGM clumping factor and
the fraction of ionizing photons that leak unhindered out of
the galaxies (e.g., Ouchi et al. 30). The popular choice leads to
yr-1Mpc-3 averaged over ,
which is times higher than that
can be explained by the stellar masses. However, at early times the clumping factor may
be as low as (e.g., Trac & Cen 40, Bolton & Haehnelt 1, Pawlik et al. 31). The escape fraction
may be significantly higher as well: recent numerical simulations suggest
[46, 31, 41] and Bouwens et al. [5] note that the extremely
blue far-UV slope of the galaxies studied here could also result from large escape
fractions . The choice leads to
yr-1Mpc-3(over ),
which means photons from the low-luminosity star forming galaxies
observed here are capable of causing sustained reionization since .
The first Spitzer/IRAC detection of low-luminosity galaxies
and their red colors
provide important insights into the earliest phases of galaxy evolution, showing that
these early galaxies have relatively high Myr ages and .
Consequently, low-luminosity galaxies contribute significantly to
the stellar mass density Mpc-3,
suggesting that the SFR corresponding to that mass may have provided a substantial
fraction of the ionizing photons that kept the universe reionized at earlier times.
Future IRAC studies of larger numbers of high redshift galaxies are required
to bolster the results in this paper and to further constrain the evolution of the mass
density toward the highest redshifts . The Spitzer post-cryogenic phase
(“warm mission”) provides a rare window of opportunity to observe these galaxies in a timely
manner to the mag deeper limits needed, long before the arrival of the
James Webb Space Telescope.
Facilities: Spitzer (IRAC), HST (WFC3/IR), Magellan:Baade (PANIC), VLT:Melipal (ISAAC)
References
- [1] Bolton, J. S., & Haehnelt, M. G. 2007, MNRAS, 374, 493
- [2] Bouwens, R. J., Illingworth, G. D., Blakeslee, J. P., & Franx, M. 2006, ApJ, 653, 53
- [3] Bouwens, R. J., Illingworth, G. D., Franx, M., & Ford, H. 2008, ApJ, 686, 230
- [4] Bouwens, R. J., et al. 2009a, arXiv:0909.1803
- [5] Bouwens, R. J., et al. 2009b, ApJ, in press, arXiv:0910.0001
- [6] Bunker, A., et al. 2009, arXiv:0909.2255
- [7] Bruzual, G. & Charlot, S. 2003, MNRAS, 344, 1000 (BC03)
- [8] Calzetti, D., et al. 2000, ApJ, 533, 682
- [9] Castellano, M., et al. 2009, arXiv:0909.2853
- [10] Davé, R. 2008, MNRAS, 385, 147
- [11] Eyles, L. P., et al. 2005, MNRAS, 364, 443
- [12] Egami, E., et al. 2005, ApJ, 618, L5
- [13] Fazio, G. G., et al. 2004, ApJS, 154, 10
- [14] Finlator, K., Davé, R., & Oppenheimer, B. D. 2007, MNRAS, 376, 1861
- [15] Gonzalez, V., Labbe, I., Bouwens, R. J., Illingworth, G., Franx, M., Kriek, M., & Brammer, G. B. 2009, arXiv:0909.3517
- [16] Kriek, M., van Dokkum, P. G., Labbé, I., Franx, M., Illingworth, G. D., Marchesini, D., & Quadri, R. F. 2009, ApJ, 700, 221
- [17] Kroupa, P. 2001, MNRAS, 322, 231
- [18] Komatsu, E., et al. 2009, ApJS, 180, 330
- [19] Labbé, I., et al. 2003, AJ, 125, 1107
- [20] Labbé, I., Bouwens, R., Illingworth, G. D., & Franx, M. 2006, ApJ, 649, L67
- [21] Labbé, I., et al. 2007, ApJ, 665, 94
- [22] Lehnert, M. D., & Bremer, M. 2003, ApJ, 593, 630
- [23] Madau, P., Haardt, F., & Rees, M. J. 1999, ApJ, 514, 648
- [24] Maraston, C. 2005, MNRAS, 362, 799
- [25] McLure, R. J., Cirasuolo, M., Dunlop, J. S., Foucaud, S., & Almaini, O. 2009, MNRAS, 395, 2196
- [26] McLure, R. J., Dunlop, J. S., Cirasuolo, M., Koekemoer, A. M., Sabbi, E., Stark, D. P., Targett, T. A., & Ellis, R. S. 2009b, MNRAS, in press, arXiv:0909.2437
- [27] Oesch, P. A., et al. 2009a, ApJ, 690, 1350
- [28] Oesch, P. A., et al. 2009b, ApJ, in press, arXiv:0909.1806
- [29] Oke, J. B., & Gunn, J. E. 1983, ApJ, 266, 713
- [30] Ouchi, M., et al. 2009, arXiv:0908.3191
- [31] Pawlik, A. H., Schaye, J., & van Scherpenzeel, E. 2009, MNRAS, 394, 1812
- [32] Salpeter, E. E. 1955, ApJ, 121, 161
- [33] Stanway, E. R., McMahon, R. G., & Bunker, A. J. 2005, MNRAS, 359, 1184
- [34] Salvaterra, R., et al. 2009, arXiv:0906.1578
- [35] Stanway, E. R., Bunker, A. J., & McMahon, R. G. 2003, MNRAS, 342, 439
- [36] Stark, D. P., Ellis, R. S., Bunker, A., Bundy, K., Targett, T., Benson, A., & Lacy, M. 2009, ApJ, 697, 1493
- [37] Stark, D. P., Ellis, R. S., Richard, J., Kneib, J.-P., Smith, G. P., & Santos, M. R. 2007, ApJ, 663, 10
- [38] Tanvir, N. R., et al. 2009, arXiv:0906.1577
- [39] Trenti, M., & Stiavelli, M. 2008, ApJ, 676, 767
- [40] Trac, H., & Cen, R. 2007, ApJ, 671, 1
- [41] Yajima, H., Umemura, M., Mori, M., & Nakamoto, T. 2009, MNRAS, 398, 715
- [42] Yan, H., et al. 2004, ApJ, 616, 63
- [43] Yan, H., Dickinson, M., Giavalisco, M., Stern, D., Eisenhardt, P. R. M., & Ferguson, H. C. 2006, ApJ, 651, 24
- [44] van Dokkum, P. G. 2008, ApJ, 674, 29
- [45] Weidner, C., & Kroupa, P. 2005, ApJ, 625, 754
- [46] Wise, J. H., & Cen, R. 2009, ApJ, 693, 984
- [47] Wuyts, S., et al. 2007, ApJ, 655, 51
| [3.6] | [4.5] | |||||||||
|---|---|---|---|---|---|---|---|---|---|---|
| -dropout SED | 1.4(0.7) | 0.4(0.4) | -0.1(0.6) | 5.6(1.1) | 27.2(1.8) | 29.6(2.0) | 24.5(1.6) | 22.9(13.8) | 48.5(9.5) | 43.2(16.6) |
| -dropout SED | -1.1(0.9) | 0.2(0.7) | 0.3(0.8) | -0.8(1.4) | 5.0(1.4) | 20.9(1.4) | 18.8(1.3) | 15.1(20.7) | 16.9(18.3) | 20.5(25.0) |
Note. — The optical–to–near-IR photometry is measured in diameter apertures and corrected to total. Spitzer/IRAC photometry is performed on confusion corrected maps in diameter apertures and corrected to total. Note, we limit the signal-to-noise ratio to or 0.07 mag to account for zeropoint uncertainties. Units are nanoJy.
for constant star forming models and a Salpeter (1955) IMF
| model | zphot | Z | log agew | AV | log | log | log | |
|---|---|---|---|---|---|---|---|---|
| (Z☉) | (yr) | (mag) | () | (yr-1) | (yr-1) | |||
| -Dropouts Solar Metallicity | ||||||||
| BC03 | 6.85 | 1.00 | 8.58 | 0.00 | 9.15 | 0.37 | -8.78 | 6.39 |
| CB07 | 6.85 | 1.00 | 8.58 | 0.00 | 9.15 | 0.37 | -8.78 | 6.39 |
| MA05 | 6.87 | 1.00 | 8.45 | 0.00 | 9.10 | 0.43 | -8.67 | 5.48 |
| -Dropouts sub-Solar Metallicity | ||||||||
| BC03 | 6.88 | 0.20 | 8.58 | 0.00 | 9.09 | 0.31 | -8.78 | 2.95 |
| CB07 | 6.88 | 0.20 | 8.55 | 0.00 | 9.07 | 0.31 | -8.76 | 2.94 |
| MA05 | 6.88 | 0.05 | 8.55 | 0.00 | 9.07 | 0.31 | -8.76 | 2.72 |
| -Dropouts Solar Metallicity | ||||||||
| BC03 | 8.21 | 1.00 | 6.70 | 0.00 | 7.57 | 0.58 | -6.99 | 2.31 |
| CB07 | 8.21 | 1.00 | 6.70 | 0.00 | 7.57 | 0.58 | -6.99 | 2.31 |
| MA05 | 8.23 | 1.00 | 6.70 | 0.00 | 7.57 | 0.59 | -6.98 | 2.20 |
| -Dropouts sub-Solar Metallicity | ||||||||
| BC03 | 8.26 | 0.20 | 6.70 | 0.00 | 7.59 | 0.60 | -6.99 | 1.57 |
| CB07 | 8.26 | 0.20 | 6.70 | 0.00 | 7.59 | 0.60 | -6.99 | 1.57 |
| MA05 | 8.26 | 0.05 | 6.70 | 0.00 | 7.58 | 0.60 | -6.99 | 1.62 |
Note. — Best-fit parameters and 68% confidence intervals as computed with FAST [16] for CSF models with a Salpeter (1955) IMF between . A Kroupa (2001) IMF would result in 0.20 dex lower stellar masses and SFRs, respectively, but other parameters would remain unchanged. The dropout model fits favor low metallicities and high ages. The dropout model fits are uncertain: deeper IRAC is needed. Note, following [15] we report the SFH averaged (for CSF), where is the time elapsed since the start of star formation