CCD Photometry of Standard Stars at Maidanak Astronomical Observatory in Uzbekstan: Transformations and Comparisons
Abstract
Observation of standard stars is of crucial importance in stellar photometry. We have studied the standard transformation relations of the CCD photometric system at the Maidanak Astronomical Observatory in Uzbekistan. All observations were made with the AZT-22 1.5m telescope, SITe 2k CCD or Fairchild 486 CCD, and standard Bessell filters from 2003 August to 2007 September. We observed many standard stars around the celestial equator observed by SAAO astronomers. The atmospheric extinction coefficients, photometric zero points, and time variation of photometric zero points of each night were determined. Secondary extinction coefficients and photometric zero points were very stable, while primary extinction coefficients showed a distinct seasonal variation. We also determined the transformation coefficients for each filter. For , , , and filters, the transformation to the SAAO standard system could be achieved with a straight line or a combination of two straight lines. However, in the case of the filter and Fairchild 486 CCD combination, a significant non-linear correction term - related to the size of Balmer jump or the strength of the Balmer lines - of up to was required. We found that our data matched well the SAAO photometry in , , , and . But in , the difference in zero point was about and the scatter was about . We attribute the relatively large scatter in to the larger error in of the SAAO photometry. We confirm the mostly small differences between the SAAO standard system and the Landolt standard system. We also attempted to interpret the seasonal variation of the atmospheric extinction coefficients in the context of scattering sources in the earth’s atmosphere.
1 Department of Astronomy and Space Science,
Sejong University,Seoul,Korea
e-mail: bdlim1210@sju.ac.kr, sungh@sejong.ac.kr
2 Research School of Astronomy & Astrophysics, Australian National University,
Private Bag, Weston Creek PO, ACT 2611, Australia
e-mail: bessell@mso.anu.edu.au
3 Ulugh Beg Astronomical Institute, 33 Astronomical Street, Tashkent 700052, Uzbekistan
e-mail: rivkat@astrin.uzsci.net, mansur@astrin.uzsci.net
()
Key words : techniques: CCD photometry — stars: imaging — standard star
I INTRODUCTION
Many photometric systems have been developed for various astronomical purposes since photoelectric photometry was introduced. A photometric system is defined by the central wavelengths and width of its passbands and its set of standard stars. Photometric systems can be divided into three categories according to the width of their passbands - broad, intermediate, and narrow band system (Bessell 2006). The ‘Johnson-Cousins’ system is the most widely used broad-band photometric system.
The photometric system defined by Johnson and Morgan in 1953 was designed around the established MK spectral classification (Johnson & Morgan 1953). They defined the zero point of all color indices to be those of the bright northern main-sequence star Vega with spectral type A0. Subsequently they published several papers of photoelectric photometric data that comprises the original photometric standard star lists. Most of these standard stars are very bright and in addition many variable stars were also included. A few years later, Johnson (1966) extended his photometric system up to mid-IR. The advent of newer and more sensitive and reliable photoelectric detectors in the 1970s and CCDs in the 1990s opened accurate photometry to fainter stars. The original Johnson standards were inappropriate for modern photometry and nowadays the Kron-Cousins system is widely used instead of Johnson’s because of the more precise standards.
Currently two sets of standard star regions are mainly used in photometry. The first is the E-region standard stars centered at declination in the southern hemisphere. The other is the Landolt equatorial standard stars. The photoelectric photometry of E-region standard stars were established by A. W. J. Cousins (1978). It is very closely tied to the Johnson UBV system. The astronomers at the South Africa Astronomical Observatory (SAAO) are continuously improving the accuracy and precision of the E-region stars. The SAAO standard stars are known as the most precise system available currently. However, there are several limitations in the E-region standard stars - the majority are too bright, they lack extremely blue or red stars, and are sparsely distributed. SAAO observers have tried to overcome these limitations. Menzies et al. (1991) (hereafter M91) performed extensive photometry of Landolt’s equatorial standard stars as program stars using E-region standard stars. Kilkenny et al. (1998) published additional photometric data for very blue and red stars.
Landolt (1973, 1983, 1992) also published extensive lists of standard stars in the celestial equator. Landolt (1973) was confined to only, but based on Cousins E-region stars. Later Landolt (1983) (hereafter L83) extended his standard system to . Owing to the emergence of sensitive two-dimensional detectors, such as CCDs, the necessity of many faint standard stars covering a wide color range in a small field of view was obvious. Landolt (1992) (hereafter L92) is the only available standard star list to meet these requirements. He also observed many blue and red standard stars selected from various catalogues. Recently Landolt (2007) published new standard stars at declination .
There are several reports on the systematic differences between SAAO and Landolt systems, although Landolt’s photometry were based on Cousins standards. Those systematic differences in , and are discussed in M91, Bessell (1995), and Sung & Bessell (2000) (hereafter SB00). The differences in are sufficiently large that they make it difficult to get reliable physical quantities for early type stars. These systematic differences have arisen through differences in instrumental system passbands and standardization problems associated with a lack of red and blue E-region standards.
Precise standardized photometry cannot be obtained without a detailed knowledge of the photometric system, its standard stars, and the characteristics of the observing site including atmospheric extinction corrections. To investigate the characteristics of the observing site as well as the photometric system of Maidanak Astronomical Observatory (MAO), we observed many standard stars in the celestial equator over the last five years with a Fairchild 486 CCD (hereafter 4k CCD) or a SITe 2000 800 CCD (2k CCD), and Bessell filters (See Lim et al. 2008 for the characteristics of 4k CCD system). Atmospheric extinction and standard transformation are dealt with in §II. Comparisons between our results and Landolt photometry are made in §III. The characteristics of the atmospheric extinction coefficients are discussed in §IV. We also present variable star candidates from our observations in that section. The summary is given in §V.
II ATMOSPHERIC EXTINCTION AND STANDARD TRANSFORMATION
(a) MAO CCD system
All observations were made with the AZT-22 1.5m telescope (f/7.74), 4k CCD or 2k CCD, and Bessell filters at MAO. The characteristics of the 4k CCD system can be found in the previous paper (Lim et al. 2008).


(b) Observation and Data Reduction
Our observations were mainly made from 2003 August to 2007 September. Twenty five nights were photometric. A total of measurements ( in , in , in , in , in ) of SAAO standard stars in M91 and Kilkenny et al. (1998) were used to derive atmospheric extinction and transformation coefficients. We also measured the magnitude of Landolt standard stars in the observed images. To get quality data we used an appropriate exposure time for a given standard star. Nevertheless some bright stars were saturated even in short exposure images and some faint stars, especially in , were too faint to get reliable data.
Pre-processing was performed using the IRAF/ CCDRED package. All processes for the 4k CCD are described by Lim et al. (2008). After removing instrumental signatures, we performed simple aperture photometry for standard stars. An aperture of for the 2k CCD and for the 4k CCD was used for standard star photometry. Standard stars with good signal-to-noise ratios () were then used to determine the extinction and transformation coefficients for each filter.
(c) Extinction Coefficient
Atmospheric extinction is caused by absorption and scattering from gas molecules, dust particles and aerosols in the earth’s atmosphere. Its value depends primarily on airmass - the line-of-sight length passing through the earth’s atmosphere. In addition, since a component of the extinction varies with wavelength, the value of the extinction measured across a wide filter passband will differ depending on the spectral energy distribution of stars. We correct for this effect by looking for a primary or first extinction coefficient that is dependent on airmass but is independent of color, and a secondary extinction coefficient that depends also on color. The secondary extinction coefficient is negligible in or redder passbands. The magnitude corrected for the atmospheric extinction is given by
| (1) |
where , , , , , and are the extinction- corrected magnitude, observed instrumental magnitude, primary extinction coefficient, secondary extinction coefficient, relavant color index, and airmass, respectively. In general, we observed many standard regions several times at various airmasses. To ensure a long baseline in airmass we often observed standard stars near the meridian and again at zenith distances of .
Although we used four on-chip amplifiers for the 4k CCD to save CCD read-out time, we could find no noticeable difference in photometric zero points associated with them. The atmospheric extinction coefficients presented in Figure 1 and Table 1 for the 4k CCD are therefore the weighted mean values of those determined from the standard stars in each quadrant. The secondary extinction coefficients are only given for and , those in , and were too small to be considered meaningful. We plot the extinction coefficients against day of the year in Fig. 1. Those extinction coefficients obtained with the 2k CCD agree well with those determined with the 4k CCD data.
Table 1.
Extinction coefficients
Date of Obs
CCD
Time variation
2003.08.18.
0.1027
-
0.1646
0.2831
0.5204
SITe 2000 800
2004.08.10.
0.0669
-
0.2078
0.2706
0.4463
SITe 2000 800
2004.08.11.
0.0957
-
0.1947
0.2827
0.4038
SITe 2000 800
2004.08.15.
0.1033
-
0.1810
0.2963
0.4830
SITe 2000 800
2005.08.04.
0.0521
-
0.1859
0.3129
0.5134
SITe 2000 800
2005.08.05.
0.1337
-
0.2241
0.3297
0.6663
SITe 2000 800
2005.08.06.
0.1014
-
0.1885
0.3219
0.5210
SITe 2000 800
2005.08.09.
0.1391
-
0.2314
0.3238
0.4230
SITe 2000 800
2006.07.14.
0.0905
-
0.1982
0.3010
0.6261
SITe 2000 800
2006.07.15.
-
-
0.2282
0.3080
-
SITe 2000 800
2006.08.17.
0.0563
-
0.1572
0.2734
-
Fairchild 4096 4096
2006.08.22.
0.2601
-
0.3040
0.4069
0.6074
Fairchild 4096 4096
2006.11.11.
0.0556
0.0932
0.1536
0.2594
0.4948
Fairchild 4096 4096
2006.11.24.
0.0465
0.0931
0.1285
0.2360
0.4107
Fairchild 4096 4096
2006.12.26.
0.0571
0.0932
0.1436
0.2640
0.4358
Fairchild 4096 4096
2007.01.25.
0.0277
0.0757
0.1214
0.2384
0.4169
Fairchild 4096 4096
2007.01.26.
0.0386
-
0.1308
0.2269
0.4141
Fairchild 4096 4096
2007.01.27.
0.0395
0.0855
0.1320
0.2241
0.4085
Fairchild 4096 4096
2007.04.12.
0.1265
0.2000
0.2302
0.3501
0.5322
Fairchild 4096 4096
2007.04.18.
-
-
0.1916
0.2996
-
Fairchild 4096 4096
2007.05.09.
0.1024
0.1527
0.2042
0.3020
0.5110
Fairchild 4096 4096
2007.06.13.
-
0.1747
0.2120
0.3509
0.4753
Fairchild 4096 4096
2007.08.05.
0.0380
-
0.2060
0.3180
0.6380
Fairchild 4096 4096
2007.09.13.
0.0762
0.1183
0.1394
0.2688
0.4832
Fairchild 4096 4096
2007.09.14.
-
0.1386
0.2018
0.2989
0.4767
Fairchild 4096 4096
mean
0.0862
0.1225
0.1864
0.2939
0.4958
There are obvious seasonal variations in the primary extinction coefficients in all filters. The coefficients are larger in summer, but smaller in winter. In addition, the extinction coefficients in summer show a large scatter (see §IV(a) for the discussion). The mean extinction coefficients are slightly larger in and than those at Siding Spring Observatory (SSO), but in , , and are slightly smaller (SB00). On the other hand, we could not find any seasonal variations in the secondary extinction coefficients, and therefore, observers at MAO can use mean values for the secondary extinction coefficient in and .

(d) Transformation Coefficients
Any photometric system is defined by the filters and detectors used in the observations. A slight deviation between the standard magnitudes and atmospheric-extinction-corrected natural instrumental magnitudes is expected, and needs to be corrected for to achieve the highest accuracy. Such differences are tracked and corrected for through observation of many standard stars with as full a range of color as possible. The correction term between two systems is called the transformation coefficients, and is related as follow.
| (2) |
where , , , , , , represent the standard magnitude, atmospheric extinction-corrected instrumental magnitude as defined in equation (1), transformation coefficient, relevant color index, time-variation coefficient, time difference relative to midnight, and photometric zero point, respectively. All parameters are determined by using the weighted least square method (weight ). The is proportional to the reliability level of standard stars and the relative quality of each night. is the photometric error.
The final transformation relations for the 2k CCD are shown in Figure 2, and these coefficients are listed in Table 2. All transformations to the SAAO system are a straight line or combination of two straight lines. But the transformation relation for very red stars ( or ) is uncertain due to a lack of very red standard stars. We also showed the transformation relation for the 4k CCD in Figure 3. For , , , and filters, the transformation to the SAAO standard system can be achieved with a straight line or a combination of two straight lines. However, in , there is a conspicuous non-linear correction term related to the size of the Balmer jump or the strength of the Balmer lines. Sung et al. (1998) and SB00 also introduced a similar non-linear correction term in the transformation of the SSO filter. The maximum size of the non-linear correction term is up to .
The transmission function of the Bessell filter matches well with the total response function of the original Johnson’s filter and the quantum efficiency of the photomultiplier tube. The non-linear correction term in the transformation must result from the effective wavelength of the passband being pushed to far to the red. With most CCD photometry this results from a steep change in the quantum efficiency of the CCD across the passband, but the average quantum efficiency of a Fairchild 486 CCD chip (Fairchild homepage) is high and nearly flat in so the passband shift must result from some other optical component cutting off the short wavelength side of the response (e.g. dewar window).
The necessity of very red standard stars has increased recently as the finding of very red, low-mass objects has become an important topic in astronomy. We tried to determine the transformation relation of and for very red colors, but failed because all the red standard stars were saturated even in the shortest exposure time.
(e) Time Variation of Photometric Zero Points
The photometric zero points depend primarily on the light gathering power of the photometric system, i.e. the size and state of the primary mirror and the quantum efficiency of the detectors. In addition, changes in the atmospheric conditions such as a change in water vapor or dust content in the atmosphere or a change in the ozone layer in the upper atmosphere also affects the zero point. It is known that the change in water vapor content affects the extinction at the longer wavelength (mostly and near-IR), while changes in the thickness of the ozone layer affects the extinction at the short wavelength ( and ) (see SB00 or Sung et al 2001).
Figure 4 shows a typical case of time variation obtained on 2004, August 15. We found that in many cases the time variation of the photometric zero-points at MAO started at evening twilight and ended around midnight (). We made a note in the 8th column of Table 1 if there was a noticeable amount of time variation during the night.

(f) Standard Transformation
We transformed the data to the SAAO system using the relations above, and present the results in Table 3. The data for variable star candidates in Table 5 are not listed in the table. We also plot the residuals relative to the SAAO system in Figure 5 for the 2k CCD and in Figure 6 for the 4k CCD. The number at the bottom of each panel represents the weighted mean value and standard deviation of the residuals ( the number of observations). The mean value indicates the difference of zero points of our results relative to the SAAO system, while the standard deviation represents the precision (or reproducibility) of our photometry. In general, the differences in photometric zero point relative to the SAAO system are less than 1 . But in (and from the 2k CCD) the difference is slightly larger ( 3 – 3.6 ). A somewhat larger difference in the zeropoint of the 2k CCD is probably due to the lack of red standard stars. The slope of the transformation is strongly affected by the color where the slope changes. Unfortunately only one star with 1.6 was secured and the 2k CCD was replaced by a new 4k CCD in 2006, June.
Table 2.
Transformation coefficients
SITe 2k CCD
Fairchild 4k CCD
Filter
color
color range
color range
All
All
-
-
All
All
0.000
All
Early stars
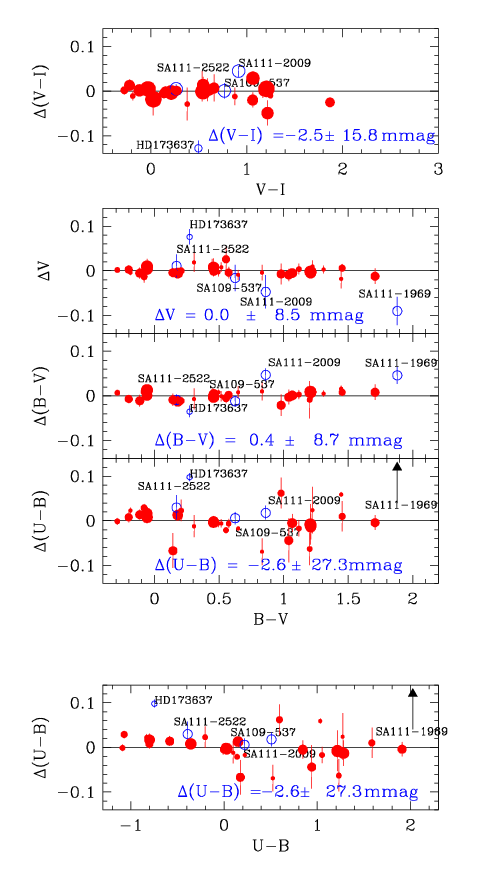


For the color, both 2K (CCD data) and 4K CCD data show a similar size zero point offset and a larger scatter. The error in the bottom panel of Figure 2 is mainly due to the error in the M91 photometry, not in ours. At SAAO the telescope was used for the photometry of standard stars and the quantum efficiency of the photomultiplier tubes was much lower than that of our CCD. As shown in Figure 7, the errors in of the SAAO data increase rapidly for , while those in our data are nearly flat down to . A somewhat larger offset in zero point and a larger scatter between our data and the SAAO data is inevitable.
Table 3.
Photometric data: standard stars
Star
BD+5 2468
9.359
-0.039
-0.077
-0.122
-0.518
0.006
0.001
0.004
0.023
0.022
4
2
4
4
4
BD-11 162
11.181
-
0.135
-0.073
-1.072
0.003
-
0.001
0.005
0.007
7
0
7
7
3
BD-15 115
10.867
-
-0.223
-0.200
-0.801
0.002
-
0.007
0.005
0.009
4
0
4
4
4
BD-2 524
10.312
-
-0.104
-0.112
-0.579
0.003
-
0.004
0.006
0.004
6
0
6
6
6
HD 149382
8.948
-
-0.276
-0.288
-1.090
0.005
-
0.003
0.004
0.006
2
0
2
2
2
HD 160233
9.098
-0.016
-0.030
-0.058
-0.789
0.001
0.004
0.001
0.001
0.015
18
2
18
17
11
HD 209684
9.845
-
-0.191
-0.190
-0.828
0.001
-
0.002
0.003
0.009
7
0
7
7
5
HD 216135
10.119
-
-0.118
-0.114
-0.583
0.007
-
0.008
0.008
0.009
5
0
5
5
5
P1633+099
14.360
-
-0.177
-0.202
-1.010
0.004
-
0.012
0.005
0.005
1
0
1
1
1
P1633+099A
15.237
-
1.007
0.870
-
0.008
-
0.012
0.014
0.000
1
0
1
1
0
P1633+099B
12.949
-
1.069
1.078
0.998
0.002
-
0.003
0.004
0.009
1
0
1
1
1
P1633+099C
13.203
-
1.112
1.135
1.119
0.002
-
0.003
0.004
0.012
1
0
1
1
1
P1633+099D
13.662
-
0.638
0.526
-0.031
0.003
-
0.004
0.004
0.003
1
0
1
1
1
SA92-263
11.791
0.510
1.064
1.084
0.851
0.002
0.001
0.002
0.008
0.009
1
1
1
1
2
SA92-330
15.041
-
0.728
0.578
-0.055
0.020
-
0.028
0.025
0.019
1
0
1
1
1
SA92-335
12.534
-
0.727
0.685
0.245
0.006
-
0.003
0.008
0.005
3
0
3
3
3
SA92-339
15.556
-
0.631
0.514
-0.197
0.034
-
0.047
0.041
0.026
1
0
1
1
1
SA92-342
11.616
0.272
0.533
0.446
-0.009
0.006
0.005
0.001
0.002
0.005
9
3
6
8
11
SA93-241
9.393
0.452
0.909
0.868
0.443
0.001
0.001
0.001
0.001
0.003
1
1
1
1
1
SA93-317
11.551
0.293
0.588
0.498
-0.019
0.005
0.010
0.003
0.002
0.006
20
7
12
18
15
SA93-326
9.572
0.259
0.521
0.454
-0.004
0.003
0.010
0.002
0.004
0.002
12
5
7
11
8
SA93-332
9.789
0.288
0.598
0.519
0.013
0.000
0.003
0.007
0.002
0.002
12
6
8
11
9
SA93-333
12.027
0.418
0.881
0.844
0.502
0.001
0.004
0.006
0.005
0.010
21
6
12
19
15
SA93-424
11.636
0.499
1.060
1.098
0.924
0.006
0.004
0.006
0.011
0.014
5
2
4
5
8
SA94-242
11.729
-
0.380
0.306
0.099
0.001
-
0.003
0.001
0.001
1
0
1
1
1
SA94-251
11.214
-
1.248
1.224
1.272
0.001
-
0.001
0.001
0.002
1
0
1
1
1
SA94-305
8.902
-
-
1.424
1.587
0.001
-
-
0.001
0.001
1
0
0
1
1
SA94-308
8.753
0.289
0.573
0.500
0.008
0.001
0.001
0.001
0.001
0.001
1
1
1
1
1
SA95-132
12.094
0.305
0.565
0.433
0.232
0.006
0.006
0.006
0.009
0.003
7
5
5
6
4
SA95-74
11.536
0.574
1.169
1.161
0.703
0.005
0.007
0.006
0.002
0.002
7
5
5
1
1
SA96-180
8.928
-
-
1.075
-
0.001
-
-
0.001
-
1
0
0
1
0
SA96-36
10.604
0.134
0.275
0.238
0.136
0.010
0.005
0.005
0.011
0.012
6
6
6
8
5
SA96-393
9.659
0.319
0.674
0.603
0.044
0.003
0.001
0.011
0.001
0.012
2
1
2
4
2
SA96-406
9.300
0.110
0.246
0.206
0.156
0.001
0.001
0.001
0.001
0.001
1
1
1
1
1
SA97-284
10.790
-
1.488
-
-
0.001
-
0.001
-
-
1
0
1
0
0
SA97-346
9.270
-
-
0.617
0.105
0.000
-
-
0.001
0.001
2
0
0
2
1
SA97-351
9.797
0.144
0.274
0.203
0.038
0.006
0.001
0.001
0.012
0.013
4
1
2
4
2
SA98-193
10.039
0.553
1.148
1.190
1.152
0.007
0.008
0.004
0.010
0.014
5
2
3
5
4
SA98-653
9.540
0.034
0.033
-0.007
-0.135
0.004
0.007
0.002
0.008
0.005
4
3
3
4
2
SA98-978
10.584
0.315
0.648
0.619
0.139
0.007
0.008
0.006
0.010
0.013
7
4
5
7
7
SA99-296
8.459
0.517
1.115
1.211
1.257
0.006
0.001
0.004
0.014
0.009
7
1
2
6
5
SA99-408
9.816
0.243
0.480
0.414
0.037
0.006
0.002
0.006
0.008
0.017
7
5
5
6
5
SA99-418
9.471
-0.002
-0.009
-0.044
-0.176
0.002
0.005
0.006
0.005
0.014
7
5
5
5
2
SA99-438
9.397
-0.085
-0.149
-0.145
-0.645
0.012
0.007
0.004
0.009
0.014
6
4
4
4
3
SA100-162
9.156
0.570
1.200
1.284
1.490
0.003
0.015
0.002
0.007
0.008
5
1
2
5
5
SA100-241
10.149
0.091
0.163
0.153
0.116
0.006
0.006
0.004
0.007
0.012
9
7
7
8
7
SA100-280
11.816
0.288
0.579
0.500
-0.009
0.006
0.013
0.010
0.007
0.021
19
7
10
19
16
SA101-281
11.590
0.407
0.854
0.826
0.480
0.007
0.008
0.005
0.015
0.011
7
6
7
7
10
SA101-282
10.010
0.252
0.509
0.435
0.008
0.005
0.008
0.009
0.006
0.008
4
4
4
4
5
SA102-466
9.255
0.502
1.054
-
-
0.005
0.007
0.005
-
-
2
2
2
0
0
SA102-472
8.754
0.478
1.001
1.027
0.835
0.010
0.001
0.001
0.002
0.005
4
1
1
4
3
SA102-620
10.080
0.528
1.160
1.095
1.063
0.007
0.002
0.003
0.004
0.020
6
3
3
6
5
SA102-625
8.889
0.300
0.609
0.560
0.076
0.003
0.001
0.001
0.008
0.010
4
2
2
4
1
SA103-462
10.119
0.292
0.617
0.568
0.095
0.003
0.007
0.006
0.021
0.011
6
5
4
6
5
SA103-483
8.342
0.227
-
0.421
0.099
0.001
0.001
-
0.001
0.001
1
1
0
1
1
SA104-337
11.216
0.388
0.820
0.771
0.376
0.009
0.006
0.015
0.017
0.007
4
3
4
4
3
SA104-461
9.705
0.290
0.567
0.488
-0.025
0.015
0.003
0.009
0.015
0.014
2
2
2
2
2
SA105-205
8.820
-
-
1.356
1.578
0.012
-
-
0.004
0.017
3
0
0
3
3
SA106-700
9.783
0.631
1.340
1.371
1.546
0.005
0.010
0.001
0.010
0.015
6
1
1
5
3
SA107-592
11.856
-
-
1.323
-
0.001
-
-
0.009
-
1
0
0
1
0
SA108-475
11.319
0.672
1.403
1.377
1.437
0.012
0.006
0.008
0.008
0.014
15
6
9
14
2
SA108-551
10.706
0.119
0.214
0.177
0.153
0.001
0.006
0.002
0.005
0.004
19
6
14
16
15
SA108-827
7.957
-
-
1.310
-
0.001
-
-
0.001
-
1
0
0
1
0
SA109-231
9.331
-
-
1.454
1.586
0.002
-
-
0.000
0.002
7
0
0
7
5
SA109-243
11.954
-
-
0.590
0.312
0.004
-
-
0.005
0.003
1
0
0
1
1
SA109-255
11.142
-
1.009
0.939
0.632
0.002
-
0.003
0.003
0.003
1
0
1
1
1
SA110-280
13.000
-
-
2.130
-
0.001
-
-
0.003
-
2
0
0
1
0
SA110-355
11.953
-
-
1.049
-
0.001
-
-
0.001
-
2
0
0
2
0
SA110-450
11.574
-
1.217
0.981
0.594
0.011
-
0.009
0.014
0.002
5
0
5
5
3
SA111-2522
9.688
-
0.264
0.170
-0.390
0.011
-
0.008
0.009
0.023
3
0
3
3
3
SA111-717
8.530
-
0.469
0.424
0.186
0.001
-
0.006
0.008
0.001
2
0
2
2
1
SA111-773
8.968
0.139
0.269
0.205
-0.193
0.003
0.008
0.001
0.001
0.007
8
2
8
8
5
SA111-775
10.749
0.912
1.864
1.710
1.912
0.004
0.006
0.009
0.006
0.008
13
3
8
12
12
SA112-223
11.429
0.266
0.544
0.457
0.032
0.002
0.000
0.003
0.001
0.005
15
4
12
14
13
SA112-250
12.108
-
0.632
0.536
-0.005
0.002
-
0.004
0.004
0.004
8
0
8
8
8
SA112-275
9.914
0.570
1.210
1.210
1.281
0.002
0.001
0.007
0.000
0.001
16
2
4
15
13
SA112-805
12.095
0.091
0.153
0.141
0.170
0.002
0.001
0.003
0.003
0.005
16
4
11
13
11
SA112-810
10.576
-
1.095
1.148
1.142
0.001
-
0.001
0.002
0.002
1
0
1
1
1
SA112-822
11.553
0.491
1.042
1.044
0.921
0.004
0.009
0.007
0.007
0.024
13
3
8
13
12
SA113-259
11.752
-
1.161
1.211
1.186
0.006
-
0.013
0.003
0.023
3
0
3
3
3
SA113-269
9.489
-
-
1.119
1.051
0.003
-
-
0.009
0.008
2
0
0
2
2
SA113-274
8.829
-
-
0.483
0.007
0.001
-
-
0.001
0.003
1
0
0
1
1
SA113-276
9.080
-
-
0.653
0.220
0.000
-
-
0.000
0.006
2
0
0
2
2
SA113-466
10.012
-
0.546
0.459
0.016
0.005
-
0.006
0.005
0.002
5
0
5
5
5
SA113-475
10.315
-
1.065
1.067
0.845
0.005
-
0.011
0.004
0.006
6
0
6
6
6
SA114-670
11.118
0.578
1.212
1.209
1.219
0.000
0.001
0.004
0.003
0.003
19
1
17
17
13
SA114-750
11.924
-0.011
0.026
-0.056
-0.355
0.005
0.001
0.000
0.002
0.007
19
2
17
17
12
SA114-755
10.914
0.309
0.618
0.573
-0.004
0.000
0.002
0.003
0.000
0.002
14
1
12
12
6
SA115-349
8.585
-
-
1.077
0.909
0.001
-
-
0.001
0.001
1
0
0
1
1
SA115-420
11.177
0.275
0.570
0.474
-0.009
0.010
0.005
0.011
0.012
0.014
2
2
2
2
2
SA115-427
8.865
-
-
1.170
1.120
0.001
-
-
0.001
0.001
1
0
0
1
1
III Comparisons with Landolt’s Photometry
Small systematic differences between the SAAO system and Landolt’s version is well known (M91), and is confirmed by SB00. We compare our data with L83 and L92 in Figures 8 and 9 for the 2k CCD and in Figures 10 and 11 for the 4k CCD. The difference (Landolt - our data) is shown plotted against an appropriate color. In addition, we superimpose the mean line of the systematic difference between the SAAO system and Landolt system from M91. The differences between our data and Landolt’s photometry follows well the trend obtained by M91, and therefore we could confirm again the differences between the two systems. This fact indirectly implies that we have reproduced the SAAO system at MAO. We will make some notes on each color in this section.


(a)
M91 did not make any comparison with L83, and we did not observe many standard stars in with the 2k CCD at MAO, therefore we derived the transformation relation only for the 4k CCD. There is no remarkable difference between our data and L83 or L92. The two data sets match well within 2 with a standard deviation of 0.01
(b)
The difference between the SAAO system and Landolt’s data in is not large (less than 0.01 ) for 0 – 2, but the Landolt data are redder for bluer or redder stars. We could not confirm the difference for red stars () due to the lack of very red stars in our data. But our 2k data show clearly that L83 data are redder than ours for blue stars, which is the same trend found by M91.
(c)
M91 found that Landolt data are slightly brighter (about 5 ) for and has a color dependency for bluer stars (). We could not confirm the color dependency for blue stars from the 2k CCD data. But we could confirm the zero point difference of about 5 (3.6–9.7 ). The distribution of of the 4k data well follows the trend obtained by M91.
(d)
Differences between the two standard systems in shows a sinusoidal-like curve against . As the SAAO system well reproduced the original Johnson’s (Cousins 1984), this implies that Landolt’s filter is more affected by the size of the Balmer jump or the strength of the hydrogen lines. The average zero point difference between our data and L83 or L92 is small, i.e. less than 5 with a standard deviation of about 0.01 , but the differences against for both L83 and L92 well follow the trend found by M91. This implies that L92 has the same difference relative to the SAAO system.
(e)
Although systematic differences exist between the SAAO system and the Landolt system, the differences in most color indices are quite small ( ) for normal stars ( or ). But the difference in is too large to be ignored. Although the scale of the SAAO system is slightly different from that of Johnson (Cousins 1984), the difference is very small (about 0.01 ). The difference therefore between the SAAO system and the Landolt standard is due to the departure of Landolt’s from the Johnson standard system color. Such a large difference may cause problems in reddening estimates as well as in determining the temperature of hot stars.
As shown in Figures 5 and 6, our scale well matches that of the SAAO scale within 3.6 . In addition there is no systematic difference betweem them. We compare our with Landolt values in the lower two panels of Figures 8 – 11. As already confirmed by SB00, we could confirm the systematic differences in our new data obtained at MAO. The dotted line in versus is from M91, and that in versus is from Bessell (1995). The difference follows the same trends found by M91 and Bessell (1995). But for = 0.5 – 1.0 the difference seems to be more negative, while for the trend is more positive. Such a larger difference should be confirmed from more observations.

Table 4.
Seasonal mean value of extinction coefficients
Season
Spring
Summer
Fall
Winter
0.522 0.015
0.520 0.088
0.453 0.060
0.419 0.012
0.326 0.034
0.301 0.022
0.248 0.017
0.238 0.018
0.217 0.018
0.193 0.026
0.141 0.018
0.132 0.009
0.176 0.033
0.118
0.093 0.001
0.085 0.009
0.115 0.017
0.091 0.031
0.051 0.006
0.041 0.012
1.88 0.09
2.28 0.14
2.75 0.04
2.93 0.10
IV DICUSSION
(a) The Characteristics of Atmospheric Extinction
We have already shown the yearly variation of the atmospheric extinction coefficients at MAO in §. There is an obvious seasonal variation of the primary extinction coefficients. It is valuable to investigate the main source of extinction.
Atmospheric extinction is mainly caused by scattering of light by air molecules and small particles swept up in the earth’s atmosphere. The scattering efficiency is a function of wavelength. And therefore the relation between atmospheric extinction coefficients and wavelength of light can be expressed by
| (3) |
where , , and represent, respectively, the extinction coefficient, an appropriate constant, and the mean wavelength of filter (Golay 1974). If the extinction is caused solely by pure air molecules, i.e. Rayleigh scattering, then . While if the source of scattering is due to aerosol pollutants and fine dust, then is between 1 and 2.
To investigate the seasonal variation of scattering sources we averaged the extinction coefficients for a given season and present them in Table 4. On 2006, August 22 all extinction coefficients were abnormally large, and these data were excluded in the average. We also drew the mean extinction coefficient against wavelength in Figure 12. The mean wavelength for each passband was obtained from Bessell (1990). The starting date of each season is March 21, June 22, September 23, and December , respectively. The calculated power is also presented in the bottom line of Table 4.
Spring is the worst season for observing at MAO and the number of photometric nights was only two. The resultant power may be biased and therefore less meaningful.
As already shown in Figure 1, the extinction coefficients show a large scatter in summer, especially in and . Summer at MAO is famous for its many successively clear days during which we can easily see dust lanes in the atmosphere. The summer extinction is consequently strongly affected by the dust and as a result the power is about 2, which is smaller than that in fall or winter.
In fall and winter, the mean values of the atmospheric extinction coefficients are smaller and the power is between 2.7 and 2.9 indicating that Rayleigh scattering is the main source of extinction in these seasons. This value is very similar to that at SSO (calculated from the mean extinction coefficients in SB00).
(b) Variable Star Candidates
The constancy of standard stars is very important in precision photometry. If variable stars are included in the observations, larger errors in the extinction coefficients, transformation relations, and photometric zero points are unavoidable. From repeated observations of standard stars, we found several variable candidates.
Table 5.
Variable candidates from Menzies et al (1991)
Star
reference
CCD
Remark
HD173637
0.074
M91
-
1
2k CCD
V455 Sct
SA109-537
-0.019
M91
0.016
4
2k CCD
-0.020
M91
0.022
8
4k CCD
SA110-353
0.039
M91
-
1
4k CCD
SA110-441
0.022
M91
0.014
6
2k CCD
0.003
M91
-
1
4k CCD
SA111-1969
-0.090
M91
0.023
3
2k CCD
-0.046
M91
0.091
11
4k CCD
SA111-2009
-0.047
M91
0.035
3
2k CCD
0.042
M91
0.052
10
4k CCD
SA97-345
-0.126
L92
0.163
3
4k CCD
SA98-733
-0.011
L92
0.038
7
4k CCD
SA107-456
-0.010
L92
0.032
7
4k CCD
SA107-458
-0.018
L92
0.033
7
4k CCD
SA107-459
-0.016
L92
0.033
7
4k CCD
SA107-602
-0.019
L92
0.031
7
4k CCD
SA110-266
0.000
L92
0.048
5
4k CCD
SA110-361
0.001
L92
0.040
5
4k CCD
SA111-1925
-0.067
L92
0.039
3
2k CCD
0.020
L92
0.083
7
4k CCD
SA111-1965
-0.089
L92
0.091
3
2k CCD
0.028
L92
0.086
6
4k CCD
SA113-260
0.036
L92
0.041
3
4k CCD
SA113-272
0.022
L92
0.045
3
4k CCD
SA113-366
0.049
L92
0.032
3
4k CCD
SA113-372
0.039
L92
0.043
3
4k CCD
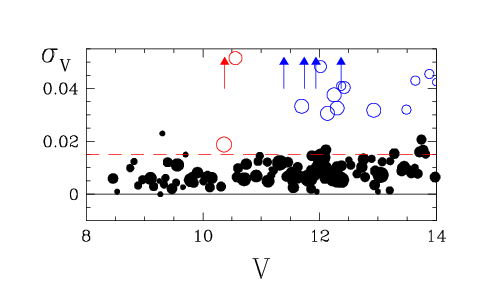
The criteria of identifying variable candidates observed with the 2k CCD are either a large difference in relative to the catalogued value or a larger scatter in ( if the number of observations were over 3). We also confirmed the variable candidates observed with the 4k CCD in the same way as for the 2k data for the standard stars in M91 or L92. These variable candidates are listed in Table 5 and the versus diagram is shown in Figure 13.
Two known red variables in M91 (BD+1 4774 = BR Psc and GL628 = V2306 oph) were observed only once each, but did not show a large difference in . Another known variable HD 173637 (= V455 Sct) did show a large difference in and is listed in Table 5. Sixteen variable candidates were found in L92. Two of them (SA111-1925 and SA111-1965) were already detected through their variability with the 2k CCD. The candidates showed large standard deviations in both data sets. SA97-345 showed very large standard deviations as well as large differences between our data and the L92 data. The star was observed three times. In 2006 December 26 the star was fainter by about than on the other days. Other candidates were observed fewer than ten times therefore more observations of these stars are required to confirm the variability clearly.
V SUMMARY
We observed many standard stars from Menzies et al. (1991) and Kilkenny et al. (1998) at Maidanak Astronomical Observatory in Uzbekistan to derive the standard transformation relations for the AZT-22 1.5m telescope. The results from these observations are as follows.
1) We determined the atmospheric extinction coefficients for photometric nights. The primary extinction coefficients show an evident seasonal variation. We tried to interpret the characteristics of the atmospheric extinction in the context of scattering sources. In the summer, the extinction seems to be strongly affected by the dust in the atmosphere, while in fall and winter, Rayleigh scattering due to air molecules seems to be the dominant source of extinction.
2) We derived the standard transformation relations both for the SITe 2000 800 CCD and the Fairchild 486 4k CCD. Transformation to the standard system is mostly possible with one or two straight lines for all bands except for with the Fairchild 486 CCD where we found a non-linear correction term related to the size of the Balmer discontinuity or the strength of the hydrogen lines.
3) All photometric data were transformed to the SAAO standard system and we found that our data are well consistent with SAAO zeropoints within a few with a standard deviation of about 0.01 . In the standard deviation of the differences was somewhat large (0.02 – 0.03 ). Such a large scatter in is very likely due to the SAAO data which was obtained with a small telescope ().
4) We also confirmed the mostly small differences between the SAAO system and the Landolt version. The differences in , , , and are systematic, but not very large. But that in is quite large and systematic. The large difference between standard systems in may cause problems in the determination of stellar parameters of early type stars.
5) From repeated observations of standard stars we found large differences or a large scatter in for some stars. We presented these variable candidates in Table 5.
ACKNOWLEDGEMENTS
This work is supported by the Astrophysical Research Center for the Structure and Evolution of the Cosmos (ARCSEC ′′) at Sejong University.
References
- Bessell, M. S. 2006, Standard Photometric Systems, ARAA, 43, 293
- Bessell, M. S. 1990, Passbands, PASP, 102, 1181
- Bessell, M. S. 1995, Systems: Resolving Different Versions , PASP, 107, 672
- Cousins, A. W. J. 1978, Intrinsic Lines in the Cape-Kron System, MNSSA, 37, 62
- Golay, M. 1974, in Introduction to Astronomical photometry, D. Reidel, Dordrecht, p48
- Johnson, H. L., & Morgan, W. W. 1953, Fundermental Stellar Photometry for Standards of Spectral Type on the Revised System of the Yerkes Spectral Atlas, ApJ, 117, 313
- Johnson, H. L. 1966, Astronomical Measurements in the Infrared, Ann. Rev. A & A, 4, 193
- Kilkenny, D., Van Wyk, F., Roberts, G., Marang, F., & Cooper, D. 1998, Supplementary southern standards for photometry, MNRAS, 294, 93
- Landolt, A. U. 1973, UBV photoelectric sequences in the celestial equatorial Selected Areas 92-115, AJ, 78, 959
- Landolt, A. U. 1983, photometric standard stars around the celestial equator, AJ, 88, 439 (L83)
- Landolt, A. U. 1992, Photometric Standard Stars in the Magnitude Range 11.5 Around the Celestial Equator, AJ, 104, 340 (L92)
- Landolt, A. U. 2007, Photometric Standard Stars around the Sky at Declination, AJ, 133, 2502
- Lim, B. D., Sung, H., Karimov, R., & Ibrahimov, M. 2008, Characteristics of The Fairchild 486 CCD at Maidanak Astronomical Observatory in Uzbekistan, PKAS, 23, 1
- Menzies, J. W., Marang, F., Laing, J. D., Coulson, I. M., & Engelbrecht, C. A. 1991, photometry of equatorial standard stars. A direct comparison between the northern and southern systemsm, MNRAS, 248, 642 (M91)
- Sung, H. & Bessell, M. S. 2000, Standard Stars: CCD photometry, Transformations and Comparisons, PASA, 17, 244 (SB00)
- Sung, H., Bessell, M. S., & Lee, S.-W. 1998, and Photometry of the Young Open Cluster NGC 6231, AJ, 115, 734
- Sung, H. 1995, Photometry of 8 Young Open Cluters, PhD Thesis, Seoul National University
- Sung, H. et al. 2001, Photometry Accuracy of the SITe 2k CCD at BOAO, Korean Astronmical Observatory, Technical report, no.01-002-039
- Sung, H., Ibrahimov, M., Kahharov, B. & Karimov, R. 2005, Standard Transformation Relation of UBAI AZT-22 1.5m Telescope, BKAS, v.30, no.1, pp.73.2-73.2