The AGN component in deep radio fields:
Results from the First Look Survey
Abstract:
We are currently exploiting the deep radio/optical/IR information available for the extra-galactic component of the Spitzer First Look Survey (FLS) to investigate the physical properties of faint radio-selected AGNs, with the aim of studying the AGN component of sub–mJy radio fields. One of the key unresolved issues is whether, as a function of cosmic epoch, low-power AGNs are more related to efficiently accreting systems (mostly radio-quiet) or to systems with very low accretion rates (mostly radio-loud). Here we present a sample of optically identified radio-emitting AGNs extracted from the FLS. Preliminary results show that at the flux densities probed by the FLS ( Jy) we still have a significant number of radio–loud AGNs, similarly to what found in ’brighter’ sub–mJy radio samples. Very interestingly, however, we have also a clear and direct evidence of a population of radio–emitting AGNs in the FLS, whose properties are consistent with those expected from existing radio–quiet AGN modeling. Such AGNs could be recognised as such thanks to the availability of IR colors which proved to be especially useful to efficiently separate radio sources triggered by AGNs, from sources triggered by star-formation. This latter result supports the idea that radio–quiet AGNs are not necessarily radio silent, and very promisingly may indicate that the bulk of the radio–quiet AGN population could emerge from studies of deeper radio samples.
June 02 - 05 2009
Groningen, the Netherlands
1 Scientific background
After a decade of multi-wavelength studies of deep radio fields
it is rather clear that star-forming galaxies dominate at
microJy (Jy) levels, while radio sources associated to
early–type galaxies, and plausibly triggered by AGNs, are the most
significant source component at flux densities Jy
( of the total) with a further 10% contribution from
broad-/narrow-line AGNs
(see e.g. [9, 19, 1, 16, 21]).
The somehow unexpected presence of large numbers of AGN–related sources at
sub-mJy fluxes has given a new interesting scientific perspective to the
study of deep radio fields. Of particular interest is the possibility of
studying the physical and evolutionary properties of such low power/high
redshift AGNs. One of the key unresolved issues
is for instance whether, as a function of cosmic epoch, the low-power AGNs
are more related to efficiently accreting systems - like
radio-intermediate/quiet quasars - or to systems with very low accretion rates
- like e.g. FRI radio galaxies ([5]). The
latter scenario (radio mode) is supported by the presence of many optically
inactive early type galaxies among the sub–mJy radio sources; whereas the
quasar mode scenario may be supported by the large number of so-called
radio-intermediate quasars observed at mJy levels (see e.g. [13])
and by the modeling work of [11], who predict large numbers
od radio-quiet AGNs at sub-mJy levels.
Assessing such a question would have relevant impact on topics
like: the role played by low accretion/radiative efficiency AGNs in the global
black-hole-accretion history of the Universe; the relative contribution of
radiative versus kinetic (jet-driven) feedback to the global AGN feedback in
models of galaxy formation; and, more generally, would allow us a better
understanding of the triggering mechanisms of AGN radio activity.
2 The First Look Survey
The First Look Survey was the first major scientific program carried
out by the Spitzer Space Telescope.
As part of the extragalactic component of the First Look Survey (FLS),
a region covering 4 square degrees and centered on RA=17:18:00,
DEC=59:30:00 was imaged, with the aim of studying a low Galactic Background
region to a significantly deeper level than any previous large-area
extragalactic infrared survey.
Such a survey was complemented by a smaller 0.75x0.3 sq. degr.
survey (’verification’ survey), lying in the same region, observed
to a factor of 3 deeper flux levels.
Spitzer images and source catalogues are available at 3.6, 4.5, 5.8, 8.0
m (IRAC, [14]) and at 24, 70, 160 m (MIPS,
[4, 6]), complemented by a large set of ancillary data taken
at different wave-bands: from deep optical imaging (R-band, [3];
u*-/g*-bands, [20]) and spectroscopy ([22, 18, 15])
to deep (rms noise level 23-30 muJy)
radio images at 1.4 GHz (VLA, [2]) and 610 MHz (GMRT, [7]).
A deeper (rms noise level 8.5 muJy) 1.4 GHz mosaic was obtained
at Westerbork for a 1 sq. degr. region covering the FLSv ([17]).
The availability of both deep radio and far-infrared data is of particular
interest, since we can exploit the well-known tight correlation
between far-IR and radio luminosities of star-forming galaxies
(see e.g. [10, 8])
to efficiently separate radio sources triggered by AGNs.
Very useful is also the availability of data at two radio frequencies – 0.61
and 1.4 GHz – which allows us to derive the source spectral index ().
This is important since different accreting regimes may display different
spectral signatures in the radio domain.
3 Derivation of source spectral index
Radio sources from VLA and GMRT catalogues were cross-identified, and radio spectral indices between 0.61 and 1.4 GHz were derived (see Fig. 1). As expected, most such objects are steep-spectrum radio sources (). Nevertheless the spread in the spectral distribution is wide, with a significant number of flat () or inverted sources (). This indicates the presence of an heterogeneous population, consisting in a mixture of flat/steep-spectrum AGNs and steep star-forming galaxies. A number of ultra-steep spectrum sources () could be ascribed to a population of high-redshift galaxies.


4 Multi-wavelength analysis of FLS radio sources: radio–loud AGNs
The two-frequency FLS radio catalogue was cross-correlated with the
Spitzer IRAC multi-color (3.6, 4.5, 5.8, 8.0 m) catalogue ([14]),
with the MIPS 24 m catalogue ([4]) and with the
optical spectroscopy catalogues of [15] and [18].
Identifying the optical counterpart of the
sources is crucial to get information on both the galaxy redshift and
classification (broad/narrow-line AGN, star-forming or early-type galaxy).
An optical identification was
found for of the sources, most of which have a measured redshift.
In the following we will focus on the
sample of optically identified sources, and use it to extract from the
FLS a robust sub-sample of radio-emitting AGNs.
A first analysis of the multi-wavelength properties of the optically
identified
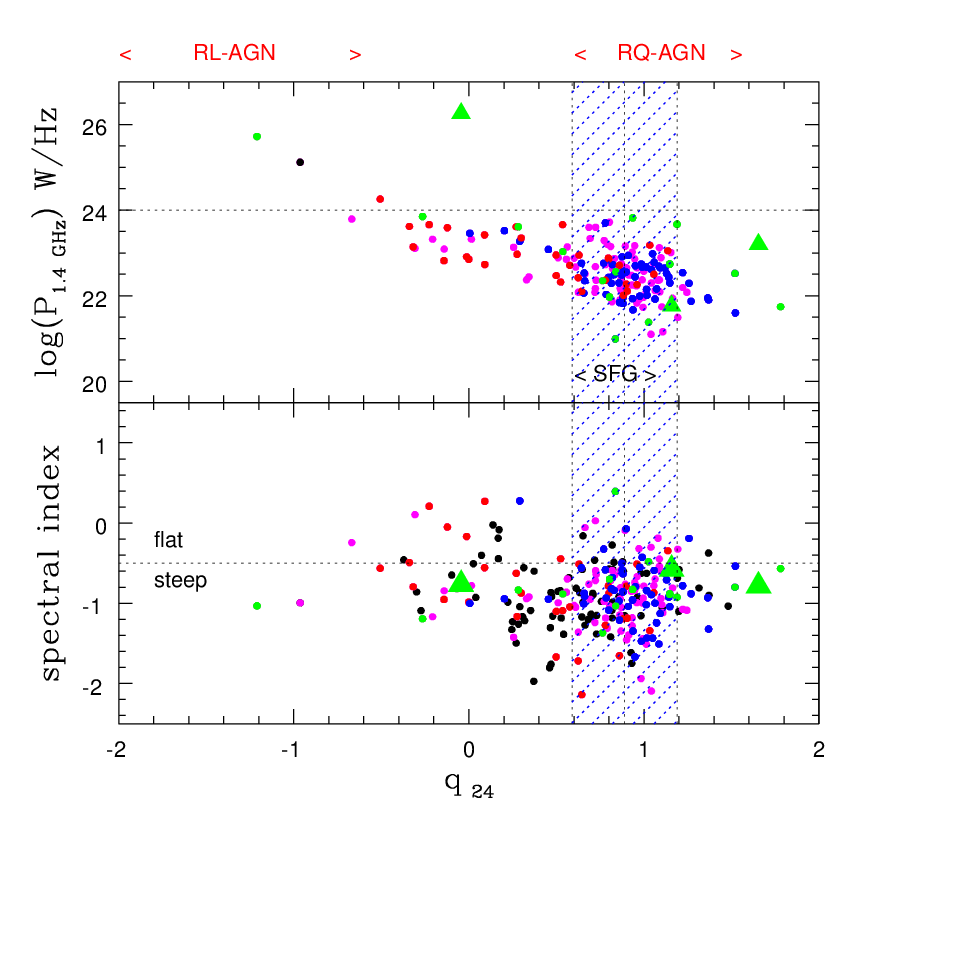
radio sources in the FLS is illustrated in Figure 2, where
we plot the 1.4 GHz radio power (top) and the 0.61-1.4 GHz spectral index
(bottom) as a function of the so-called parameter, defined as
the ratio between the 24 m and the 1.4 GHz source flux density
(). The value range allowed
for
star-forming galaxies is shown by the blue shaded region ([15]).
Radio-loud AGNs are located at the left side of such region (corresponding to
an excess of radio emission with respect to infrared).
As found in ’brighter’ sub-mJy samples (see e.g. the ATESP sample,
[16]) we have a significant fraction of radio-loud AGNs in the FLS,
and among them we have several flat-/inverted–spectrum sources, whose
properties are currently under further analysis. Such radio–loud
AGNs have mostly low radio
powers ( W/Hz) and are preferentially identified with
early-type galaxies (shown in red) or weak narrow line systems (shown in
magenta). Such properties are consistent with those of low power (FRI-type)
radio galaxies, typically characterized by very low accretion rates.

5 Multi-wavelength analysis of FLS radio sources: radio–quiet AGNs
As shown in Figure 2 the bulk of the FLS radio sources are
characterized by , i.e. by values
consistent with the sources being star-forming galaxies.
Nevertheless only a fraction of such objects is optically classified as
star-forming galaxy (blue points). A few sources are instead optically
classified as AGNs (green points). Such AGNs represent
a first very clear direct evidence of a radio-quiet AGN population
showing up at the radio flux levels of the FLS.
In addition we have a few sources classified as
early-type galaxies (red points) and a significant fraction of sources
displaying narrow emission lines, which do not have a secure classification
(magenta points). Among such sources we may have several other hidden
radio–quiet AGNs.
In order to better disentangle radio sources triggered by star
formation from those triggered by AGNs, we exploit the available
IRAC colors. Figure 3 shows the IRAC color-color plot for
FLS sources with . As expected sources
optically classified as star-forming galaxies (blue points) are confirmed as
such by their IRAC colors, together with many of the sources with no secure
optical classification (magenta points). Nevertheless we have a fraction of
sources with typical AGN IRAC colors (objects falling in the pink region),
which can be considered as genuine radio-quiet AGNs.
Their radio properties ( W/Hz; steep radio spectrum,
see Figure 2)
are fully consistent with those expected for the radio-quiet AGN population
and, as expected, they are mostly associated to galaxies showing emission
lines in their optical spectra ([11, 12]).
6 Conclusions
We are currently exploiting the deep radio/optical/IR information available
for the FLS to investigate the physical properties of faint radio-selected
AGNs. Such a study is to be included in a more general analysis of several
radio deep fields with multi-wavelength information available, with the aim
of studying the AGN component of the sub-mJy radio fields.
Preliminary results show that the availability of IR colors
proves to be very useful in disentangling star-forming galaxies from
AGNs, allowing us to uncover a population of radio-quiet AGNs, which does not
emerge from the radio/optical analysis only.
The FLS radio-quiet AGN sample represents a first very clear direct evidence
of a radio-quiet AGN population showing up at 1.4 GHz flux densities of the
order of Jy, supporting the idea that radio-quiet AGNs are not
necessarily radio silent.
This result is very promising, possibly indicating that the bulk of the
radio-quiet AGN population may be discovered
going to deeper radio flux densities than the FLS flux
limit.
References
- [1] Afonso J., Mobasher B., Koekemoer A., Norris R.P., Cram L., 2006, AJ, 131, 1216
- [2] Condon J., Cotton W., Yin Q., et al. 2003, AJ, 125, 2411
- [3] Fadda D., Jannuzi B., Ford A., Storrie-Lombardi L.J. 2004, AJ, 128, 1
- [4] Fadda D., Marleau F.R., Storrie-Lombardi L.J., et al. 2006, AJ, 131, 2859
- [5] Fanaroff B.L., Riley J.M., 1974, MNRAS, 167P, 31F
- [6] Frayer D.T., Fadda D., Yan L., et al. 2006, AJ, 131, 250
- [7] Garn T., Green D.A., Hales S.E.G., Riley J.M., Alexander P. 2007, MNRAS, 376, 1251
- [8] Garrett M., 2002, A&A, 384, 19
- [9] Gruppioni C., Ciliegi P., Rowan-Robinson M., et al., 1999, MNRAS, 305, 297
- [10] Helou G., Soifer B., Rowan-Robinson M. 1985, AJ, 298, 7
- [11] Jarvis M.J. & Rawlings S., 2004, New Astron. Rev., 48, 1173
- [12] Kukula M.J., Dunlop J.S., Hughes D.H., Rawlings S. 1998, MNRAS, 297, 366
- [13] Lacy M., Laurent-Muehleisen S.A., Ridgway S.E., Becker R.H., White R.L., 2001, ApJ, 551, L17
- [14] Lacy M., Wilson G., Masci F., et al. 2005, ApJS, 161, 41
- [15] Marleau F.R., Fadda D., Appleton P.N., et al. 2007, ApJ, 663, 218
- [16] Mignano A., Prandoni I., Gregorini L., et al. 2008, A&A, 477, 459
- [17] Morganti R., Garrett M., Chapman S., et al. 2004, A&A, 424, 371
- [18] Papovich C., Cool R., Eisenstein D., et al. 2006, AJ 132, 231
- [19] Prandoni I., Gregorini L., Parma P., et al., 2001, A&A, 369, 787
- [20] Shim H., Im M., Pak S., et al. 2006, ApJS, 164, 435
- [21] Smolcic V., Schinnerer E., Scodeggio M., et al. 2008, ApJS, 177, 14
- [22] Stoughton C., Lupton R.H., Bernardi M., et al. 2002, AJ, 123, 485