Minimizing the Dick Effect in an Optical Lattice Clock
Abstract
We discuss the minimization of the Dick effect in an optical lattice clock. We show that optimizing the time sequence of operation of the clock can lead to a significant reduction of the clock stability degradation by the frequency noise of the interrogation laser. By using a non-destructive detection of the atoms, we are able to recycle most of the atoms between cycles and consequently to strongly reduce the time spent capturing the atoms in each cycle. With optimized parameters, we expect a fractional Allan deviation better than for the lattice clock.
I Introduction
Combined with a superb frequency accuracy, superior ultimate stabilities have been advocated as appealing advantages of optical lattice clocks [1]. In such devices, optical resonances with linewidth down to 2 Hz have been observed [2]. For a typical atom number of the corresponding standard quantum limit of the clock Allan deviation lies below with being the averaging time in seconds. While vast improvements have been performed over the last few years [3, 4, 5, 6], the stability of actual lattice clocks is presently more than two orders of magnitude above this “Holy Grail”. One stumbles upon the Dick effect, by which the probe laser frequency noise is converted down to low Fourier frequencies by the sampling process inherent to the clock’s cyclic operation [7, 8, 9]. A strenuous effort is presently going on to further reduce the noise of ultra-stable laser sources [10, 11, 12, 13, 14] but quite hard limitations like the thermal noise of high finesse Fabry-Pérot cavities limit progress in that direction [15]. Comparatively little effort has been put so far on the optimization of the time sequence for the operation of lattice clocks for reducing the Dick effect. We show here that following this direction can lead to very significant improvements.
A key parameter for the Dick effect is the dead time of the clock cycle, during which atoms are prepared (captured, cooled, optically pumped) and detected and do not experience the probe laser frequency noise. This loss of information leads to the frequency stability degradation. In order to dwarf the dead time of the experiment, we propose to keep the atoms from one clock cycle to the next which is made possible by a non-destructive measurement scheme [16]. We discuss here in detail the potential gain in terms of frequency stability that can be achieved using this detection scheme.
In section II, we give a quantitative discussion of the Dick effect in the limit where the dead time approaches 0. We show that for dead times below 100 ms, the limitation of the Allan deviation due to the Dick effect can be reduced to below using Ramsey spectroscopy and state-of-the-art ultra-stable lasers. In section III the new non-destructive detection scheme is described. Finally, section IV discusses the optimization of a Sr lattice clock sequence using the non-destructive scheme, and gives an estimate on the expected stability of the clock.
II The Dick Effect in the Low Dead Time Limit
In a sequentially operated atomic clock, the response of the atoms to the interrogation oscillator frequency fluctuations is dictated by the sensitivity function . The change in transition probability due to frequency noise is given by
| (1) |
where the integral is taken over one clock cycle. The appearance of depends on the type of interrogation used. In an optical lattice clock either Rabi or Ramsey interrogation can be used. We call the duration of the interrogation -pulse in the Rabi case and the duration of each of the two -pulses and the free evolution time in the Ramsey case. We define the duty cycle (Rabi) and (Ramsey) with being the duration of the clock cycle.

Fig. 1 gives a clear graphic illustration of the Dick effect and of the role of the dead time. The figure shows numerically generated noise around the cycle frequency with a bandwidth of . The noise of the oscillator enters in the clock measurement as the time average of weighted by , according to Eq. (1). For a small duty cycle (squares in Fig. 1) only the maxima of the relevant noise components contribute to the measurement, resulting in a large dispersion of the measured frequency. When the duty cycle approaches 1, the sensitivity function comprises almost the totality of each cycle, and the frequency fluctuations of the interrogation oscillator are averaged out. This averaging effect is almost perfect in the case of Ramsey interaction (stars in Fig. 1 for ) since the sensitivity function is a constant during the free evolution period. As the dead time used to prepare and detect atoms approaches 0, the measurement noise totally vanishes provided the interrogation pulses are kept short enough (). The situation is quite different for Rabi interrogation (circles in Fig. 1), since the sinusoidal shape of enfeebles the efficiency of the averaging process. The averaging effect and the different behavior depending on the interrogation scheme is further illustrated in Fig. 2, where the Allan deviation as a function of the duty cycle is plotted 11 1 For illustration purposes we chose to plot Fig. 2 in the case where the interrogation laser exhibits white frequency noise. This is the only type of noise where the Allan deviation only depends on the duty cycle, and not on the specific parameters chosen. For subsequent discussion, however, we will assume a more experimentally realistic flicker frequency noise.. Due to this clear advantage of Ramsey interrogation, we restrict further analysis to this case only.

The limitation of the fractional Allan variance due to the interrogation laser frequency noise is given by [8]
| (2) |
where is the one-sided power spectral density of the relative frequency fluctuations of the free running interrogation oscillator taken at Fourier frequencies . The Fourier coefficients of are given by
| (3) |
State-of-the-art interrogation laser stabilization is performed by locking the laser frequency to an ultra-stable Fabry-Perot cavity. In the following, we assume that the dominant source of noise is the thermal noise of the cavity with being the clock frequency (Hz for a Sr lattice clock). We take Hz4 which is a worst case estimate for the ULE cavity with fused silica mirrors described in [14]. It corresponds to a constant Allan standard deviation of .

Figure 3 displays the Allan deviation computed numerically using (2) as a function of dead time for various . We choose ms which is significantly shorter than the shortest considered here and still long enough to keep the dependent frequency shifts (light shift, line pulling by other atomic resonances, etc…) reasonably small (see [17] and references therein). Fig. 3 is another illustration of the averaging process discussed above. In present optical lattice clocks, the dead time is on the order of 1 s and the limitation of the clock stability due to the Dick effect is close22 2 Measured Allan deviations are somehow higher than the value calculated here (experimental state-of-the-art value is about for one second [18]). This results mainly from the fact that the interrogation lasers used for these experiments are referenced to cavities with ULE mirror substrates, which exhibit substantially higher thermal noise than the cavities considered here. to . Reducing this dead time down to 10 ms would improve the clock stability by almost two orders of magnitude. This consideration motivated the development of the non-destructive detection scheme which is presented in the next section. Note also that for a given dead time, it is desirable to lengthen as much as possible the Ramsey interaction. This is true as long as the linear model giving Eq. (1) and (2) holds, i.e. as long as the interrogation laser frequency fluctuations remain much smaller than the width of the Ramsey fringes. With the level of noise chosen for plotting Fig. 3 - that is, frequency fluctuations of the interrogation oscillator on the order of Hz - the model therefore holds for Ramsey times up to about 200 ms.
III Non-Destructive Measurement
We briefly recall here the main features of the detection scheme which allows optimization of the clock stability as discussed in section IV. More details can be found in [16].
III-A Experimental Setup
The scheme is based on the measurement of the phase shift accumulated by a weak probe beam tuned close to an atomic resonance when passing through the atomic cloud [19, 20].


If the atomic resonance involves one of the two clock states, the accumulated phase gives a measure of the number of atoms that populate this state. When imposed after the clock interrogation, the phase measurement can then yield the clock transition probability.
We have chosen to operate with the transition (the relevant energy levels of Sr are plotted in Fig. 4), for which the expected phase shift is plotted in Fig. 5. Two frequency components detuned symmetrically around the resonance accumulate opposite phase shifts while passing through the atomic cloud. Their difference therefore gives a differential measure of the number of atoms. This is implemented using the first modulation sidebands induced by an electro-optic phase modulator (EOM) in a Mach-Zender interferometer (MZI) as sketched in Fig. 6.
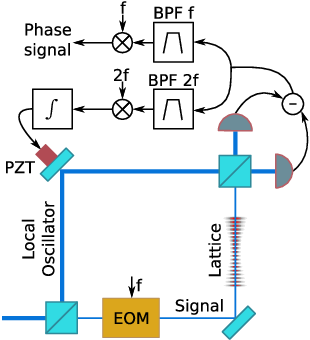
A laser beam tuned to the transition is split into a weak signal and a strong local oscillator (LO). Their power is a few nW and a couple of mW, respectively. The phase of the signal beam is modulated at MHz by the EOM before traveling through the atomic sample in the optical lattice. The electric field of the signal beam is detected by a homodyne detection. The signal interferes with the LO on the beam splitter closing the MZI and the light intensities in each output arm of the beam splitter are measured with fast Si photodiodes and electrically subtracted. The output signal component at frequency is then demodulated, giving a measure of the phase difference accumulated by the first sidebands. It should be noted that this measurement is highly differential, being immune to first order to the probe laser frequency and amplitude noise, as well as to fluctuations of the optical propagation lengths.
III-B Performance of the Detection Scheme

The atomic population in is measured by applying two consecutive probe pulses of duration ms and typical power nW ( nW, with being the detection efficiency). The two pulses are separated by a 7 ms interval during which the atoms are optically pumped in the dark states and using the and transitions (Fig. 4). The second probe pulse does not experience the atomic phase shift and then acts as a phase reference. A typical noise spectrum of the phase signal is shown in Fig. 7. It is shot noise limited for Fourier frequencies higher than 10 Hz. The noise of the resulting signal, as measured with no atoms in the lattice, is 0.4 mrad RMS for nW and scales as .
With about atoms in the lattice, the measured phase shift is 40 mrad corresponding to a SNR of 100 per cycle, which is close to the expected atomic quantum projection noise.
The measurement of the absolute transition probability associated with the interrogation of the atomic ensemble with our clock laser involves a third probe pulse to determine the total atom number. The measured noise on the transition probability is % RMS with the previous parameters, varying as for up to . A typical spectrum of the clock transition acquired with this method is shown in figure 4.
Finally, a key aspect of the detection scheme performance is the ability to recycle the atoms from one cycle to the other. The fraction of atoms remaining in the lattice after the detection pulses is measured to be larger than 0.95 for a lattice depth of 200 .
IV Optimization of the Strontium Clock Time Sequence
The time sequence for operation of the Sr lattice clock is sketched in Fig. 8. The dead time can be split up into two components, , where is the capture time for the atoms, and is the time used for cooling, optical pumping, and detection of the atoms. The present minimum residual dead time of the sequence is ms, mainly limited by the duration of the narrow line cooling in the lattice referred to as “Red cooling” on the figure. The duration of this cooling was adjusted so as to optimize the atomic temperature in the lattice at a fixed laser frequency and power. By allowing a variation of these parameters the duration could certainly be shortened significantly. However, to give a conservative estimate of the optimized clock stability we keep this duration at its present value. The two parameters left for optimization are therefore the duration of the capture phase (“MOT+Drain” on Fig. 8) and the Ramsey interrogation time .

The optimal time sequence results from a balance between the Dick effect and the detection noise. Taking both into account, the Allan variance of the clock is given by
| (4) |
where is defined in section II and is given by [8]
| (5) |
and being the atomic quality factor and the standard deviation of the detected transition probability. scales as the inverse of the atom number up to for which as described in section III-B.
The non-destructive detection scheme allows recycling of the atoms, so that the number of atoms after cycle is given by
| (6) | |||||
where is the number of atoms loaded into the optical lattice in each cycle, is the lifetime of the cold atoms in the lattice, and is, for a given , the maximally achievable number of atoms in the trap, that is for . is the fraction of atoms kept in the trap after a cycle. For our experiment, /s, s and .
From Eq. (6) we get the steady-state number of atoms
| (7) |
which can be used to find and hence using Eq. (5), thus enabling us to express as a function of only and .

Fig. 9 displays as a function of both and . To remain in the validity domain of the model, we limited the range of variation of up to 200 ms as for Fig. 3. Once again, the optimal is the longest allowed one, ms. The corresponding optimal value for the loading time is ms giving . The individual contributions of the Dick effect and of the detection noise are and , respectively. Finally, the steady-state number of atoms in the optimized configuration is .
The individual contributions to s) for ms are shown in Fig. 10. The contribution from the quantum projection noise also is included in the plot, showing that is still well above the quantum limit, leaving room for further improvements. These improvements would include increasing the trap lifetime and reducing the residual dead time as well as enhancing the coherence time of the interrogation laser.

V Conclusion
We have shown that in parallel to the reduction of the interrogation laser frequency noise, the optimization of the time sequence could be a very efficient way to minimize the Dick effect in optical lattice clocks. By using a non-destructive detection scheme together with an adapted time sequence, the Allan deviation of our clock could be optimized down to below , which would outperform current state-of-the-art by about one order of magnitude.
Though very encouraging, this result is still about one order of magnitude above the expected quantum limit of the clock. In the optimized time sequence presented in section IV the duty cycle is “only” and large room for improvement remains. Cooling the atoms down to their minimal temperature presently takes 45 ms which could probably be strongly reduced by using a more sophisticated time sequence, for instance allowing both the frequency and power of the cooling laser to vary during this phase. On the other hand, the lifetime of the atoms in the lattice is presently 1.5 s, so that about 20 % of the atoms need to be reloaded at each cycle. This leads to a relatively long loading time of 69 ms in the optimized configuration. We have not yet investigated in detail the limiting factors of this lifetime in our setup but we see no fundamental reasons preventing atoms from being kept in the lattice for ten seconds or more. With such a lifetime, one would take full advantage of the non-destructive detection scheme described in section III, giving a s) on the order of or below.
SYRTE is a member of IFRAF (Institut Francilien de Recherche sur les Atomes Froids). This work has received funding from the European Community’s Seventh Framework Programme, ERA-NET Plus, under Grant Agreement No. 217257, as well as from IFRAF, CNES and ESA.
References
- [1] H. Katori, M. Takamoto, V. G. Pal’chikov, and V. D. Ovsiannikov, “Ultrastable optical clock with neutral atoms in an engineered light shift trap,” Phys. Rev. Lett., vol. 91, p. 173005, 2003.
- [2] M. M. Boyd, T. Zelevinsky, A. D. Ludlow, S. M. Foreman, S. Blatt, T. Ido, and J. Ye, “Optical atomic coherence at the 1-second time scale,” Science, vol. 314, no. 5804, pp. 1430–1433, 2006.
- [3] F.-L. Hong, M. Musha, M. Takamoto, H. Inaba, S. Yanagimachi, A. Takamizawa, K. Watabe, T. Ikegami, M. Imae, Y. Fujii, M. Amemiya, K. Nakagawa, K. Ueda, and H. Katori, “Measuring the frequency of a Sr optical lattice clock using a 120-km coherent optical transfer,” arXiv:0811.1816, 2008.
- [4] X. Baillard, M. Fouché, R. Le Targat, P. G. Westergaard, A. Lecallier, F. Chapelet, M. Abgrall, G. D. Rovera, P. Laurent, P. Rosenbusch, S. Bize, G. Santarelli, A. Clairon, P. Lemonde, G. Grosche, B. Lipphardt, and H. Schnatz, “An optical lattice clock with spin-polarized 87Sr atoms,” EPJD, vol. 48, no. 1, p. 11, 2008.
- [5] A. D. Ludlow, T. Zelevinsky, G. K. Campbell, S. Blatt, M. M. Boyd, M. H. G. de Miranda, M. J. Martin, J. W. Thomsen, S. M. Foreman, J. Ye, T. M. Fortier, J. E. Stalnaker, S. A. Diddams, Y. L. Coq, Z. W. Barber, N. Poli, N. D. Lemke, K. M. Beck, and C. W. Oates, “Sr lattice clock at fractional uncertainty by remote optical evaluation with a Ca clock,” Science, vol. 319, pp. 1805–1808, 2008.
- [6] Z. W. Barber, J. E. Stalnaker, N. D. Lemke, N. Poli, C. W. Oates, T. M. Fortier, S. A. Diddams, L. Hollberg, C. W. Hoyt, A. V. Taichenachev, and V. I. Yudin, “Optical lattice induced light shifts in an Yb atomic clock,” Phys. Rev. Lett., vol. 100, no. 10, p. 103002, 2008. [Online]. Available: http://link.aps.org/abstract/PRL/v100/e103002
- [7] G. Dick, “Local oscillator induced instabilities in trapped ion frequency standards,” in Proc. of Precise Time and Time Interval, Redendo Beach, 1987, pp. 133–147.
- [8] G. Santarelli, C. Audoin, A. Makdissi, P. Laurent, G. J. Dick, and A. Clairon, “Frequency stability degradation of an oscillator slaved to a periodically interrogated atomic resonator,” IEEE Trans. Ultrason., Ferroelect., Freq. Contr., vol. 45, pp. 887–894, 1998.
- [9] A. Quessada, R. P. Kovacich, I. Courtillot, A. Clairon, G. Santarelli, and P. Lemonde, “The Dick effect for an optical frequency standard,” J. Opt. B : Quantum Semiclassical Opt., vol. 5, p. S150, 2003.
- [10] B. Young, F. Cruz, W. Itano, and J. C. Bergquist, “Visible lasers with subhertz linewidths,” Phys. Rev. Lett., vol. 82, pp. 3799–3802, 1999.
- [11] T. Nazarova, F. Riehle, and U. Sterr, “Vibration-insensitive reference cavity for an ultra-narrow-linewidth laser,” Appl. Phys. B, vol. 83, pp. 531–536, 2006. [Online]. Available: http://dx.doi.org/10.1007/s00340-006-2225-y
- [12] A. D. Ludlow, X. Huang, M. Notcutt, T. Zanon-Willette, S. M. Foreman, M. M. Boyd, S. Blatt, and J. Ye, “Compact, thermal-noise-limited optical cavity for diode laser stabilization at ,” Opt. Lett., vol. 32, no. 6, pp. 641–643, 2007.
- [13] S. A. Webster, M. Oxborrow, and P. Gill, “Vibration insensitive optical cavity,” Phys. Rev. A, vol. 75, no. 1, p. 011801, 2007. [Online]. Available: http://link.aps.org/abstract/PRA/v75/e011801
- [14] J. Millo, D. V. Magalhaes, C. Mandache, Y. L. Coq, E. M. L. English, P. G. Westergaard, J. Lodewyck, S. Bize, P. Lemonde, and G. Santarelli, “Ultrastable lasers based on vibration insensitive cavities,” Physical Review A (Atomic, Molecular, and Optical Physics), vol. 79, no. 5, p. 053829, 2009.
- [15] K. Numata, A. Kemery, and J. Camp, “Thermal-noise limit in the frequency stabilization of lasers with rigid cavities,” Physical Review Letters, vol. 93, no. 25, p. 250602, 2004. [Online]. Available: http://link.aps.org/abstract/PRL/v93/e250602
- [16] J. Lodewyck, P. G. Westergaard, and P. Lemonde, “Nondestructive measurement of the transition probability in a Sr optical lattice clock,” Physical Review A (Atomic, Molecular, and Optical Physics), vol. 79, no. 6, p. 061401, 2009. [Online]. Available: http://link.aps.org/abstract/PRA/v79/e061401
- [17] A. V. Taichenachev, V. I. Yudin, C. W. Oates, Z. W. Barber., N. D. Lemke, A. D. Ludlow, U. Sterr, C. Lisdat, and F. Riehle, “Compensation of field-induced frequency shifts in ramsey spectroscopy of optical clock transitions,” arXiv:0903.3716, 2009. [Online]. Available: http://arXiv.org/abs/0903.3716
- [18] A. D. Ludlow, T. Zelevinsky, G. K. Campbell, S. Blatt, M. M. Boyd, M. H. G. de Miranda, M. J. Martin, J. W. Thomsen, S. M. Foreman, J. Ye, T. M. Fortier, J. E. Stalnaker, S. A. Diddams, Y. L. Coq, Z. W. Barber, N. Poli, N. D. Lemke, K. M. Beck, and C. W. Oates, “Sr lattice clock at fractional uncertainty by remote optical evaluation with a Ca clock,” Science, vol. 319, no. 5871, p. 1805, 2008.
- [19] D. Oblak, P. G. Petrov, C. L. Garrido Alzar, W. Tittel, A. K. Vershovski, J. K. Mikkelsen, J. L. Sørensen, and E. S. Polzik, “Quantum-noise-limited interferometric measurement of atomic noise: Towards spin squeezing on the Cs clock transition,” Phys. Rev. A, vol. 71, no. 4, p. 043807, Apr 2005.
- [20] P. J. Windpassinger, D. Oblak, P. G. Petrov, M. Kubasik, M. Saffman, C. L. G. Alzar, J. Appel, J. H. Muller, N. Kjaergaard, and E. S. Polzik, “Nondestructive probing of Rabi oscillations on the cesium clock transition near the standard quantum limit,” Phys. Rev. Lett., vol. 100, no. 10, p. 103601, 2008. [Online]. Available: http://link.aps.org/abstract/PRL/v100/e103601
- [21] R. L. Targat, X. Baillard, M. Fouché, A. Brusch, O. Tcherbakoff, G. D. Rovera, and P. Lemonde, “Accurate optical lattice clock with 87Sr atoms,” Physical Review Letters, vol. 97, no. 13, p. 130801, 2006. [Online]. Available: http://link.aps.org/abstract/PRL/v97/e130801