Decay of negative muons bound in 27Al
Abstract
We present the first measurement of the energy spectrum up to 70 MeV of electrons from the decay of negative muons after they become bound in 27Al atoms. The data were taken with the TWIST apparatus at TRIUMF. We find a muon lifetime of (864.6 1.2) ns, in agreement with earlier measurements. The asymmetry of the decay spectrum is consistent with zero, indicating that the atomic capture has completely depolarised the muons. The measured momentum spectrum is in reasonable agreement with theoretical predictions at the higher energies, but differences around the peak of the spectrum indicate the need for radiative corrections to the calculations. The present measurement is the most precise measurement of the decay spectrum of muons bound to any nucleus.
pacs
13.35.Bv, 14.60.Ef, 21.30.FeI Introduction
An elementary charged particle can form an atomic bound system when it replaces an atomic electron and/or a nucleus. Such exotic atoms present interesting systems for both basic and applied research, in topics ranging from quantum chemistry (e.g. pionic atom chemistry [1]), Coulomb three body systems (positronium ions [2]), muon-catalysed nuclear fusion ([3]), QED tests (Lamb shift [4]), weak interactions (muon capture [5]), strong interactions (hadronic shifts [6]), as well as fundamental symmetry tests (anti-hydrogen, antiprotonic helium [7]).
The atomic structure of exotic atoms consisting of a heavy negative particle and a nucleus has an unusual feature that, because of the larger mass of the negative particle, its characteristic distance scale is smaller by than that of the ordinary atoms, and the Coulomb interactions are correspondingly larger. The average potential energy and the particle velocity, respectively, are , and , where is the nuclear charge. Thus, these exotic atoms exhibit bound state effects that are significantly more pronounced than in ordinary atoms.
A unique process that takes place in some classes of exotic atoms is disintegration by decay of the short-lived constituent. The properties of such short-lived particles, such as the lifetime and the decay product energy spectrum, are modified in the presence of the external fields of its binding partner. Recently, universal bound state principles based on gauge symmetry have attracted interest. These connect, for example, decay properties of electromagnetically-bound exotic atomic states to those of heavy mesons, quark-antiquark systems bound by the quantum chromodynamic gauge force [8, 9, 10]. The muonic atom is a system in which the decay properties can in principle be calculated very precisely, due to the purely leptonic nature of muon decay. Combined with the strongly enhanced Coulomb interaction discussed above, it provides a sensitive testing ground for our basic understanding of bound state modifications of elementary processes.
Apart from its own interest as an exotic atomic system, there is currently considerable interest in muonic aluminium atoms in the context of searches for muon conversion to an electron. Two very ambitious proposals, Mu2e at Fermilab [11] and COMET at J-PARC [12], both propose to use muonic aluminium atoms to look for extremely rare lepton flavor violating reactions. Electrons from muon decay in the bound orbit of a muonic atom (DIO) near the end point are expected to give the single largest source of background; hence they may limit the discovery potential for these projects.
In this paper, we report a measurement of the electron energy spectrum from DIO in the muonic aluminium atom using the TWIST (TRIUMF Weak Interaction Symmetry Test) spectrometer. Our result for the DIO spectrum is the first for aluminium and is the first precision measurement covering a considerable part of the spectrum in any element, dramatically improving our experimental knowledge of DIO. We find that our measured spectrum is not adequately described by the existing theoretical calculations, implying the need for inclusion of radiative corrections. Our results will confront future calculations of DIO, including an upcoming one based on the bound-state effective field theory approach [13, 14].
Historically, the interest in the energy spectrum of the decay electron for DIO has been focused on details of the nuclear field effects. It was first calculated by Porter and Primakoff [15]. They predicted a Doppler broadening of the spectrum by taking into account the momentum distribution of the muon in its bound state. In subsequent papers [16, 17, 18] the calculations were expanded to include the modifications to the decay rate and its dependence on . The spectrum was later recalculated with fewer approximations [19], by taking into account higher order corrections to the nuclear potential [20] and nuclear recoil. Furthermore, Herzog and Alder [21] estimated the effects of bremsstrahlung in the nuclear field on the decay electron. Another calculation of the energy spectrum and the asymmetry was done by Watanabe et al. [22, 23] including tables of numerically calculated values for various elements. While these calculations treat the muon-nuclear interaction in considerable detail, none of them have included the radiative corrections that arise from the muon-electron interaction.
Despite the physics potential outlined by the authors of the calculations described above, to our knowledge, a sufficiently accurate measurement of the energy spectrum does not exist. Early measurements [24, 25, 26, 27] could confirm the expected features of Doppler broadening and the shift of the spectrum towards lower energies. However, these are by no means accurate enough to serve as tests for the calculations. Later, data for a very limited portion of the spectrum were published for various elements in the context of conversion experiments. Due to the nature of those experiments, these results for Cu [28], S [29, 30], Ti [31, 32, 33], Pb [32, 34] and Au [35, 36] focus on the high-energy tail of the distribution and can not easily be extrapolated towards lower energies due to systematic effects and normalisation problems. However, modern conversion experiments rely in their analysis on these calculated spectra (mostly [21] and [23]) as input for simulations to estimate the expected background in their data.
The TWIST spectrometer was built for a high-precision experiment searching for forms of the charged-current weak interaction in the decay of positive muons that are not described by the Standard Model. To obtain a decay spectrum for a free, at-rest muon, are stopped in metal targets and the angular and momentum spectra of decay positrons are measured. Positive (i.e. free) muons must be used for such measurements to avoid the influence of the stopping target medium.
When a negative muon comes to rest in matter, it is captured by an atom and replaces an outer shell electron. It then cascades almost instantly down to the level by emitting X rays and Auger electrons. Two processes compete for the final fate of the muon: capture by the nucleus and DIO. The relative size of these two effects depends strongly on the properties of the atom in which the muon is bound, and this can be determined by observing the electrons from the decay. In addition, for the muons that do decay before capture, the energy spectrum of the resulting decay electrons is modified from that of the decay of free muons: the energy spectrum is shifted slightly towards lower energies as the electron must overcome the muon’s binding energy ( MeV in Al). Also, the kinematic endpoint limit is 105 MeV when the neutrinos carry away no momentum and the electron recoils against the nucleus. These high-momentum decays are very rare, as close to the endpoint the spectrum drops sharply .
II Experimental Setup
A detailed description of the TWIST detector can be found in earlier publications (see [37] and references therein). Here, an overview will be given with emphasis on components that are of particular interest for this analysis.
The TWIST spectrometer was located in the M13 beam line [38] at TRIUMF. This channel provided a beam of negative muons created by a 500 MeV proton beam impinging on a Be target. The beam line was adjusted to cloud muons (muons generated in the proximity of the production target) at a momentum of 29.6 MeV/ and a rate of 80 Hz. It had a considerable contamination with electrons that was largely eliminated at the trigger level. Remaining electrons and a small amount of beam pions were identified by scintillators in the beam line recording the time-of-flight (TOF) and energy deposit of individual beam particles.
The muons were then transported into the centre of the detector and stopped in a thin 71 m aluminium target of 99.999% purity where they decayed. The muon range was adjusted using a gas degrader with variable density (adjustable ratio of He and CO2), controlled by a feedback loop using the measured stopping position.

The tracks of decay electrons were measured with two symmetric stacks of 22 high-precision planar drift-chambers (DCs) [39] located upstream and downstream of the target (Fig. 1). In addition, a total of 8 multi-wire proportional chambers (PCs) were placed at the very upstream and downstream position of the detector to support the event reconstruction by providing timing information. The target was surrounded by another 4 PCs (PC5/6 upstream and PC7/8 downstream) to enable the measurement of the stopping position of each individual muon. The target itself served as the cathode foil of the two innermost PCs, thus the gas volumes surrounding the target were sensitive. The complete detector was contained in a superconducting solenoid magnet, providing a highly uniform field of 2 Tesla.
A DC consisted of 80 sense wires at 4 mm pitch surrounded by Mylar cathode foils of approximately 6 m thickness and separated by 4 mm, filled with dimethyl ether at atmospheric pressure. Most DCs were paired into modules of two (so-called and modules) with the central foil shared. A relative rotation of the wire planes by 90 degrees allowed for the reconstruction of the position of a hit in the perpendicular plane. The PCs were of similar design, but their wire planes were equipped with twice as many wires and a “faster” gas (80:20 mixture of CF4 and isobutane at atmospheric pressure) was chosen. In addition to the timing information, the time-over-threshold was recorded to provide the amplitude of the signal, approximately proportional to the energy deposit. All DC and PC wires, and scintillators were read out by time-to-digital converters (LeCroy 1877 TDCs) in 0.5 ns bins from 6 s before to 10 s after a muon passed through the trigger scintillator. The space between the chambers was filled with a (97:3) mixture of helium and nitrogen, with the relative pressure continuously being adjusted to avoid tension and bulging of the chamber foils. In total, there was approximately 140 mg/cm2 of material from the vacuum of the M13 beam line through to the centre of the stopping target.
III Analysis
III.1 Data Set
The data set considered for this analysis comprises 58M triggered events containing 32M beam muons of which 5M stop in the target. For those, approximately 3M decays are observed inside the acceptance of the detector of which around 1.3M remain after quality and kinematic fiducial cuts.
III.2 Simulation
The TWIST detector is reproduced in a Monte Carlo (MC) simulation to permit the study of the performance of the detector and the reconstruction, and to derive corrections where necessary. The MC contains a detailed description of the detector response and the physics processes affecting the decay tracks inside the detector. This simulation is implemented in Geant 3.21 [40] and its correctness is verified by direct comparisons between simulated and real data which is available with high statistics. In particular the reconstruction efficiency, resolution, and bias and their phase-space dependence have to agree. The complete procedure and results are described in more detail in [37]. The output of the simulation is in the same format as the real data and subject to the same calibration procedures (where applicable) and reconstruction.
III.3 Event Reconstruction
To reconstruct an event, the DC hits —signal times on individual wires— are first grouped based on timing information from the PCs, separately for the upstream and downstream halves of the detector. A combinatorial, geometric pattern recognition is performed on the hits in such a time window to assign groups of hits to a potential track candidate. For each track candidate an initial helix fit is performed by using only the spatial information of the hits, i.e. the crossing position of a pair of hit and wires in a module along with the module’s position. This gives the starting values for the drift-time fit (DTF). Here, the drift-time information of each hit is used together with the space-to-time relation tables to position each hit inside the chamber volume. The DTF is not a simple fit to a geometrical helix. In order to obtain better resolution and minimise biases, the average energy loss of the particle and hence the diminishing radius in the magnetic field is taken into account. Also, the deflections caused by multiple scattering are included in the fit by allowing kinks [41] at the centre of modules, weighted by the width of scattering angles expected for the amount of crossed material. The DTF results in the particle’s time, position and momentum vector at the chamber closest to the target that has contributed a hit. Therefore the track parameters describe the particle where it is first seen, and not at the decay vertex. Although this difference only has a small effect on the decay time, momentum and the projected angle of a track, it is systematic and is taken into account in the analysis.
Event and track selection cuts are then applied to remove background from the spectrum while maintaining a minimum of bias in the kinematic parameters of the decay. A first set of selection criteria ensures that the beam particle is a muon and that it stops in the target. The scintillators in the beam line measure the TOF and pulse height per trigger, allowing discrimination of muons from electrons and pions that are present in the beam. The range of the muon is determined by requiring that the last hit was recorded in PC6, directly in front of the target. In addition, pulse height information of PC5 and PC6 is used to remove muons that stopped in the gas and cause larger energy deposits. Finally, the position of the last two PC hits gives an estimate of the muon impact point, which should be within 3 cm of the detector axis. This ensures that the muon stops in the aluminium target, and not in the surrounding support material. Decay electrons are then considered starting 500 ns after the arrival of the muon. Earlier decays can suffer from reconstruction problems related to the overlap of the track ionisation with that of the incoming muon, which would cause an upstream-downstream asymmetry.
The remaining events are decay candidates and the subsequent track selections are aimed at removing potential background. Specifically, decay tracks are required to have the correct charge sign, and their extrapolated coordinates at the target must lie within close proximity of the estimated muon impact point. In very rare cases, when more than one decay candidate is left at this stage, the one closer to the muon position is selected.
After these selections, kinematic fiducial cuts are applied in the spectrum with being the total energy of the electron and the polar angle with respect to the detector axis. These cuts serve to remove regions of the spectrum in which the reconstruction is known to be less reliable, or where the simulation does not reproduce the data with sufficient accuracy. Specifically, limits are imposed on both and , as well as the transverse momentum (i.e. track radius) and longitudinal momentum . The exact ranges are adjusted depending on specific requirements of statistical and systematic uncertainties as well as bias considerations. Kinematic fiducial cuts are applied with respect to bin centres, not individual tracks.
For both data and simulation, the track reconstruction inefficiency within the fiducial region is of the order of , the energy resolution is between 50 and 150 keV and the energy bias is less than 10 keV.
III.4 Spectrum Unfolding
Due to the various error sources (biases, resolutions) and the limited acceptance and efficiency of an experiment no measured observable represents the “true” physical value. The unfolding procedure tries to solve this problem and to find the corresponding true distribution from a distribution of the measured observable. The main assumption is that the probability distribution function in the “true” physical parameters can be approximated by a histogram with discrete bins. Then the relation between the vector of the true physical parameter and the vector of the measured observable can be described by a matrix which represents the mapping from the true value to the measured one. This matrix, usually obtained from a simulation, is called the migration (or response) matrix with
| (1) |
In our case the and vectors contain the particle energy and polar angle as .
The goal of the unfolding procedure is to determine a transformation for the measurement to obtain the expected values for using relation (1). The most simple and obvious solution is the inversion of the matrix. However, this method often provides unstable results. Correlations between bins and statistical fluctuations cause the result to be dominated by large variances and strong negative correlations between neighbouring bins.
In the method employed for this analysis [42], the unfolding is performed by the calculation of the unfolding matrix in an iterative way that is used instead of . Here is a two-dimensional matrix that transforms a vector from the measurement space to the space of “true” values. As explained in detail in Ref. [42], calculating the unfolding matrix this way avoids instabilities while no assumptions on the migration matrix or the shape of the spectrum have to be made. The method has been validated by unfolding simulated data.
To determine , the MC is used to generate a sample of 200M electrons with a decay spectrum flat in both from -1 to 1 and from 0 to 90 MeV. Since the statistical uncertainty of the MC is propagated into the final result, the sample size is chosen large enough to keep this contribution at an acceptable level.
IV Results
IV.1 Lifetime
The lifetime is obtained from a maximum likelihood exponential fit to the track times from the helix reconstruction. As noted above, like all other track parameters, this time characterises the electron track at the first DC encountered. In order to avoid large TOF corrections, all tracks that do not have a hit in the first chamber adjacent to the target are removed. As this is typically caused by the pattern recognition, it does not represent a time-dependent bias. This way only a small (sub-ns), angle-dependent correction needs to be applied to account for the approximate TOF from the target to the first DC.

The measured decay time spectrum and the lifetime fit are shown in Fig. 2. The fit range is from 500 ns (below which the reconstruction is not guaranteed to be time independent) to 7500 ns. In addition to the uncertainties of the fit (0.8 ns), two sources of systematic uncertainties for this measurement are considered. Detector effects, including the non-linearity of the TDCs can be derived from a lifetime measurement of free , and contribute with an uncertainty 0.5 ns. Secondly, the muon selection uncertainties using a variation on the PC5/6 cuts contribute with an uncertainty of 0.7 ns. We then find
| (2) |
as the lifetime for our muon sample.
The observed decay time spectrum fits an exponential very well, and our result is in excellent agreement with a published independent measurement [43]. This indicates that the selection of target stops using the PC amplitudes is of high purity.
IV.2 Asymmetry
The angular asymmetry of the decay spectrum is directly proportional to the polarisation of the muon. Thus, a measurement of the asymmetry can be used to determine the muons’ polarisation when the decay occurs. The TWIST apparatus and analysis have demonstrated the capability of measuring the asymmetry of a decay spectrum with an accuracy of or better in the analysis [44].
Contrary to almost fully polarised surface muons (muons from pions at rest that decay right at the edge of the target), cloud muons have a much lower initial polarisation in the opposite direction. The exact treatment of the mechanisms that lead to a depolarisation while the muons travel to the target is not trivial. It is assumed that until they come to rest in matter, spin-changing interactions (mostly scattering processes) are independent of charge [45]. Thus, we can assume that the have a polarisation of about -0.25 [46] before the atomic capture. The cascade following the capture will depolarise the muons further [45, 47]. The distribution of atomic states in which the capture occurs will depend on the atomic structure and is not well calculated. Spin-flip transitions during the cascade produce a large, nearly complete depolarisation in the ground state.
A statistically significant difference in the number of decays upstream and downstream is not observed. However, a quantitative limit on the residual polarisation can be obtained from a fit of the complete angular dependence of the spectrum and a comparison with the same quantity for a data set. With and the polarisation depending linearly on the asymmetry, the ratio of asymmetries can be used to calculate . Since the high-energy region of the spectrum is most sensitive to the asymmetry, a range of 31.5 to 52.5 MeV is used here. In addition, a small modification for the bound decay has to be considered for this comparison; Ref [23] calculates that the expected integrated asymmetry should be larger than for a free muon in the considered energy range. After this correction we obtain
| (3) |
as the residual polarisation when the muons decay after atomic capture.
IV.3 Energy Spectrum
Finally, the decay energy spectrum is obtained from the unfolding procedure described above. As can be expected from the high accuracy and efficiency of the track reconstruction of the spectrometer, the unfolding corrects the spectrum only marginally. Comparing the raw and corrected spectra, the most significant difference is a small, angular-dependent shift of the energy scale. This is to be expected as the measured energy of each track at the first DC has to be migrated to its energy at the decay vertex.

The unfolding is performed in the - space, but since no significant angular dependence of the spectrum is observed ( at the time of decay), only projections are shown, including appropriate acceptance corrections. The kinematic fiducial region of 0.54 0.92, 14.0 MeV/, 11.0 MeV/ MeV/ and 17.5 73.5 MeV is used. This is slightly different from the region chosen for previous analyses (e.g. [37]) in order to optimise the stability of the results towards both the low and high energy tails of the spectrum. As a systematic uncertainty we assign an overall energy scale error of (not included in Fig. 3 and Table 1) to account for an uncorrected difference in the energy scale of data and the simulation at the level of a few keV and the remaining systematic uncertainties due to misalignments, differences in resolutions and biases between data and MC.
In Fig. 3 the resulting energy spectrum is shown in comparison with the theoretical spectrum calculated by Watanabe et al. [23]. The relative normalisation is with respect to the number of observed decay events in the energy range of 17.5 to 73.5 MeV. In the high-energy region ( 60 MeV) the spectrum decreases exponentially and the observed statistics are very small, requiring larger bin widths. To account for this appropriately, the abscissa to which a bin is assigned is not the bin centre, but given by the integral of the approximate exponential probability density function of the population in that bin, normalised by the bin width itself (see for example [48]). This results in a shift of the energies of the last four bins towards slightly smaller values.
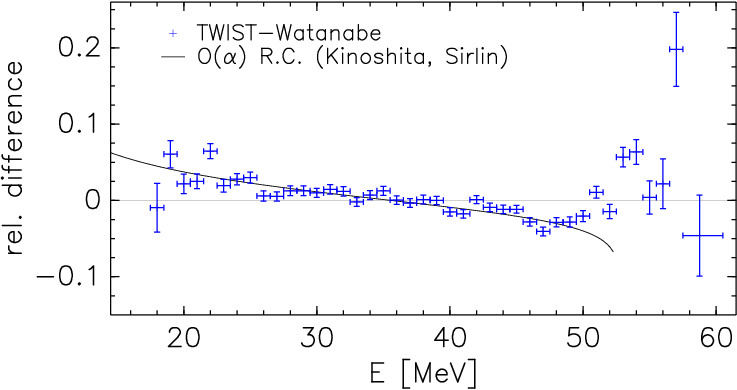
We see a good agreement in the high energy tail, while in the peak region there are significant differences between the spectra. At the same time, in the lower end of the spectrum our measurement seems to be consistently above the prediction. A comparison of these differences with the radiative corrections (R.C.) for the decay of free muons [49] is shown in Fig. 4. This demonstrates that in the region where the differences between the decay spectra of free and bound muons are small ( 46 MeV), the free decay R.C. are applicable, as would be expected. To what extent the observed differences above the free decay endpoint can be attributed to approximations in Watanabe’s spectrum, or the lack of radiative corrections in the calculation will have to await dedicated calculations of such effects for the decay of bound muons.
V Summary
We have measured the decay properties of muons bound in 27Al. The excellent agreement of our measured lifetime with published data demonstrates our success in selecting a very pure sample of decays occurring within the thin aluminium target material. The depolarisation of the muons during capture must be complete as we find negligible angular asymmetry in the decay spectrum. According to our knowledge, the present measurement of the decay electron energy spectrum is the first to be performed on aluminium and the most accurate of all measured DIO spectra. Thus this is the first measurement that can be used to benchmark the calculated spectra with precision. In our comparison with the theoretical spectrum [22] we do find differences suggesting that radiative corrections must be included before the assumptions about the basic physics of exotic bound systems can be tested.
We would like to thank C.A. Ballard, S. Chan, B. Evans, M. Goyette, and D. Maas, D. Mazur and the many undergraduate students who have contributed to the construction, operation and analysis of TWIST. We also acknowledge many contributions by other staff members from TRIUMF and collaborating institutes. A fruitful discussion with W. Marciano is also acknowledged. This work was supported in part by the Natural Sciences and Engineering Research Council of Canada, the Russian Ministry of Science, and the U.S.A. Department of Energy. Computing resources for the analysis were provided by WestGrid.
Appendix A Spectrum data
| [MeV] | events/MeV |
|---|---|
| 18 | |
| 19 | |
| 20 | |
| 21 | |
| 22 | |
| 23 | |
| 24 | |
| 25 | |
| 26 | |
| 27 | |
| 28 | |
| 29 | |
| 30 | |
| 31 | |
| 32 | |
| 33 | |
| 34 | |
| 35 | |
| 36 | |
| 37 | |
| 38 | |
| 39 | |
| 40 | |
| 41 | |
| 42 | |
| 43 | |
| 44 | |
| 45 | |
| 46 | |
| 47 | |
| 48 | |
| 49 | |
| 50 | |
| 51 | |
| 52 | |
| 53 | |
| 54 | |
| 55 | |
| 56 | |
| 57 | |
| 58.75 (59) | |
| 61.77 (62) | |
| 64.79 (65) | |
| 69.39 (70) |
References
- [1] A. Shinohara et al., Phys. Rev. Lett. 76, 2460 (1996).
- [2] F. Fleischer et al., Phys. Rev. Lett. 96, 063401 (2006).
- [3] M.C. Fujiwara et al., Phys. Rev. Lett. 85, 1642 (2000).
- [4] R. Pohl et al., Can. J. Phys. 83, 339 (2005).
- [5] V.A. Andreev et al. (MuCap), Phys. Rev. Lett. 99, 032002 (2007).
- [6] D. Gotta, Prog. Part. Nucl. Phys. 52, 133 (2004).
- [7] M. Amoretti et al., Nature 419, 456 (2002).
- [8] A. Czarnecki, G.P. Lepage, W.J. Marciano, Phys. Rev. D 61, 073001 (2000).
- [9] W.J. Marciano, arXiv:hep-ph/0403071 (2004).
- [10] A. Pak, A. Czarnecki, Phys. Rev. Lett. 100, 241807 (2008).
- [11] R.M. Carey et al., Fermilab Proposal 0973 (2008).
- [12] Y. Kuno et al., J-PARC Proposal P21 (2007).
- [13] A. Czarnecki, K. Melnikov, Phys. Rev. Lett. 87, 013001 (2001).
- [14] A. Czarnecki, private communication.
- [15] C. E. Porter and H. Primakoff, Phys. Rev. 83, 849 (1951).
- [16] H. Überall, Phys. Rev. 119, 365 (1960).
- [17] V. Gilinsky and J. Mathews, Phys. Rev. 120, 1450 (1960).
- [18] R. W. Huff, Annals of Physics 16, 288 (1961).
- [19] P. Hänggi et al., Phys. Lett. B 51, 119 (1974).
- [20] B. Fricke, Z. Physik 218, 495 (1969).
- [21] F. Herzog and K. Alder, Helvetica Physics Acta 53, 53 (1980).
- [22] R. Watanabe et al., Progress in Theoretical Phys. 78, 114 (1987).
- [23] R. Watanabe et al., Atomic Data and Nuclear Data Tables 54, 165 (1993).
- [24] C. P. Sargent et al., Phys. Rev. 99, 885 (1955).
- [25] M. M. Block et al., Il Nuovo Cimento 23, 1114 (1962).
- [26] P. B. Beilini, Il Nuovo Cimento A 54, 871 (1968).
- [27] T. Suzuki, Master’s thesis, Univ. of British Columbia, Vancouver, Canada (1976).
- [28] J. H. Barthley et al., Phys. Lett. 13, 258 (1964).
- [29] H. Scheidiger et al., Nucl. Phys. A 368, 438 (1981).
- [30] A. Badertscher et al., Nucl. Phys. A 377, 406 (1982).
- [31] D. A. Bryman et al., Nucl. Phys. A 434, 469 (1985).
- [32] S. Ahmad et al., Phys. Rev. D 38, 2102 (1988).
- [33] C. Dohmen et al., Phys. Lett. B 317, 631 (1993).
- [34] W. Honecker et al., Phys. Rev. Lett. 76, 200 (1996).
- [35] A. Badertscher et al., J. Phys. G 17, S47 (1991).
- [36] W. Bertl et al., Eur. Phys. J. C 47, 337 (2006).
- [37] R. P. MacDonald et al. (TWIST), Phys. Rev. D 78, 032010 (2008).
- [38] C. Oram, J. Warren, G. Marshall, and J. Doornbos, Nucl. Instrum. Methods 179, 95 (1981).
- [39] R.S. Henderson et al., Nucl. Instrum. Methods A 548, 306 (2005).
- [40] geant Detector Description and Simulation Tool, CERN Application Software Group, Geneva, Switzerland (1994), version 3.21.
- [41] G. Lutz, Nucl. Instrum. Methods A 273, 349 (1988).
- [42] G. D’Agostini, Nucl. Instrum. Methods A 362, 487 (1995).
- [43] T. Suzuki, D. F. Measday, and J. P. Roalsvig, Phys. Rev. C 35, 2212 (1987).
- [44] B. Jamieson et al. (TWIST), Phys. Rev. D 74, 072007 (2006).
- [45] R. A. Mann and M. E. Rose, Phys. Rev. 121, 293 (1961).
- [46] J. R. Musser et al. (TWIST), Phys. Rev. Lett. 94, 101805 (2005).
- [47] K. Nagamine, Hyperfine Interactions 6, 347 (1979).
- [48] G. D. Lafferty and T. R. Wyatt, Nucl. Instrum. Methods A 355, 541 (1995).
- [49] T. Kinoshita, A. Sirlin, Phys. Rev. 113, 1652 (1959).