Electronic structure and thermoelectric properties of
Abstract
Electronic structure calculations using the augmented spherical wave method have been performed for . For this semiconductor crystallizing in the delafossite structure, it is found that the valence band maximum is mainly due to the orbitals of . The structural characterizations of show a broad range of substitution for in this series, up to about 12%. Measurements of the resistivity and thermopower of the doped systems show a Fermi liquid-like behavior for temperatures up to about 1000 K, resulting in a large weakly temperature dependent power factor. The thermopower is discussed both within the Boltzmann equation approach as based on the electronic structure calculations and the temperature independent correlation functions ratio approximation as based on the Kubo formalism.
Keywords:
electronic structure, low-dimensional compoundspacs
71.20.-b, 72.15.Eb, 73.90.+fI Introduction
The search for new thermoelectric materials in order to convert waste-heat into electricity has motivated numerous studies on transition-metal oxides. One advantage of these materials over several others lies in their ability to be used at elevated temperatures in air. This opens the route to target systems releasing heat at temperatures as high as 1000 K. Among the studied p-type thermoelectric oxides, the layered ones such as , misfit cobaltites, or, more recently, the delafossites, all with structures containing -type layers, have been particularly investigated according to the richness of their physical properties. For instance, the thermoelectric performance of several delafossites have been measured, leading to the following dimensionless figures of merit of 0.04 at 800 K (), [1] 0.14 at 1100 K (), [2] and 0.15 at 1000 K (). [3] Their crystal structures can all be described as a delafossite-type, in which -layers of edge sharing octahedra alternate along the c-axis with layers of monovalent cations, the latter exhibiting a dumbbell O–Cu–O coordination.
Although the thermoelectric properties of the Cu–based delafossites have been measured, their origin remains a subject of controversy. In the system, the measurements have been interpreted by considering different active layers for the electrical transport – either in the or layers – whereas in a recent report on , the electrical conductivities of both and layers have been proposed to be comparable at 300 K. [4]
In order to shed light on the respective role of the layers on the transport properties in delafossites, electronic structure calculations have proven to be useful. [5, 6, 7, 8, 9, 10, 11, 12, 13] In the delafossite with A = Pt or Pd, these calculations have demonstrated that their low resistivities ( at room temperature[14, 15]) come almost exclusively from the in-plane orbitals of the cations. [6, 10] For , on the opposite, it is found that the states of the cations provide the most important contribution at the valence band maximum, with spin polarization supported by the experimental evidences for negative magnetoresistance and magnetothermopower.[12] However, as has been recently reported for ,[9] where the stable electronic configuration of precludes any participation of Y to the transport, there exists some cases where the copper cations are contributing to the charge delocalization. However, this delafossite belongs to those characterized by a large M cation ( nm versus nm) favoring the incorporation of extra anions into the copper layer so that in that case the physics might be different. In that respect, the physics of the oxygen stoichiometric subclass of delafossites is of interest, especially if we consider the possibility to control the magnetism at the M-site. This is outlined by the multiferroic behavior exhibited by the delafossites for or , which are both showing electric polarization induced by incommensurate antiferromagnetism according to the and high-spin M cations, respectively.[16, 17, 18] For these delafossites, the complex magnetism resulting from the frustrated nature of the network is indeed thought to be responsible for the magnetic field induced electric polarization.
Such multiferroic behavior is in marked contrast to the metal-type behavior reported for the substituted rhodate . The / electronic configurations of low-spin in this series provides a unique opportunity to study the electronic groundstate of a delafossite without extra contributions generated by the large magnetic moments of / () or / () cations. However, literature data for show some variation. This is best illustrated by the different values reported for the room temperature Seebeck coefficient of , which are , and as given in Refs. 3 and 4, respectively.[19] Among the possible reasons explaining this discrepancy is the uncertainty of the Mg for Rh substitution controlling the concentration of holes in the matrix. In order to check for the transport mechanism and for the substitution effectiveness, electronic structure calculations have been performed. In the present paper, these results are discussed in comparison to the experimental data. The latter are obtained on polycrystalline samples, for which the delafossite structure was verified by a combined X-ray and electron diffraction study. Taken together with the cation analysis, these characterizations also demonstrate the existence of a solubility limit much larger than in . The electrical resistivity and Seebeck coefficient measurements show that the substitution of Mg for Rh in allows to progressively induce an insulator to metal transition accompanied by a gradual decrease of the thermopower.
Contrasting previous studies, these results are found to be compatible with electronic structure calculations with a lack of significant contribution of copper, the most important contribution at the Fermi level coming from the orbitals of the Rh cations. The lack of significant magnetic contribution, probed by magnetic susceptibility, responsible for the low temperature increase in and , allows for the study of the metallic state from 2.5 K to 1000 K. An unusual regime is evidenced over a broad temperature range, which, when combined with the dependence of the Seebeck coefficient, leads to remarkably independent power factors, .
II Methodology
II.1 Electronic structure calculations: theoretical method
The calculations are based on density-functional theory and the generalized gradient approximation (GGA). [20] They were performed using the scalar-relativistic implementation of the augmented spherical wave (ASW) method (see Refs. 21, 22, 23 and references therein). In the ASW method, the wave function is expanded in atom-centered augmented spherical waves, which are Hankel functions and numerical solutions of Schrödinger’s equation, respectively, outside and inside the so-called augmentation spheres. In order to optimize the basis set, additional augmented spherical waves were placed at carefully selected interstitial sites. The choice of these sites as well as the augmentation radii were automatically determined using the sphere-geometry optimization algorithm.[24] Self-consistency was achieved by a highly efficient algorithm for convergence acceleration.[25] The Brillouin zone integrations for the self-consistent field calculations were performed using the linear tetrahedron method with up to 1156 k-points within the irreducible wedge of the rhombohedral Brillouin zone,[26, 23] whereas the calculation of the density of states and the thermopower is based on 19871 k-points.
In the present work, a new full-potential version of the ASW method was employed.[27] In this version, the electron density and related quantities are given by spherical-harmonics expansions inside the muffin-tin spheres. In the remaining interstitial region, a representation in terms of atom-centered Hankel functions is used.[28] However, in contrast to previous related implementations, we here get away without needing a so-called multiple- basis set, which fact allows to investigate rather large systems with a minimal effort.
II.2 Ceramic samples preparation and characterization
The polycrystalline samples of the series have been prepared by solid state reaction in air. Bars of typical size mm were prepared by mixing stoichiometric amounts of the , and MgO precursors, which were then pressed. The electron diffraction study was carried out with a JEOL 2010CX transmission electron microscope. The sample preparation is made by crushing in butanol some bar pieces, the corresponding microcrystals being afterwards deposited on Ni grids. The purity of the obtained black bars was checked by X-ray powder diffraction using a Panalytical X-pert Pro and a Brucker diffractometers. The data were analyzed by using the Fullprof suite.[29]
As two different calcination temperatures have been used in the literature, two attempts were made at either C or C for a duration of twelve hours. As shown in Fig. 1a for (), one small extra peak identified as CuO appears (see the vertical arrow in Fig. 1a). The weight of the latter depends on the synthesis temperature. Indeed, when increasing it from C to C, the weight of this peak decreases. Furthermore, as these patterns were recorded in the same conditions, (amount of powder and acquisition time), this comparison shows the poor crystallinity of the C prepared sample. This result agrees with the less dispersed cation contents of the C prepared sample as probed by energy dispersive X-ray spectroscopy (EDS) analysis performed within the transmission electron microscope. Such conclusions are consistent with the thermodynamics of the Cu-Rh-O ternary diagram, which showed that synthesized below C in an oxygen pressure of 0.1 MPa is unstable. [30] Thus, the sample series corresponding to , 0.01, 0.04, 0.10, 0.15, and 0.30 in has been calcined in air at C for a duration of twelve hours.
The patterns of the samples are all refined in the space group, usually reported for delafossite compounds at room temperature, as shown in Fig. 1.


A small decrease of both and lattice parameters is observed when x increases up to 15% (corresponding to a decrease of 0.6% of the cell volume). From on, one small extra peak appears that can be identified as CuO.
In order to test the maximum content of substituted for Rh cations, EDS analyses coupled to electron diffraction have been made first for the compound with the highest experimental Mg doping (). This analytical study demonstrates that a maximum of 12% can be substituted at the Rh site in , while the oxide is detected as a secondary phase. This is consistent with the observation from X-ray diffraction of this impurity for . For that reason, our measurements of transport properties are restricted to compounds corresponding to , the composition already containing a very low amount of CuO as impurity. We emphasize that this structural study cannot be reconciled with previous data by Shibasaki et al.[4] given for compounds nominally containing up to of .
The low temperature ( K) electrical resistivity () and Seebeck coefficient () were measured by using a Quantum Design cryostat. The four-probe and the steady-state techniques were used for the former and the latter, respectively, indium electrical contacts having been deposited with ultrasons. For the high temperature and measurements () a Ulvac-Zem 3 system was used. The magnetic susceptibility was measured by using a dc SQUID magnetometer (zero field-cooling, T).
III Results
III.1 Calculations: Important role of the Rh orbitals
The calculations were based on the crystal structure data by Oswald et al.,[31] who determined the lattice constants as Å and Å. However, these authors did not measure the internal oxygen parameter. For this reason, we performed an energy minimization, leading to a value of , which was used in all subsequent calculations.
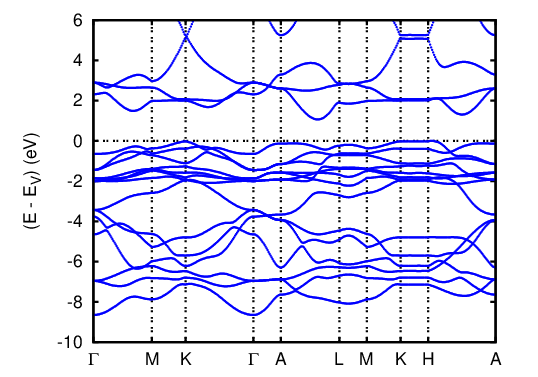
The electronic bands along selected high-symmetry lines of the first Brillouin zone of the hexagonal lattice, Fig. 2, are displayed in Fig. 3.

The corresponding partial densities of states (DOS) are shown in Fig. 4.
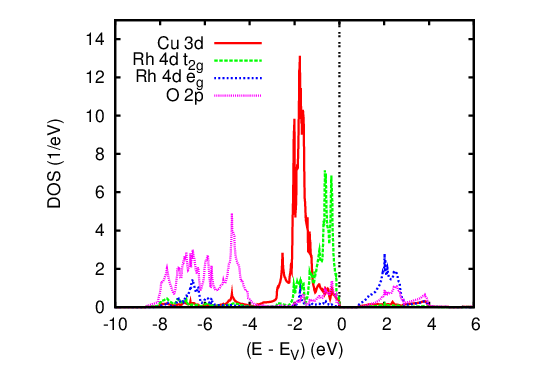
While the lower part of the spectrum is dominated by O states, the transition metal states lead to rather sharp peaks in the interval from to eV. In particular, the and manifolds of the Rh states as resulting from the octahedral coordination are recognized. This representation of the partial DOS used a local rotated coordinate system with the Cartesian axes pointing towards the oxygen atoms. -type overlap of the O states with the Rh orbitals leads to the contribution of the latter between and eV. In contrast, due to the much weaker -type overlap of the O states with the orbitals, these states give rise to sharp peaks in the interval from eV to the valence band maximum. The manifold is separated by an optical band gap of eV from the empty states and thus leads to a Rh state. The Cu states are essentially limited to the interval from eV to the valence band maximum and thus Cu can be assigned a monovalent configuration in close analogy with the experimental findings. In passing, we mention the finite dispersion of the electronic bands parallel to -A, which points to a considerable three-dimensionality arising from the coupling between the layers. Yet, this overall behavior of the dispersion perpendicular to the plane is contrasted by the barely noticeable dispersion particularly along the line K-H. This has been also observed for other delafossite materials.[10, 12]
Further insight about the electronic properties of can be gained by analyzing the real and imaginary parts of the dielectric function as calculated within linear-response (see Ref. 23 for more details). As is evident from Fig. 5,
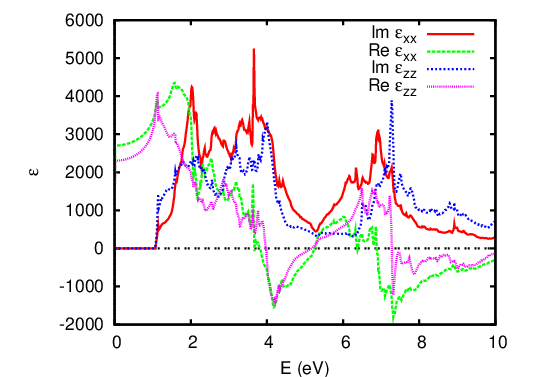
the asymmetry between the in-plane and out-of-plane directions is not reflected in the absorption gap following from the imaginary parts of the dielectric function. In fact the gap is very close to 0.75 eV in all three directions, which is most likely to exceed the Hund’s rule coupling. Therefore, the low-spin configuration of is expected to be the ground state. This is consistent with earlier findings by Singh for , where the Co ions adopt the low-spin configuration.[8]
Finally, we have calculated the thermopower using the framework of Boltzmann theory.[32] The transport properties are expressed in terms of the Onsager transport coefficients,
| (1) |
where is the negative derivative of the Fermi function and
| (2) |
denotes the so-called transport distribution.[33, 34] Here, is the volume of the unit cell, a Cartesian component of the group velocity of the ’th band, and is the relaxation time. While the electrical conductivity and the thermal conductivity (at zero electric field) are given directly by (1) for and , respectively, the thermopower is calculated from the matrix equation
| (3) |
where is the (negative) electronic charge. Following standard practice we assume that the relaxation time does not depend on and band index, in which case cancels from the Seebeck coefficient. The implementation of the above formulation was done along similar lines as those previously proposed by Scheidemantel et al. as well as by Madsen and Singh.[33, 34] The implementation was tested against the recent results by Singh for and and very good agreement was found. [8, 9]
The -components of the thermopower as calculated for different doping levels are displayed in Fig. 6;

the calculated -components are about 10-20% larger. According to these findings, the thermopower strongly decreases with increased hole doping. In addition, it shows an almost linear dependence on temperature especially in the intermediate-temperature range with the downturn at low doping and high temperatures reflecting excitations across the optical band gap. Worth mentioning are the rather high values for the lower doping levels down to K and the pronounced drop below this temperature.
In passing, we mention that apart from systematically slightly smaller values our results are in perfect agreement with the calculations of Usui et al.,[13] who likewise used the Boltzmann equation approach and who in turn obtained almost perfect agreement with the experimental data by Kuriyama et al..[3] However, we recall from the above mentioned previous comparative tests to the results by Singh that the thermopower is remarkably sensitive to details of the crystal structure. Since Usui et al. used slightly different lattice constants in their calculations this might explain the systematic deviations in the calculated thermopower.
III.2 Electrical resistivity: A metal-insulator transition
curves for the series as given in Fig. 7

reveal the modification of the electronic groundstate induced by the substitution. At 300 K, the values decrease by a factor of as increases from to . This drop is even more pronounced at lower temperatures as the curve exhibits a localized behavior in with at 100 K. In contrast, metal-like behavior is observed for with . It must be emphasized that the change of electronic state induced by is progressive. The compound still exhibits a localized behavior but with a resistivity decreased by three orders of magnitude at 100 K as compared to , whereas for , remains almost independent from 100 K to 1000 K ( increasing by 5% only in this temperature range). The curve shows a re-entrant behavior only below K, reaching a maximum value of at 5 K. In fact, a closer inspection of the curves reveals that they all go through a minimum value at a characteristic temperature separating a regime below from a regime for (Fig. 7). As shown in Table 1,
| x | (K) | |
|---|---|---|
| 0.00 | 800 | 102 |
| 0.01 | 699 | 45.56 |
| 0.04 | 320 | 10.74 |
| 0.10 | 38 | 1.22 |
the value decreases from K for to K for .
For the pristine compound, the localizing behavior observed below (800 K) is consistent with the existence of a rather small gap at the Fermi level obtained in the section III.1. Even though this temperature dependence of the resistivity is similar to the curve measured for , it is in fact closer to the one of .[12] However, the data point to a different transport mechanism. Indeed, first, no significant magneto-resistance was observed in contrast to all samples showing a magneto-resistance as high as % at 5 K in 7 T. Second, neither the Arrhenius law nor the polaronic model , nor the variable range hopping model with , or , which are broadly used in conventional three dimensional transition metal perovskites as ,[35] and which were successfully applied to the two dimensional chromium based delafossites and , respectively,[12] can convincingly fit the data of .
This conclusion about the transport mechanism in is confirmed by the analysis of the curves found for the Mg-substituted compounds. First, the attempts to fit the curves by a polaronic model fail as for . Second, a low temperature Fermi liquid behavior is found for . Third, the metal-like regions of the curves can be adjusted to dependences that are obeyed over a wide temperature range. As shown in Fig. 8

| Compound | |
|---|---|
| (from Ref. 14) | |
| Thin films of (from Ref. 36) | |
| (from Ref. 37) | - |
for , the regime holds from K to K. Expressing as as in a Fermi liquid we obtain the transport parameter . As shown in Table 2, the values of for these rhodates are found to be located in an intermediate range, namely they are larger than in the delafossites,[14] but smaller than in thin films of .[36] In a fashion similar to the behavior observed in the titanates ,[37] increases with decreasing concentration of charge carriers, while, in contrast to all the above systems, the -behavior may be observed for temperatures up to 1000 K. Remarkably, the widely observed phonon-dominated behavior is not taking over, even at such high temperatures. Such a result enlights the unusual transport behavior of these rhodates. The presence of the scattering centers, up to 12%, corresponds to concentration well below the percolation threshold, and no band purely based on Mg orbitals is expected to form. Therefore, on their own, such low Mg concentrations should not affect the transport in the range where this regime is observed but by hole doping the Rh-based bands. Still, inhomogeneous distribution of the Mg ions on the Rh sites might be responsible of the kink observed in Fig. 8 for .
Finally, the resistivity values for are rather comparable to those reported in Ref. 4 ( K) or in Ref. 3 ( K). The decrease of induced by the substitution in the present samples strongly suggest that “hole” charge carriers are created according to the formula . It must also be added that since no other delafossites exhibits such metal-like behavior down to very low , the role of the Cu channel to the electronic transport can hardly be invoked as is also confirmed by the electronic structure calculations.
III.3 Thermoelectric power and power factors
Although the values of our series are comparable to those already reported,[3] the Seebeck coefficients values for (Table 3 and Fig. 9) appear to be different.
| x | (K) | |
|---|---|---|
| 0 | 330 | 280 |
| 0 (from Ref. 4) | 300 | 130 |
| 0.10 | 450 | 120 |
| 0.10 (from Ref. 3) | 450 | 165 |
| 0.05-0.20 (from Ref. 4) | 450 | 65 |
When compared to the study in which the samples were calcined at lower , [4] the present values are found to be always much larger, as documented in Table 3. Besides, our data for the substituted compounds showing an decrease as x increases cannot be reconciled with the x-independent for all substituted compounds of Ref. 4.

For the most metallic sample, the values are always increasing with as shown for in Fig. 9. In contrast, the localizing behavior of is reflected by the curves showing an upturn towards high values as decreases below 450 K. For all , or for K (for x = 0.00 and x = 0.01) the curves exhibit an almost regime as shown by the lines drawn on the curves in Fig. 9. Such a dependence is characteristic of a metallic behavior. As previously reported for , this behavior leads to rather large positive values, larger than at 1000 K for and . The decrease of as x increases together with the positive sign of is consistent with an increase of the hole () fraction induced by charge compensation created by the for substitution.
Remarkably, all these trends are in good qualitative agreement with the theoretical findings presented in Sec. III.1. Yet, the experimentally obtained values at 1000 K are somewhat smaller than the theoretically predicted ones. One is therefore tempted to analyze the above experimental data within a completely different approach, namely, the temperature independent correlation functions ratio approximation (TICR).[38] In this approach, the thermopower arising from the Kubo formalism
| (4) |
is approximated by assuming that the energy current-particle current correlation function and the particle current autocorrelation function share the same temperature dependence. Thus their ratio should result in a hyperbolic offset of strength of the thermopower as
| (5) |
At high temperatures the temperature dependence of the thermopower is governed by the one of the chemical potential which follows from
| (6) |
Here, again denotes the Fermi function and is the density of states. In the present context, the latter is taken from the electronic structure calculations (Fig. 4). Yet, within the present model there is still room for improvement especially at high temperatures. This goes mainly along two different directions. One way to improve on the TICR as covered by (5)/(6) would be to use a modified density of states resulting from the GGA result by a rigid energetical upshift of the conduction bands. However, for reasonable values of the latter, it turned out that the thermopower shows little sensitivity to the actual optical band gap. From this, we can furthermore conclude that the behavior of the thermopower is dominated by the holes in the valence bands.
Another direction is provided by the observation that, in many cases, the thermopower tends to loose its temperature dependence above room temperature, see e. g. Ref. 39. With this motivation, the TICR expression (5) was extended by adding a temperature independent contribution to .

Such a contribution is often attributed to localized degenerate states. Here they may derive from the pockets on the Fermi surface centered around the H and A points that are characterized by small Fermi velocities (see Fig. 3). As a consequence, within the extended TICR the thermopower is determined by two parameters, namely, and , which, together with the GGA DOS, can be used to fit the experimental data. The result is shown in Fig. 10 for all three doped samples. Regarding , the values range from meV to meV, thereby being quite similar to the ones reported for electron-doped manganites. In these materials a large density of states at the bottom of the band results in low degeneracy temperatures and large negative thermopower.[38] For the title compounds, the density of states at the top of the valence band is large, resulting in the large positive thermopower, together with low degeneracy temperature. The values are quite large () and appear to be comparable to the ones reported for various layered colbatates, in which the here considered layers are replaced by isostructural layers.[39] Additionally, the fact that the thermopower data for all three doped samples could be reproduced using the same DOS for both the extended TICR model and the GGA calculations is quite remarkable. This gives a strong support to use the rigid band model.
In order to check the thermoelectric performance, we now address the power factor PF (). Combining their dependences, and at sufficiently high temperature, this leads to remarkable -independent values of the PF as shown in Fig. 11.

The best values are observed for the most substituted samples exhibiting a value of the . As shown in Fig. 11 and in good qualitative agreement with the calculations presented in Sec. III.1, the values are found to increase as x increases in showing that the induced relative decrease is more than compensating the decrease.
IV Conclusion
In summary, Mg-doped has been investigated by means of electronic structure calculations, structural characterization, and transport measurements. The electronic structure calculations clearly indicate that the transport is dominated by the Rh bands. Structural data demonstrate that the solubility limit of Mg in is as high as 12%, provided the samples are prepared at temperatures above C, in which case Rh is indeed substituted by Mg. This substitution results in a peculiar hole doping of the rather narrow Rh bands, shown by a dependence of the resistivity, a dependence of the thermopower, and a quite large nearly independent power factor, up to temperatures as high as 1000 K. Regarding the thermopower, good qualitative agreement between the theoretical prediction arising from the GGA+Boltzmann approach and experimental data is obtained. Yet, an additional purely entropic contribution needs to be invoked when treating the GGA results in the TICR framework for quantitative explanation, in a similar fashion as what was found in cobaltites with isostructural layers.[39] Thermal conductivity measurements performed on dense samples would be necessary to measure the figure of merit. Work along this line is in progress.
V Acknowledgments
We gratefully acknowledge many useful discussions with T. Kopp and A. Reller. V.E. is especially grateful to D. Singh for very fruitful discussions during the implementation of the transport properties into the ASW package. This work was supported by the ANR through NEWTOM as well as by the Deutsche Forschungsgemeinschaft through SFB 484 (V.E.) and the Research Unit 960 “Quantum Phase Transitions” (S.K.).
References
- [1] Y. Ono, K. Satoh, T. Nozaki, and T. Kajitani, Jap. J. Appl. Phys. 46, 1071 (2007).
- [2] K. Hayashi, T. Nozaki, and T. Kajitani, Jap. J. Appl. Phys. 46, 5226 (2007); T. Nozaki, K. Hayashi, T. Kajitani, J. Chem. Eng. Jap. 40, 1205 (2007).
- [3] H. Kuriyama, M. Nohara, T. Sasagawa, K. Takubo, T. Mizokawa, K. Kimura, and H. Takagi, Proc. 25th Int. Conf. Thermoelectrics (IEEE, Piscataway, 2006), p. 97.
- [4] S. Shibasaki, W. Kobayashi, and I. Terasaki, Phys. Rev. B 74, 235110 (2006).
- [5] V. R. Galakhov, A. I. Poteryaev, E. Z. Kurmaev, V. I. Anisimov, S. Bartkowski, M. Neumann, Z. W. Lu, B. M. Klein, and T.-R. Zhao, Phys. Rev. B 56, 4584 (1997).
- [6] R. Seshadri, C. Felser, K. Thieme, and W. Tremel, Chem. Mater. 10, 2189 (1998).
- [7] K. P. Ong, K. Bai, P. Blaha, and P. Wu, Chem. Mater. 19, 634 (2007).
- [8] D. J. Singh, Phys. Rev. B 76, 085110 (2007).
- [9] D. J. Singh, Phys. Rev. B 77, 205126 (2008).
- [10] V. Eyert, R. Frésard, and A. Maignan, Chem. Mat. 20, 2370 (2008).
- [11] V. Eyert, R. Frésard, and A. Maignan, Phys. Rev. B 78, 052402 (2008).
- [12] A. Maignan, C. Martin, R. Frésard, V. Eyert, E. Guilmeau, S. Hébert, M. Poienar, and D. Pelloquin, Solid State Commun. 149, 962 (2009).
- [13] H. Usui, R. Arita, and K. Kuroki, J. Phys.: Condens. Matter 21, 064223 (2009).
- [14] M. Tanaka, M. Hasegawa, and H. Takei, J. Phys. Soc. Japan 65, 3973 (1996).
- [15] R. D. Shannon, D. B. Rogers, and C. T. Prewitt, Inorg. Chem. 10, 713 (1971); C. T. Prewitt, R. D. Shannon, and D. B. Rogers, ibid. 10, 719 (1971); D. B. Rogers, R. D. Shannon, C. T. Prewitt, and J. L. Gillson, ibid. 10, 723 (1971).
- [16] J.-P. Doumerc, A. Wichainchai, A. Ammar, M. Pouchard, and P. Hagenmuller, Mat. Res. Bull. 21, 745 (1986).
- [17] T. Kimura, J. C. Lashley, and A. P. Ramirez, Phys. Rev. B 73, 220401(R) (2006).
- [18] S. Seki, Y. Onose, and Y. Tokura, Phys. Rev. Lett. 101, 067204 (2008).
- [19] This value () is extrapolated from the high-temperature measurements reported in Ref. 3.
- [20] J. P. Perdew, K. Burke, and M. Ernzerhof, Phys. Rev. Lett. 77, 3865 (1996)
- [21] A. R. Williams, J. Kübler, and C. D. Gelatt, Jr., Phys. Rev. B 19, 6094 (1979).
- [22] V. Eyert, Int. J. Quantum Chem. 77, 1007 (2000).
- [23] V. Eyert, The Augmented Spherical Wave Method – A Comprehensive Treatment, Lect. Notes Phys. 719 (Springer, Berlin Heidelberg 2007).
- [24] V. Eyert and K.-H. Höck, Phys. Rev. B 57, 12727 (1998).
- [25] V. Eyert, J. Comp. Phys. 124, 271 (1996).
- [26] P. E. Blöchl, O. Jepsen, and O. K. Andersen, Phys. Rev. B 49, 16223 (1994).
- [27] V. Eyert, unpublished
- [28] M. S. Methfessel, Phys. Rev. B 38, 1537 (1988).
- [29] J. Rodriguez-Carvajal, Physica B 192, 55 (1993).
- [30] K. T. Jacob, T. H. Okabe, T. Uda, and Y. Waseda, Bull. Mater. Sci. 22, 741 (1999).
- [31] H. R. Oswald, P. Kuhn, and A. Reller, Solid State Ionics 32/33, 528 (1989).
- [32] P. B. Allen, Boltzmann theory and resistivity of metals. In: Quantum Theory of Real Materials, ed by J. R. Chelikowsky and S. G. Louie (Kluwer, Boston 1996) pp 219–250.
- [33] T. J. Scheidemantel, C. Ambrosch-Draxl, T. Thonhauser, J. V. Badding, and J. O. Sofo, Phys. Rev. B 68, 125210 (2003).
- [34] G. K. H. Madsen and D. J. Singh, Comput. Phys. Commun. 175, 67 (2006).
- [35] R. X. Smith, M. J. R. Hoch, P. L. Kuhns , W. G. Moulton, A. P. Reyes, G. S. Boebinger, J. Mitchell, and C. Leighton, Phys. Rev. B 78, 092201 (2008).
- [36] C. Grygiel, Ch. Simon, B. Mercey, W. Prellier, R. Frésard, and P. Limelette, Appl. Phys. Lett. 91, 262103 (2007).
- [37] Y. Tokura, Y. Taguchi, Y. Okada, Y. Fujishima, T. Arima, K. Kumagai, and Y. Iye, Phys. Rev. Lett. 70, 2126 (1993).
- [38] R. Frésard, S. Hébert, A. Maignan, L. Pi, and J. Hejtmanek, Phys. Lett. A 303, 223 (2002).
- [39] P. Limelette, S. Hébert, V. Hardy, R. Frésard, Ch. Simon, and A. Maignan, Phys. Rev. Lett. 97, 046601 (2006).