789\Yearpublication\Yearsubmission\Month\Volume\Issue
The Properties of Fossil Groups of Galaxies
Abstract
Numerical simulations as well as optical and X-ray observations over the last few years have shown that poor groups of galaxies can evolve to what is called a fossil group. Dynamical friction as the driving process leads to the coalescence of individual galaxies in ordinary poor groups leaving behind nothing more than a central, massive elliptical galaxy supposed to contain the merger history of the whole group. Due to merging timescales for less-massive galaxies and gas cooling timescales of the X-ray intragroup medium exceeding a Hubble time, a surrounding faint-galaxy population having survived this galactic cannibalism as well as an extended X-ray halo similar to that found in ordinary groups, is expected. Recent studies suggest that fossil groups are very abundant and could be the progenitors of brightest cluster galaxies (BCGs) in the centers of rich galaxy clusters. However, only a few objects are known to the literature. This article aims to summarize the results of observational fossil group research over the last few years and presents ongoing work by the authors. Complementary to previous research, the SDSS and RASS surveys have been cross-correlated to identify new fossil structures yielding 34 newly detected fossil group candidates. Observations with ISIS at the 4.2m William Herschel Telescope on La Palma have been carried out to study the stellar populations of the central ellipticals of 6 fossil groups. In addition multi-object spectroscopy with VLTs VIMOS has been performed to study the shape of the OLF of one fossil system.
keywords
galaxies: dwarf – galaxies: elliptical and lenticular, cD – galaxies: evolution – galaxies: interactions1 Introduction
Redshift surveys have shown that galaxies in the nearby universe are not randomly distributed in space but rather found in aggregates, so called galaxy groups (Geller & Huchra 1983, Tully 1987). Basically galaxy groups can be divided into three major classes that differ mainly in their optical and physical characteristics: poor groups, compact groups, and fossil groups.
Poor or loose groups with a space density of Mpc-3 (Nolthenius & White, 1987) resemble simple multiplets of galaxies, represent the most common class and are simply referred to as galaxy groups. They are comprised of approximately 50 members, including numerous dwarf galaxies and take up typical diameters of 1.5 Mpc. Compact groups with a space density of 12 Mpc-3 (Hickson 1982) are less abundant and typically made up of only 4 to 5 bright galaxies strongly interacting with each other due to their mutual gravitational attraction causing tidal forces to form tails around closely interacting members. Since today, about 1000 compact groups have been classified (Hickson 1997). Fossil groups are characterised through a dominating central bright elliptical galaxy comparable to cD galaxies in clusters surrounded by a diffuse and extended X-ray halo together with a significant fainter galaxy population. Recent studies have estimated space densities of fossil systems in the local universe to be 14 Mpc-3, comparable to HCGs. Besides the fact that the vast majority of galaxies in the universe appear to be located in groups, these systems play also a key role in our understanding of galaxy evolution. Since the masses of groups are comparatively small ( M⊙) with respect to the richer clusters ( M⊙), the virial theorem implies lower values for the group velocity dispersions favoring galaxy interactions leading to the coalescence of individual galaxies, galaxy merging.
Numerical simulations have shown that this cannibalism can proceed as long as a single, massive elliptical galaxy remains as final product of multiple merging events (Barnes 1989) on a timescale of a few gigayears. The physical origin behind the merging of galaxies is explained by dynamical friction of the group member galaxies with the group dark-matter halo and acts not for all types of galaxies similarly effective. According to the description of dynamical friction by Chandrasekhar (1943), the friction force is strongly mass dependent leading to longer merging timescales (see Binney & Tremaine p.429) for less massive galaxies which therefore should have survived this galactic cannibalism up to now. Moreover, the hot X-ray gas, as found in 50% of all known galaxy groups (not correlated with individual group members but rather diffusely distributed following the global gravitational group potential (Mulchaey 2000)) is also expected to be observed in this state of hierarchical galaxy evolution since gas temperatures and electron densities of a typical intragroup medium with 107 K and 10-3 cm-3 suggest gas cooling timescales exceeding the age of the universe. Thus, one claims that fossil groups represented by a central bright, massive elliptical galaxy surrounded by a diffuse and extended X-ray halo and a fainter galaxy population are the remnants of what was initally a poor group of galaxies that has been transformed to this old, fossil stage of galaxy evolution in low density environments with compact groups acting as likely way station in this evolution. If this scenario is correct then the relative space densities of these three different types of systems give information on their transformation rates. Moreover, Jones et al. (2003) assume that fossil systems constitute of probably 8-20% of all systems with comparable X-ray luminosity (1042 ergs s-1), thus acting also very likely as the site of formation of brightest cluster galaxies (BCGs) before the infall into clusters. Similar optical luminosities of the central ellipticals in fossil groups compared to that of BCGs support this idea. Therefore fossils play a crucial role in our understanding of galaxy evolution in low-density environments and the physical connection between groups and clusters respectively.
The definition of a fossil system as proposed by Jones et al. (2003) was the first real attempt to attribute exact observational charateristics to this class. According to their influental paper a fossil system is a spatially extended X-ray source with an X-ray luminosity from diffuse, hot gas of h ergs s-1. The optical counterpart is a bound system of galaxies with mag, where is the absolute total magnitude difference in the Johnson band between the two brightest galaxies in the system within half the projected virial radius. No upper limit is given for the X-ray luminosity or temperature. The ideas behind this classification scheme are simple. The lower limit in X-ray luminosity excludes normal bright elliptical galaxies exhibiting a hot coronal gas component. The magnitude gap of mag for the two brightest galaxies of the group ensures that one single elliptical galaxy dominates the system. Studies of luminosity functions of galaxy groups have shown that this threshold acts as a good criterion to distinguish between poor groups and fossil aggregates since observations have shown that such a high magnitude gap is extremely unlikely to occur in ordinary groups or clusters (Beers et al. 1995).
The first fossil group identified, RX J1340.6+4018, was published in Nature (Ponman et al. 1994). Since then, few other objects have been assigned to this class resulting in a catalogue of 15 fossil systems summarized by Mendes de Oliveira et al.(2006).
| Name | LX,bola | |||
|---|---|---|---|---|
| NGC 1132 | 02 52 51.8 | -01 16 29 | 0.023 | 1.9 |
| RX J0454.8-1806 | 04 54 52.2 | -18 06 56 | 0.031 | 1.9 |
| ESO 306- G 017 | 05 40 06.7 | -40 50 11 | 0.036 | 129 |
| RX J1119.7+2126 | 11 19 43.7 | +21 26 50 | 0.061 | 1.7 |
| RX J1159.8+5531 | 11 59 51.4 | +55 32 01 | 0.081 | 22 |
| CL 1205+44 | 12 05 53.7 | +44 29 46 | 0.59 | 180 |
| RX J1256.0+2556 | 12 56 03.4 | +25 56 48 | 0.232 | 61. |
| RX J1331.5+1108 | 13 31 30.2 | +11 08 04 | 0.081 | 5.9 |
| RX J1340.6+4018 | 13 40 33.4 | +40 17 48 | 0.171 | 25 |
| RX J1416.4+2315 | 14 16 26.9 | +23 15 32 | 0.137 | 220. |
| RX J1552.2+2013 | 15 52 12.5 | +20 13 32 | 0.136 | 63 |
| NGC 6034 | 16 03 32.1 | +17 11 55 | 0.034 | 0.75 |
| NGC 6482 | 17 51 48.8 | +23 04 19 | 0.013 | 2.17 |
| RX J2114.3-6800 | 21 14 20.4 | -68 00 56 | 0.130 | 20 |
| RX J2247.4+0337 | 22 47 29.1 | +03 37 13 | 0.199 | 41 |
a bolometric X-ray luminosity taken in 1042 h ergs s-1
However, not all listed objects represent what is typically referred to as fossil group since more massive systems with velocity dispersions in the range of 600 km s-1, thus more appropriate to galaxy clusters, are also present (Cypriano et al. 2006, Mendes de Oliveira et al. 2006). More recently, Santos et al. (2007) have cross-correlated optical and X-ray data from the Sloan Digital Sky Survey (SDSS) (Adelman-McCarthy et al. 2008) and the ROSAT All Sky Survey (RASS) (Voges et al. 1999) respectively to identify new fossil group candidates. Their findings comprise a list of 34 candidates, ranging up to 0.489. The majority of all known 49 systems (86%) resides in the northern celestial hemisphere whereas only 7 objects (14%) have been identified in the southern one. The nearest fossil group was identified with the elliptical NGC 6482 at a redshift of 0.013 (Khosroshahi et al. 2004) while the most distant fossil aggregate was found at 0.59 combining HST, Chandra and XMM-Newton data (Ulmer et al. 2005, see Fig. 1).


2 The properties of fossil groups
Since the catalogue of known fossil aggregates is only made up of a few objects, an analysis of the optical or X-ray properties of fossil groups has only been carried out for a few systems leaving the formation process of this special class of objects still unclear. This section highlights some of the results that have been obtained over the last few years.
2.1 The luminosity function of fossil galaxy groups
The optical luminosity function (OLF) of fossil groups exhibits a lack of bright galaxies (by definition since fossil systems are characterised as low-density environments with no bright galaxies besides the central elliptical). Thus, the bright end of the OLF of these systems is unusual compared to what is normally observed in poor groups, with too few ∗ galaxies present. Few effort has been made so far to study the shape of the OLF at fainter magnitudes. Existing studies focusing on the fainter part of the OLF of fossil galaxy groups have only investigated three fossil systems. Surprisingly, all these aggregates are rather classified as fossil clusters than groups due to their relatively large velocity dispersions (623 km s-1, 584 km s-1, and 565 km s-1)(Cypriano et al. 2006, Mendes de Oliveira et al. 2006, Mendes de Oliveira et al. 2009). Interestingly, besides the expected magnitude gap around ∗ galaxies, a dip in the OLF of RX J1552.2+2013 at the transition to dwarf galaxies at has been found (see Fig. 2). Such dips in the OLFs have been observed in several systems, mostly dense, dynamically well-evolved aggregates such as X-ray emitting cD clusters (Valotto et al. 2004) or compact groups of galaxies (Hunsberger et al. 1996), suggesting that there may be more than one mechanism driving the depletion of galaxies in these different environments. Assuming the merger scenario hypothesis from hierarchical galaxy evolution models, the lack of ∗ galaxies is explained by dynamical friction, resulting in a deceleration of the orbital velocity of a galaxy which loses its kinetic energy to the surrounding dark matter particles, and subsequent merging. The same physical processes cannot be efficient enough to reproduce the comparatively small number of low-mass galaxies around . One explanation for these missing galaxies could be a succession of tidal encounters (Gnedin 2003). If this scenario is correct, one would not expect such a dip in the luminosity functions for less rich galaxy aggregates than the observed fossil cluster, since the galaxy density and thus the tidal stripping efficiency is much lower in these systems. However, RX J1416.4+2315 and RXJ1340.6+4018 do not show any evidence of a dip in the OLF around , suggesting that the scenario of fossil group formation is far more complicated than expected. More studies focusing on multi-object spectroscopy of the faint-galaxy population in fossil groups or fossil systems in general is therefore needed.
2.2 Masses and mass-to-light ratios of fossil groups
The symmetric and regular X-ray emission together with the lack of ∗ galaxies and the large early-type fraction observed in fossil groups suggest that these systems are old, evolved systems. Thus, from a dynamical point of view, fossil groups should present relaxed, virialized galaxy aggregates. The dynamical properties of the faint-galaxy population of fossil systems studied so far show that the radial velocity distributions exhibit far too high velocity dispersions to be considered as remnants of what was initially a poor group of galaxies and are fairly well fit by a gaussian velocity distribution, indicating relaxed systems. It is feasible to estimate the masses of fossil groups from the gas density and temperature profiles of the extended X-ray gas component assuming the gas distribution to be spherically symmetric and in hydrostatic equilibrium. Then the total gravitational mass is given by
| (1) |
where is the mean molecular weight and the proton mass. X-ray studies confirm the high masses derived from the dynamical state of these systems, showing that the intragroup medium of a number of fossil groups is similar to those of galaxy clusters with temperatures exceeding even 4 keV for some aggregates. These results are inconsistent with the idea that fossil groups are the remains of galactic cannibalism in ordinary groups. Complementary, Yoshioka et al. (2004) has shown that the M/L ratios of four fossil groups reach up to M⊙/L⊙ being at least one order of magnitude higher than the typical M/L ratios for groups and clusters of comparable mass supporting the idea that it is unlikely that these systems are the remnants of regular groups and clusters. Other recent studies derive much lower values of M/L, however (e.g. Sun et al. 2004), showing that a general formation scenario for fossil systems is far from understood and further observations in both optical and X-rays are needed to get reliable mass estimates for a higher number of fossil aggregates and to see if all fossil structures resemble cluster-like systems rather than groups.
2.3 Surface brightness profiles of the central ellipticals
The shape of the surface brightness profiles of ellipticals are known to depend on the formation histories of these systems and can thus act as indicators for different imaginable evolution tracks. More precisely, dissipationless merger simulations from Naab & Burkert (2003) have shown that unequal-mass mergers lead to fast rotating, discy ellipticals, while equal mass mergers produce slowly rotating, pressure supported systems. Major mergers between bulge dominated systems result in boxy ellipticals, independent of the mass ratio while merger remnants that subsequently accrete gas are always discy. More recently, it has been shown that the mergers of spiral galaxies alone cannot reproduce the kinematic and photometric properties of very massive ellipticals (Naab, Khochfar & Burkert 2006) nor can they reproduce the observed correlation between isophotal shapes and the luminosity of ellipticals. Khoshroshahi et al. (2006) have investigated the profile shapes of the central ellipticals in seven fossil systems with the conclusion that the isophote shapes of ellipticals in fossil groups are different compared to the brightest central galaxies in non-fossil systems, especially rich clusters. Luminous elliptical galaxies in non-fossil systems do not present discy isophotes (Kormendy & Bender 1996). In contrast, the brightest ellipticals in fossil groups show discy and boxy isophotes in similar proportions. If the central ellipticals in groups have indeed formed via the merging of all other major galaxies, then some of these merging events would have been gas rich, since groups are known to consist of a large spiral fraction. The discy charateristics of central ellipticals in fossil groups would then be consistent with numerical simulations, that discy isophotes result from gas-rich mergers. The difference in the observed isophote shapes of fossil group central galaxies and the brightest cluster galaxies does not rule out the possible evolutionary link of infalling pre-processed merged ellipticals from groups in clusters, however. This could still be the case if these ellipticals have undergone later gas-free mergers within the cluster environment. Moreover, about 40% of the brightest cluster galaxies exhibit at least one secondary nucleus, strongly supporting the idea of late mergers within the cluster environment. Further investigation of the isophote shape characteristics of central ellipticals in fossil groups will help to confirm or question the existing results and will shed more light on the evolution of fossil group central ellipticals and possible connection to the brightest cluster galaxies.
2.4 Scaling relations in fossil groups
The first study of the scaling properties of fossil groups compared to ordinary groups and clusters was carried out by Khoshroshahi et al. (2007). Based upon Chandra X-ray observations as well as optical imaging and spectroscopy this study comprised the information of seven fossil groups showing regular, symmetric X-ray emission, indicating no recent mergers. Scaling relations focusing on the total gravitational mass, X-ray temperature, X-ray luminosity, group velocity dispersion and the optical luminosity were studied. For a given optical luminosity of the whole group, fossil systems turn out to be more X-ray luminous than non-fossil groups. Focusing on the relation, fossils cannot be distinguished from ordinary groups or clusters, however. Fossils also show that for a given group velocity dispersion, X-ray luminosity and temperature are higher compared to non-fossil systems. The relation suggests that fossils are hotter, for a given total gravitational mass, consistent with an early formation epoch.
3 The search for new fossil group candidates
Complementary to the previous work on fossil groups as highlighted in section 2, the attempt to identify new fossil structures was made by the authors. This undertaking seems reasonable since the space densities of fossil groups determined so far suggest that these systems are as abundant as Hickson compact groups while the actual catalogue comprises only a negligible fraction compared to HCGs. The CDM concordance model ( 0.3, 0.7, 70 km s-1) was used throughout this work. Luminosity distances and angular diameter distances have been calculated via the Cosmology Calculator (Wright 2006). In order to identify new fossil group candidates, the Sloan Digital Sky Survey and Rosat All Sky Survey have been cross-correlated to shortlist candidates of interest that meet the classification criteria as proposed by Jones et al. (2003). The query was defined via Structured Query Language (SQL). A similar approach has been carried out by Santos et al. (2007) focusing on different selction criteria, however. The query presented here focuses on intrinsically bright , red galaxies relating to ellipticals. The lower limit in absolute magnitude was ensured by calculating the corresponding apparent magnitudes via luminosity distances derived from the SDSS spectroscopic redshifts of the central ellipticals
| (2) |
accounting for galactic extinction and -correction too. Only galaxies with an entry in the SDSS ROSAT table were considered for the further shortlisting of fossil group candidates. The associated X-ray component had to be extended with a ROSAT extent parameter of at least one arcsecond. This value does not reflect the true extent of the X-ray source but gives the excess over the ROSAT point-spread function. Furthermore the distance of the ROSAT source had to be less than 100kpc from the central elliptical accounting also for the ROSAT position error. The SQL code is given in appendix A. The resulting sample was finally shortlisted via the criterion forcing all systems to have no galaxies with mag in the SDSS band within one-half virial radius. In contrast to the work of Santos et al. (2007) who use a constant value of Mpc for half the virial radius, the description of Evrard et al. (1996)
| (3) |
as used by Jones et al. (2003) was applied here assuming a lower limit of the X-ray temperature of fossil groups of 0.7 keV. The criterion was accounted for via an SDSS SQL function (see appendix A). The remaining objects were checked for morphology. Five galaxies were identified as spirals while three objects have been found in the vicinity of bright stars. These systems have been excluded from the sample leaving a final list of 34 previously nondetected fossil group candidates. The query also reidentified objects listed in the Santos et al. (2007) sample. However, many objects could not be reidentified since the procedure used here excludes all galaxies within half the virial radius not taking into account possible background galaxies, thus eliminating possible fossil group candidates that would pass the criterion if group memberships were known. This indicates that there might be far more fossil candidates in our query when accounting also for group memberships via photometric redshifts. Table 3 gives coordinates as well as SDSS and ROSAT identifications of the new fossil group candidates. Table 4 presents the most important properties of the fossil group central ellipticals as well as the associated ROSAT X-ray component. Fig. 5 shows a colour-magnitude diagram of the newly found fossil group central ellipticals as well as the Santos et al. (2007) sample. The symbol size indicates the prominence of the associated X-ray source, visualizing the ROSAT extent/ ratio as presented in Table 4. Arrows point to galaxies that have been observed with the William Herschel Telescope (WHT) and the Very Large Telescope (VLT). In order to get a glimpse on the optical luminosity function (OLF) of the newly detected fossil group candidates, SDSS photometric and spectroscopic redshifts, when available, have been used to estimate group memberships and construct an OLF for all systems. Some of the OLFs confirm the lack of faint galaxies as previously observed by Mendes de Oliveira et al. (2006) while most of the systems don’t show a dip in the OLF at fainter magnitudes. Fig. 4 presents the photometrically selected OLF of RX J1520.9+4840 from the new list of fossil aggregates. A clear dip in the OLF is visible around . It has to kept in mind, however, that this result is based upon photometric redshifts which exhibit far larger errors than spectroscopic measurements necessitating the use of multi-object spectroscopy of the faint galaxy population to confirm the lack of faint galaxies in fossil galaxy groups.
4 Observations
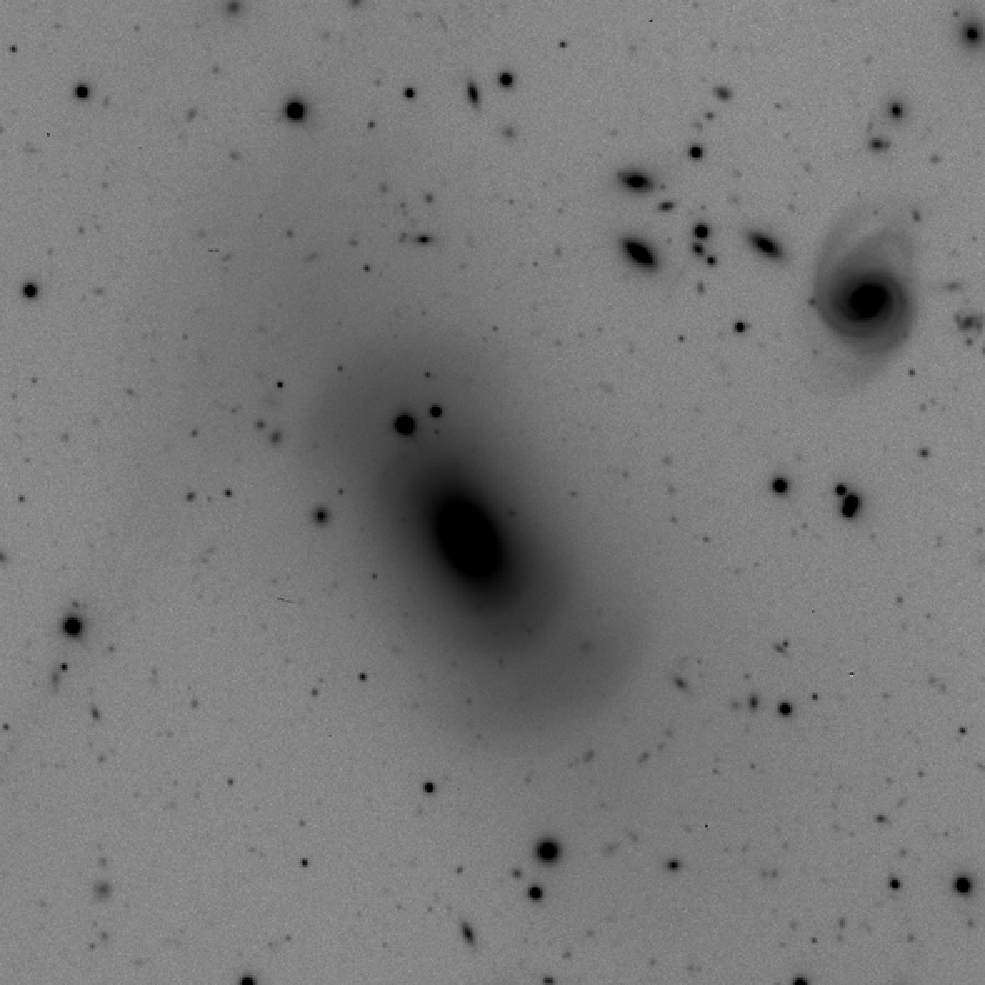
Table 2 summarizes the observations at the WHT and VLT that have been carried out to complement the existing data on fossil groups. Long-slit spectra have been obtained with the ISIS spectrograph at the WHT to measure Lick-IDS indices (Worthey et al. 1994) of the central ellipticals from both the new sample as well as fossil groups from the literature. These measurements will yield radial profiles of ages and metallicities of the central elliptical stellar populations that are supposed to contain the merger history of the whole group. It is then feasible to study how uniform the process of coalescence occured in these systems and if fossil group central ellipticals are indeed the progenitors of brightest cluster galaxies (BCGs) or show similar stellar populations as found in non BCGs. In addition, VIMOS observations in service mode have been carried out at VLT UT3 Melipal to study the OLF of one fossil aggregate. Spectroscopic targets have been selected via SDSS magnitudes to determine the OLF down to corresponding to . This magnitude limit ensures to identify a dip in the OLF around if present. Fig. 3 shows the VIMOS pre-image of the central elliptical of the fossil group candidate RX J1548.9+0851. The image reveals shells around the central elliptical that would confirm the idea of the system being the remainder of multiple merging events. The aquired data from the WHT and the VLT will shed more light on the formation process of fossil groups of galaxies complementing the few optical studies that have been carried out so far.

| galaxy | exposure [s] | resolution [Å pix-1] | date | |||
| William Herschel Telescopea | ||||||
| blue | red | |||||
| RX J0752.7+4557 | 07 52 44.2 | +45 56 57.4 | 3 3000 | 0.86 | 0.26 | 20.12.2008 |
| RX J0844.9+4258 | 08 44 56.6 | +42 58 35.7 | 3 3000 | 0.86 | 0.26 | 20.12.2008 |
| NGC 1132 | 02 52 51.8 | -01 16 28.8 | 4 2700 | 0.86 | 0.26 | 20.12.2008 |
| RX J1548.9+0851 | 15 48 55.9 | +08 50 44.4 | 3 2600 | 0.86 | 0.93 | 28.04.2009 |
| RX J1520.9+4840 | 15 20 52.3 | +48 39 38.6 | 3 2600 | 0.86 | 0.93 | 28.04.2009 |
| RX J1152.6+0328 | 11 52 37.6 | +03 28 21.8 | 3 2700 | 0.86 | 0.93 | 28.04.2009 |
| Very Large Telescopeb | ||||||
| RX J1548.9+0851 | 15 48 55.9 | +08 50 44.4 | 4500 | 0.51 | 26.05.2009 | |
a Observations carried out in Visitor Mode.
b Observations carried out in Service Mode. The date refers to the completion of the last Observing Block (OB) for the given target.
| ID Number | ROSAT Name | SDSS a | SDSS a | SDSS objid |
|---|---|---|---|---|
| (1) | (2) | (3) | (4) | (5) |
| 01. | RXJ0159.8-0850 | 01 59 49.3 | -08 49 58.8 | 587727884161581256 |
| 02. | RXJ0725.7+3741 | 07 25 41.3 | +37 40 27.7 | 587737826206482926 |
| 03. | RXJ0730.3+3728 | 07 30 20.4 | +37 27 40.8 | 587725775602450780 |
| 04. | RXJ0801.0+3603 | 08 00 56.8 | +36 03 23.6 | 587728905564258619 |
| 05. | RXJ0825.9+0415 | 08 25 57.8 | +04 14 48.3 | 587732702851170810 |
| 06. | RXJ0826.9+3108 | 08 26 57.6 | +31 08 04.9 | 587732469849325635 |
| 07. | RXJ0909.9+3106 | 09 09 53.3 | +31 06 03.2 | 588016878295318532 |
| 08. | RXJ1005.8+1058 | 10 05 50.7 | +10 58 11.7 | 587734949665243313 |
| 09. | RXJ1006.1+0710 | 10 06 08.3 | +07 10 29.5 | 587732579379904650 |
| 10. | RXJ1030.5+1416 | 10 30 34.8 | +14 15 41.8 | 587735349637349534 |
| 11. | RXJ1041.8+5303 | 10 41 47.6 | +53 03 41.4 | 587733081343656013 |
| 12. | RXJ1055.1+4246 | 10 55 06.6 | +42 45 24.4 | 588017626148634721 |
| 13. | RXJ1056.1+0252 | 10 56 06.6 | +02 52 13.5 | 587726033315299465 |
| 14. | RXJ1107.4+1245 | 11 07 24.2 | +12 44 20.0 | 588017567629509093 |
| 15. | RXJ1115.9+0130 | 11 15 51.9 | +01 29 55.1 | 587728307491897590 |
| 16. | RXJ1128.6+3530 | 11 28 34.4 | +35 30 14.0 | 587739305286238362 |
| 17. | RXJ1152.6+0328 | 11 52 37.6 | +03 28 21.8 | 587726033858330762 |
| 18. | RXJ1211.1+3520 | 12 11 08.3 | +35 19 58.8 | 587739304216232052 |
| 19. | RXJ1327.1+0212 | 13 27 01.0 | +02 12 19.5 | 587726015078465728 |
| 20. | RXJ1349.9+4217 | 13 49 51.1 | +42 16 47.8 | 588017604154687567 |
| 21. | RXJ1352.0+6105 | 13 51 58.3 | +61 04 19.0 | 588011219135889619 |
| 22. | RXJ1353.4+4424 | 13 53 20.3 | +44 24 19.8 | 588298662507184284 |
| 23. | RXJ1402.8+3431 | 14 02 46.6 | +34 31 08.0 | 587739131880603717 |
| 24. | RXJ1431.3-0054 | 14 31 21.2 | -00 53 44.3 | 588848898855469518 |
| 25. | RXJ1450.2+4134 | 14 50 08.3 | +41 33 59.8 | 588017116130246662 |
| 26. | RXJ1453.6+0359 | 14 53 38.5 | +03 59 33.4 | 587726101487747355 |
| 27. | RXJ1501.3+5455 | 15 01 18.0 | +54 55 18.3 | 588011101565354082 |
| 28. | RXJ1520.9+4840 | 15 20 52.3 | +48 39 38.6 | 587735666921898155 |
| 29. | RXJ1539.8+4143 | 15 39 51.4 | +41 43 25.4 | 587733397568356378 |
| 30. | RXJ1540.4+3622 | 15 40 23.0 | +36 21 56.6 | 587736751928770630 |
| 31. | RXJ1624.7+3727 | 16 24 43.4 | +37 26 42.4 | 587735666392105305 |
| 32. | RXJ1653.1+3909 | 16 53 07.8 | +39 08 53.1 | 588007005270966692 |
| 33. | RXJ1717.1+2931 | 17 17 06.9 | +29 31 21.1 | 587729408084935169 |
| 34. | RXJ2139.5-0722 | 21 39 28.5 | -07 21 46.6 | 587726878878728621 |
a Right ascension is given in hours, minutes, and seconds and declination is given in degrees, arcminutes, and arcseconds.
| central elliptical galaxy | ROSAT X-ray properties | ||||||||
| i′a | ga | Ma | ½b | c | extentc | (0.5-2keV)d | |||
| ID Number | redshifta | [mag] | [mag] | [mag] | [arcmin] | [arcsec] | [arcsec] | extent/c | [ergs s-1] |
| (1) | (2) | (3) | (4) | (5) | (6) | (7) | (8) | (9) | (9) |
| 01 . | 0.405 | 17.29 | 2.00 | -24.37 | 0.680 | 12.8 | 44 | 3.44 | 8.42E+44 |
| 02 . | 0.425 | 17.34 | 2.58 | -24.56 | 0.647 | 42.8 | 56 | 1.31 | 1.84E+44 |
| 03 . | 0.200 | 17.58 | 1.69 | -22.04 | 1.411 | 21.8 | 40 | 1.83 | 6.29E+43 |
| 04 . | 0.287 | 16.13 | 2.23 | -24.30 | 0.970 | 35.5 | 47 | 1.33 | 3.85E+44 |
| 05 . | 0.225 | 15.81 | 2.01 | -24.31 | 1.249 | 21.4 | 21 | 0.98 | 1.51E+44 |
| 06 . | 0.209 | 15.26 | 1.92 | -24.43 | 1.346 | 52.1 | 76 | 1.46 | 1.25E+44 |
| 07 . | 0.272 | 16.57 | 1.20 | -23.65 | 1.026 | 9.2 | 22 | 2.39 | 6.65E+44 |
| 08 . | 0.162 | 15.15 | 1.68 | -24.10 | 1.755 | 7.4 | 85 | 11.45 | 4.58E+43 |
| 09 . | 0.202 | 17.25 | 1.35 | -22.39 | 1.394 | 48.9 | 22 | 0.45 | 1.89E+43 |
| 10 . | 0.317 | 16.23 | 2.31 | -24.49 | 0.875 | 26.1 | 61 | 2.34 | 2.07E+44 |
| 11 . | 0.187 | 16.52 | 1.71 | -22.59 | 1.517 | 28.2 | 13 | 0.46 | 1.97E+43 |
| 12 . | 0.371 | 18.57 | 1.48 | -23.05 | 0.744 | 7.2 | 17 | 2.36 | 1.00E+44 |
| 13 . | 0.236 | 17.60 | 1.28 | -22.27 | 1.189 | 6.1 | 19 | 3.12 | 1.03E+45 |
| 14 . | 0.420 | 17.93 | 2.46 | -23.12 | 0.655 | 15.8 | 9 | 0.57 | 1.19E+44 |
| 15 . | 0.352 | 17.19 | 2.03 | -24.26 | 0.786 | 22.5 | 57 | 2.54 | 7.30E+44 |
| 16 . | 0.402 | 17.59 | 2.52 | -23.59 | 0.685 | 15.6 | 12 | 0.77 | 3.02E+44 |
| 17 . | 0.081 | 14.25 | 1.38 | -23.06 | 3.600 | 27.4 | 71 | 2.59 | 1.08E+43 |
| 18 . | 0.136 | 15.14 | 1.58 | -23.52 | 2.097 | 35.8 | 52 | 1.45 | 4.11E+43 |
| 19 . | 0.260 | 16.26 | 2.16 | -24.11 | 1.075 | 40.5 | 58 | 1.43 | 2.30E+44 |
| 20 . | 0.289 | 17.67 | 1.92 | -22.77 | 0.964 | 8.2 | 19 | 2.30 | 1.08E+44 |
| 21 . | 0.323 | 17.32 | 2.34 | -23.47 | 0.858 | 23.2 | 6 | 0.26 | 3.61E+43 |
| 22 . | 0.152 | 17.03 | 1.37 | -21.48 | 1.873 | 24.1 | 9 | 0.37 | 1.23E+43 |
| 23 . | 0.175 | 17.14 | 1.31 | -22.61 | 1.619 | 6.7 | 10 | 1.49 | 1.28E+43 |
| 24 . | 0.403 | 17.49 | 2.70 | -23.80 | 0.684 | 43.1 | 52 | 1.21 | 2.27E+44 |
| 25 . | 0.157 | 14.89 | 1.65 | -24.02 | 1.818 | 35.9 | 54 | 1.50 | 2.24E+43 |
| 26 . | 0.370 | 16.82 | 2.35 | -24.24 | 0.746 | 36.1 | 42 | 1.16 | 2.33E+44 |
| 27 . | 0.339 | 17.24 | 1.83 | -23.63 | 0.818 | 7.3 | 15 | 2.05 | 1.54E+44 |
| 28 . | 0.074 | 13.35 | 1.37 | -24.12 | 3.933 | 31.4 | 71 | 2.26 | 4.35E+43 |
| 29 . | 0.119 | 14.83 | 1.55 | -23.96 | 2.404 | 10.3 | 12 | 1.17 | 7.06E+42 |
| 30 . | 0.231 | 16.53 | 1.76 | -23.35 | 1.213 | 27.7 | 11 | 0.40 | 2.63E+43 |
| 31 . | 0.199 | 16.89 | 1.79 | -23.99 | 1.417 | 12.1 | 13 | 1.08 | 2.97E+43 |
| 32 . | 0.147 | 15.70 | 1.64 | -23.14 | 1.945 | 33.0 | 19 | 0.58 | 1.40E+43 |
| 33 . | 0.278 | 16.95 | 1.68 | -22.12 | 1.003 | 4.2 | 30 | 7.08 | 6.92E+44 |
| 34 . | 0.410 | 17.58 | 2.50 | -23.88 | 0.672 | 26.3 | 20 | 0.76 | 1.53E+44 |
a Redshifts and magnitudes are taken from the SDSS DR 6.
b Half the virial radius given in arcminutes. The virial radius was estimated via as used in Jones et al. (2003). For the X-ray temperature a lower limit of 0.7 keV was assumed.
c ROSAT and extent prameters. gives the distance of the X-ray source to the central elliptical. Extent gives the excess of the detected X-ray source over the ROSAT PSF. The ratio extent/ indicates the prominence of the X-ray source with larger values indicating more extended sources close to the central elliptical.
d ROSAT X-ray luminosities. ROSAT countrates have been converted to X-ray fluxes via the tool PIMMS (Mukai, 1993) assuming a Raymond-Smith model with 2keV and a metallicity of . HI column densities of the Leiden/Argentine/Bonn (LAB) Survey of Galactic HI (Kalberla et al. 2005) were taken into account to determine extinction-free fluxes.

Acknowledgements.
Paul Eigenthaler is supported by the University of Vienna in the frame of the Initiative Kolleg (IK) The Cosmic Matter Circuit I033-N.References
- [1] Adelman-McCarthy, J. et al.: 2008, ApJS 175 , 297
- [2] Barnes, J.E.: 1989, Nature 338 , 123
- [3] Beers, T. et al.: 1995, AJ 109 , 874
- [4] Binney, J. & Tremaine, S..: 1987, Princeton University Press
- [5] Chandrasekhar, S.: 1943, ApJ 97 , 255
- [6] Cypriano, E.S. et al.: 2006, AJ 132 , 514
- [7] Evrard, A.E. et al.: 1996, ApJ 469 , 494
- [8] Gnedin, O.Y.: 2003, ApJ 589 , 752
- [9] Geller, M.J., Huchra, J.P.: 1983, ApJS 52 , 61
- [10] Hickson, P.: 1982, ApJ 255 , 382
- [11] Hickson, P.: 1997, ARA&A 35 , 357
- [12] Hunsberger, S.D. et al.: 1996, ApJ 462 , 50
- [13] Jones, L.R. et al.: 2003, MNRAS 343 , 627
- [14] Kalberla, P. et al.: 2005, A&A 440 , 775
- [15] Khosroshahi, H.G. et al.: 2004, MNRAS 349 , 1240
- [16] Khosroshahi, H.G. et al.: 2006, MNRAS 372 , 68
- [17] Khosroshahi, H.G. et al.: 2007, MNRAS 377 , 595
- [18] Kormendy, J., Bender, R.: 1996, ApJ 464 , 119
- [19] Mendes de Oliveira, C. et al.: 2006, AJ 131 , 158
- [20] Mendes de Oliveira, C. et al.: 2009, AJ 138 , 502
- [21] Mukai, K.: 1993, Legacy 3 , 21
- [22] Mulchaey, J.S.: 2000, ARA&A 38 , 289
- [23] Naab, T., Burkert, A.: 2003, ApJ 597 , 893
- [24] Naab, T., Khochfar, S., Burkert, A.: 2006, ApJ 636 , 81
- [25] Nolthenius, R. & White, S.: 1987, MNRAS 225 , 505
- [26] Ponman, T.J. et al.: 1994, Nature 369 , 462
- [27] Santos, W.A. et al.: 2007, AJ 134 , 1551
- [28] Sun, M.et al.: 2004, ApJ 612 , 805
- [29] Tully, R.B.: 1987, ApJ 321 , 280
- [30] Ulmer, M.P. et al.: 2005, ApJ 624 , 124
- [31] Valotto, C.A. et al.: 2004, ApJ 603 , 67
- [32] Vikhlinin, A. et al.: 1999, ApJ 520 , 1
- [33] Voges, W. et al.: 1999, A&A 349 , 389
- [34] Worthey, G. et al.: 1994, ApJS 94 , 687
- [35] Wright, E.L.: 2006, PASP 118 , 1711
- [36] Yoshioka, T. et al.: 2004, AdSpR 34 , 2525
Appendix A SQL Query
SQL query used within SDSS DR6 to select the fossil group candidates listed in Table 3.
SELECT p.objid, s.z, p.ra, p.dec, p.r, p.g-p.r, r.delta, r.cps, r.cpserr, r.extent
FROM specobj s, photoobj p, rosat r
WHERE s.bestobjid= p.objid
Selection of objects that have been spectroscopically classified as galaxies with and show an entry in the SDSS ROSAT table.
AND s.specclass = 2
AND p.objid= r.objid
AND s.z BETWEEN 0.0 AND 0.50
Selection of bright (), red () galaxies via the relation: 11 1 and were implemented via third order polynomials that were fit to the and data derived from the Cosmology Calculator and SDSS for redshifts up to . The kcorr_r entry in the SDSS photoz table was not directly used in the query since these values are based upon photometric redshifts which can strongly deviate from spectroscopic redshifts and would lead to wrong results. Therefore was determined based upon galaxies with that show hardly any difference in photometric and spectroscopic redshifts.
AND p.r<
-21.0
+ 25 + 5*LOG10 ((-0.15958 + 4290.00033 *s.z + 3255.86186 *s.z*s.z - 1009.42877 *s.z*s.z*s.z) *0.7)
- 0.00554 + 1.31479 *s.z - 1.08771 *s.z*s.z + 5.09347 *s.z*s.z*s.z
+ p.extinction_r
AND p.g - p.r > 0.8
Selecting galaxies with an extended X-ray source within 100kpc taking into account the ROSAT position error. 22 2 The polynomial gives the angular scale as a function of redshift based upon angular diameter distances .
AND r.extent >= 1
AND r.delta <= 100/(0.00717 + 20.42378 *s.z - 21.97056 *s.z*s.z + 11.06756 *s.z*s.z*s.z) + r.poserr
Identifying non-fossil systems. All objects within half the virial radius that are photometrically classified as galaxies and less than 2 mag fainter than the central elliptical are counted. 33 3 This query has been performed for all galaxies shortlisted via the previous criteria. ra, dec give the coordinates of the central galaxy in decimal degrees while radius presents half the virial radius in arcminutes. m1 stands for the band magnitude of the central galaxy.
SELECT count(*)-1
FROM  photoObj p, dbo.fGetNearbyObjEq(ra, dec, radius) n

WHERE p.objID = n.objID
AND p.type = 3
AND p.r - m1 < 2.0