The dynamics of the giant radio galaxy 3C 457
Abstract
We present multi-frequency radio observations with the Giant Metrewave Radio Telescope and Very Large Array, and X-ray observations with the X-ray Multi-Mirror Mission (XMM-Newton) telescope of the giant radio source (GRS) 3C 457. We have detected the core, lobes and the environment of the GRS in X-ray. We examine the relationships between the radio and X-ray emission, determine the radio spectrum over a large frequency range and attribute the X-ray emission from the lobes to the inverse-Compton scattering of cosmic microwave background (CMB) photons. The magnetic field strength of the lobes is very close to the equipartition value. Both the lobes are in pressure balance near the hotspots and apparently under-pressured towards the core. The X-ray spectrum of the core of the GRS consists of an unabsorbed soft power-law component and a heavily absorbed hard power-law component. The soft unabsorbed component is likely to be related to the radio jets. There is no strong evidence of Fe K emission line in our data.
Keywords:
galaxies: active – galaxies: jets – galaxies: nuclei – quasars: general – radio continuum: galaxies – galaxies: individual: 3C 457 – X-rays: galaxies1 Introduction
Giant radio sources (GRSs) are defined to be those which have a projected linear size 1 Mpc (Ho=71 km s-1 Mpc-1, =0.27, =0.73, Spergel et al. 2003). The lobes of GRSs extend well beyond the interstellar medium (ISM) and the coronal halos of the host galaxies. Therefore the light synchrotron plasma interacts with the heavier intergalactic medium (IGM). The very existence of GRSs raises important questions about the properties of the IGM they inhabit. For radio lobes to exist, there must be a medium to confine them, either through thermal pressure or ram pressure. On Mpc scales, the external pressure even in a rich cluster must be several orders of magnitude lower than in the typical environments of smaller radio galaxies, and in fact we know already that GRSs do not inhabit particularly rich environments. What phase of the IGM governs the dynamics of giant radio sources? If we could answer this question, it would be possible to use GRSs at cosmological redshifts to probe the evolution of this phase over cosmic time. Studying the GRSs, we might also be able to determine whether these are simply probing the extreme edge of the intra-group or intra-cluster media, or whether they require some other medium, such as the Warm Hot Intergalactic Medium (WHIM), for lobe formation on these scales to be possible. In a recent piece of work Safouris et al. (2008) have shown that the GRS MRC B0319-454 appears to be embedded within a large scale galaxy filament. Croston et al. (2004) reported that the lobes of large radio sources are close to pressure balance near the hotspots and are under-pressured towards the core, if it is assumed that the protons are not energetically dominant in radio lobes as is likely to be the case (Croston et al. 2005). This means that the over-pressured lobes required by self similar models (Falle 1991; Kaiser & Alexander 1997; Kaiser, Dennett-Thorpe & Alexander 1997) of FRII radio sources are no longer supported by observations, at least for large radio sources, as discussed by Hardcastle & Worrall (2000). This raises important questions about how such large radio galaxies evolve.
To resolve the various issues raised in the above paragraph it is necessary to measure the internal and external pressure of the lobes of giant radio sources. If the GRS environment consists of a hot group or cluster scale hot-gas medium then the external pressure can be measured via X-ray observations of thermal bremsstrahlung emission from the intracluster medium (ICM). X-ray observations (combined with radio ones) also allow us to measure internal pressure of the lobes via the inverse-Compton (IC) process, in which the relativistic electrons in the lobe scatter photons from the cosmic microwave background (CMB), (hereafter IC-CMB). Detections of IC emission have the potential to clarify the particle content and magnetic field strength of radio galaxies because they allow direct measurements of the electron energy density, unlike observations of radio synchrotron emission where the electron density and the magnetic field strength cannot be decoupled (cf. Croston et al. 2005). This technique has been used successfully to estimate magnetic field strengths in the lobes and hotspots of many smaller Fanaroff-Riley class II (Fanaroff & Riley 1974) sources, and constrain source dynamics and particle content by comparing the internal pressure with the external pressure from X-ray emitting hot gas (Hardcastle et al. 2002; Croston et al. 2004). An extensive study of X-ray emission from the lobes of a sample of FRII radio galaxies and quasars has shown that although a few may be magnetically dominated by factors of 2 or more, about 70 per cent of the sample have magnetic field strengths within 35 per cent of the equipartition value, or electron dominance by a factor of 5 (Croston et al. 2005; see also Kataoka & Stawarz 2005). The key point, however, is that observations of inverse-Compton radiation allow us to measure the internal pressure in the lobes of individual objects, which then allows us to understand the dynamics of the radio source.
To date there has been little attempt to study the lobes of powerful GRSs using this technique. Partly this is a consequence of much of the early work having been done with Chandra, with its relatively small field of view and poorer surface brightness sensitivity. However, the work of Croston et al. (2004), who used XMM-Newton to observe the low-redshift, 600700 kpc sources 3C 223 and 3C 284, shows the potential of such studies. Inverse-Compton detections of true giant sources are essential if we are to measure the lobe pressures, and thus the pressure of the confining medium, in this poorly understood population.
The giant radio sources with very extended diffuse radio lobes are very suitable for such kind of analysis, as (for a given radio luminosity) larger sources produce more IC-CMB emission. We have chosen to look for IC emission for the first time from a GRS, 3C 457, so as to investigate various issues, including pressure balance of the radio lobes, equipartition between magnetic field and particles in lobes, and the interaction of the lobes and the external environment. 3C 457 is an FRII-type (Fanaroff & Riley 1974) giant radio galaxy with a largest angular size of 190 arcsec. It is situated at a redshift of 0.428 (Perryman et al. 1984). For our cosmology, defined in the beginning of this section, the redshift of 0.428 corresponds to a scale of 5.567 kpc arcsec-1 giving a largest linear size of 1058 kpc. 3C 457 has two large, symmetric diffuse lobes. It is comparatively bright at radio wavelengths and so it is likely to be detected in X-rays via IC-CMB emission. Moreover, since it is a radio galaxy, not a quasar, it is easier to separate the nuclear emission from the lobe-related X-ray emission. In this paper, we present XMM-Newton, Giant Metrewave Radio Telescope (GMRT) and Very Large Array (VLA) observations and results of a study of the FRII giant radio source 3C 457. We describe the radio observations and data analysis in Section 2, X-ray observations and data analysis in Section 3, observational results in Section 4, discussion in Section 5 and concluding remarks in Section 6.
| Telescope | Array | Observed | Date of Observations |
|---|---|---|---|
| Config. | Frequency | ||
| (MHz) | |||
| (1) | (2) | (3) | (4) |
| GMRT | 239 | 2007 Aug 22 | |
| GMRT | 334 | 2007 Sep 01 | |
| GMRT | 605 | 2007 Aug 22 | |
| VLAa | B | 1477 | 1987 Dec 02 |
| VLAa | C | 4710 | 2000 Jun 12 |
a archival data from the VLA
2 Radio observations and data analysis
Both the GMRT and the VLA observations were made in the standard fashion, with each target source observation interspersed with observations of the phase calibrator. The primary flux density calibrator was either 3C 48 or 3C 286, with all flux densities being on the scale of Baars et al. (1977). The total observing time on the source is a few hours for the GMRT observations while for the VLA observations the time on source is 20 minutes. The low-frequency GMRT data were sometimes significantly affected by radio frequency interference, and these data were flagged. All the data were analysed in the standard fashion using the NRAO AIPS package. All the data were self-calibrated to produce the best possible images. The observaing log for both the GMRT and the VLA observations is given in Table 1.
3 X-ray observations and data analysis
3C 457 was observed with XMM-Newton in December 2007, with the medium filter and the pn camera in Extended Full Frame mode for an observation duration of 53, 53 and 49 ks for the MOS1, MOS2 and pn cameras, respectively. The data were reduced using the XMM-Newton Scientific Analysis Software (SAS) version 7.1, and the latest calibration files from the XMM-Newton website. The pn data were filtered to include only single and double events (PATTERN ), and #XMMEA_EP (excluding bad columns and rows), and the MOS data were filted according to the standard flag and pattern masks (PATTERN and #XMMEA_EM, excluding bad columns and rows). Filtering for good-time intervals was also applied to exclude regions affected by background flares, using a lightcurve in the energy range where the effective area of X-rays is negligible (10 – 12 keV for MOS, 12 – 14 keV for pn); the remaining exposure after GTI-filtering was 35, 35 and 22 ks for the MOS1, MOS2 and pn cameras, respectively. Spectra were extracted using the SAS task evselect, with appropriate response files generated using rmfgen and arfgen, and spectral analysis was carried out using xspec.
4 Observational results
4.1 Radio data


The GMRT images of the source at the different frequencies are presented in Figure 1, while the observational parameters and some of the observed properties are presented in Table 2. The radio images of 3C 457 in Figure 1 show its large-scale structure, with no core detected at 234 and 334 MHz. However, the images at 605, 1477 and 4710 MHz show a clear detection of a core in addition to the diffuse lobes. The radio spectra of different components are shown in Figure 3. The core spectral index is 0.4 between 605 and 4866 MHz.
The diffuse lobe emission of 3C 457 clearly shows a backflow structure and, at low frequencies, fills up the region between the hotspots and the core. Both the lobes have radio spectra consistent with a power law within our frequency coverage (see Figure 3). The spectral indices are 1.010.04 and 0.980.04 for the north-eastern lobe (NE lobe) and south-western lobe (SW lobe) respectively. The spectral index obtained from the integrated spectrum shown in Figure 3 is 0.990.04.


4.2 X-ray data
Figure 4 shows the 605 MHz GMRT contour map of 3C 457 overlaid on top of the XMM-Newton image in grey scale in the energy range 0.3 to 10 keV. The X-ray emission from the AGNs in the field and the lobes of 3C 457 are prominent. The three most prominent AGNs in this field are the core of 3C 457 (RA: 23 12 07.4460.003 Dec: 18 45 40.420.04), an AGN near the southern hotspot of 3C 457 (AGN-1, RA: 23 12 03.8420.003 Dec: 18 44 12.410.05) and an AGN to the north-west of the host of 3C 457 at an angular distance of 140 arcsec (AGN-2, RA: 23 11 57.5300.001 Dec: 18 47 03.580.01). All position coordinates are in J2000. All three of these AGNs have radio counterparts, as evident from Figure 1 and Figure 4.
We extracted spectra from the MOS1, MOS2 and pn files. For each of the three AGNs mentioned above, we used a small circular extraction region around it, so that the spectra contain mostly AGN emission with as little possible contamination from any thermal emission around the AGN if present. The radii of the spectral extraction circles were 16 arcsec, 9 arcsec and 26 arcsec for the core, AGN-1 and AGN-2, respectively. For the spectral extraction of the lobes we used rectangular extraction regions covering the extent of the diffuse radio emission as shown in the GMRT and VLA images. We also looked for group/cluster scale thermal emission in the environment around the core of 3C 457 within a circular region of radius 145 arcsec (800 kpc). The circular region for the spectral extraction of the environment should be large enough to encompass most of the environment around the radio galaxy, and so would typically encircle the lobes and extend somewhat beyond. However, since 3C 457 is a giant radio galaxy, a circular region enclosing the entire source is in this case more than enough as most of the environmental emission comes from the central region. It is not important whether we choose a region of 145 arcsec or much larger, as the environment follows a -model profile and falls off rapidly beyond arcsec (see Figure 10). Spectral extraction regions are all shown in Figure 5. For spectral analysis of the AGNs, local background subtraction was used. Details of background subtraction for the lobe regions and the hot gaseous environment is discussed later. A scaling has been done for the source and background counts to account for the difference in areas between the source extraction and background subtraction regions.
The value of the Galactic neutral hydrogen column density ( cm-2), as obtained from Dickey & Lockman (1990), does not yield overall acceptable fits to the spectra of all of the X-ray sources in the field of view with plausible models. The Galactic extinction measurement from Schlegel, Finkbeiner & Davis (1998) as well as our data suggest a higher value of along the line of sight (LOS) towards 3C 457. Using the formula cm-2 (Spitzer 1978) and substituting (colour excess in mag) of 0.258 mag, as obtained from Schlegel et al. (1998), we get cm-2, which is higher than the value obtained from Dickey & Lockman (1990). As a further investigation of the appropriate value for the we also modelled the spectra of AGN-1 and AGN-2, which are within 165 arcsec of the core, by fitting a single power law (wabs(pow) in xspec). The fits are acceptable and we get very similar best-fitting values of , which are 0.238 and 0.225 cm-2 for AGN-1 and AGN-2 respectively. These values of will account for the intrinsic as well as Galactic . Therefore, we consider the maximum value of Galactic , neglecting the error in our model fits, to be 0.238 cm-2. It is unlikely that both AGN-1 and AGN-2 will conspire to have similar intrinsic column density to yield the similar (within errors) total column density, and so it is quite plausible that the intrinsic column density of AGN-1 and AGN-2 are small compared to the Galactic . The fits are acceptable for values of between 0.15 and 0.238 cm-2. As AGN-2 is stronger and the fit is better, we adopted an value of 0.225 cm-2 and freeze it for all the spectral fits described below. However, we discuss later in the paper how our results are modified if the is instead 0.15 cm-2, which yields best-fit parameters for the X-ray AGN that are not completely unacceptable/unphysical.
4.2.1 Spectrum of the core
Our initial fitting of a single power law to the core spectrum was unacceptable (= 3.88), and so multiple components are obviously required. We therefore fitted the spectrum with two composite models: Model I – a double power law (a soft power law with Galactic absorption plus a hard absorbed power law; wabs(pow+zwabs(pow)) in xspec), and Model II – a soft mekal model plus a hard absorbed power law (wabs(mekal+zwabs(pow)) in xspec). Since 3C 457 is a radio galaxy it might be expected to have a double power-law spectrum, with one component related to the accretion process in the nucleus and the other related to the emission from the jet base (e.g. Hardcastle, Evans & Croston 2006), which is the physical motivation for Model I. We also know that there is a hot gaseous medium around any radio galaxy (see Miller et al. 1999; Hardcastle & Worrall 1999; Worrall & Birkinshaw 2000; Croston et al. 2003; Belsole et al. 2004; Belsole et al. 2007) which emits via thermal bremsstrahlung. Model II allows us to investigate whether this thermal component is prominent relative to the nuclear component. Both the model fits are equally good. The best-fitting parameters for both the models are given in Table 3 which is self explanatory.
4.2.2 Spectra of the lobes
We then extracted the spectrum of the SW lobe. The rectangular spectral extraction region of the SW lobe is shown in Figure 5. We choose the rectangle to minimise any possible contribution from the core and AGN-1. The background region was placed at the same distance from the core so as to minimise the error in background subtraction. We separately fitted mekal and power law models to the spectrum of the SW lobe. Both the fits have similar value. However, the best-fitting temperature of the mekal model is high, which is consistent with the result obtained by Croston et al. (2004) for the radio source 3C 223. The single power law and mekal model fit parameters are in Table 4. For the north-eastern radio lobe (NE lobe) it is not possible to carry out spectral fits as the number of counts is small, partly because of overlap with the chip gaps of the pn camera. However, we determined the 1-keV flux density of the NE lobe so as to enable a magnetic field calculation (see Sec 5.1.2). We used the ratio of total MOS1 and MOS2 counts for the NE lobe to SW lobe ratio to scale the 1-keV flux density of SW lobe obtained from the fit to determine the 1-keV flux of NE lobe.
4.2.3 Spectrum of the hot gaseous environment
We examined any possible thermal gas environment around the core of 3C 457. We extracted the spectrum within a large circle of radius of about 145 arcsec ( 800 kpc) with the position of the core as the centre. We excluded the core and two lobes of 3C 457, and all the AGNs that are within the extraction region (see Figure 5) for the environment. We have also excluded any AGNs that are outside but close to the extraction region. For background subtraction we used a circular background region of radius 90 arcsec at a distance of 350 arcsec from the core of 3C 457 towards a position angle of 165∘. The background region is sufficiently far from the core of 3C 457 and any other AGN so that it is unlikely to contain any emission from hot gaseous medium or other AGNs. We fitted the spectrum of only the environment with the mekal model at a redshift () of 0.428 with the frozen values of cm-2 and metal abundance = 0.35 . This yields a reasonable fit with the gas temperature equal to 2.62 keV. The best-fitting parameters are shown in Table 4.

| Source | Freq. | Beam size | rms | SI | Cp | Sp | St | Cp | Sp | St | Cp | Sp | St | ||
|---|---|---|---|---|---|---|---|---|---|---|---|---|---|---|---|
| MHz | arcsec | arcsec | ∘ | mJy | mJy | mJy | mJy | mJy | mJy | mJy | mJy | ||||
| beam-1 | beam-1 | beam-1 | beam-1 | ||||||||||||
| (1) | (2) | (3) | (4) | (5) | (6) | (7) | (8) | (9) | (10) | (11) | (12) | (13) | (14) | (15) | (16) |
| 3C 457 | G239 | 13.89 | 10.83 | 64 | 4.22 | 10757 | NE | 1350 | 4772 | SW | 1551 | 5976 | |||
| G334 | 11.29 | 9.32 | 24 | 3.02 | 8358 | NE | 943 | 3740 | C | 12 | SW | 1036 | 4612 | ||
| G605 | 5.60 | 4.57 | 45.5 | 0.61 | 4442 | NE | 285 | 1953 | C | 7.2 | 7.2 | SW | 266 | 2451 | |
| V1477 | 4.82 | 4.17 | 273 | 0.08 | 1610 | NE | 115 | 696 | Cg | 5.9 | 6.4 | SW | 107 | 909 | |
| V4710 | 4.91 | 4.56 | 56 | 0.04 | 585 | NE | 41 | 246 | Cg | 3.2 | 3.3 | SW | 44 | 336 | |
g Flux density has been determined from the two dimensional Gaussian fit.
Flux density has been determined by re-mapping with lower uv-cutoff to remove the contamination due to diffuse emission.
| Model | Parameter | Model I | Model II |
|---|---|---|---|
| component | |||
| (1) | (2) | (3) | (4) |
| Soft power law | 2.18 | ||
| 1 keV flux density | 4.82 | ||
| (nJy) | |||
| Soft mekal | kT (keV) | 2.11 | |
| Unabsorbed flux | (2.56) | ||
| (erg/s/cm2) | |||
| Hard power law | Nuclear (cm-2) | (30.0) | (26.0) |
| 1.58 | 1.45 | ||
| Unabsorbed flux | (9.72) | (9.31) | |
| (erg/s/cm2) | |||
| 0.69 | 0.72 |
Note: The observed part of the spectrum has been integrated to find the flux.
| Source | Model | Parameter | Best-fitting values |
| Component | |||
| (1) | (2) | (3) | (4) |
| SW lobe | Power law | 1.63 | |
| 1 keV flux density | 3.91 | ||
| (nJy) | |||
| 0.85 | |||
| mekal | kT (keV) | 8.29 | |
| Unabsorbed flux | (3.60) | ||
| (erg/s/cm2) | |||
| 0.95 | |||
| Environment | mekal | kT (keV) | 2.62 |
| Unabsorbed flux | (5.98) | ||
| (erg/s/cm2) | |||
| 1.29 |
Note: The observed part of the spectrum has been integrated to find the flux.
5 Discussion and results
5.1 X-ray emission from different components
5.1.1 Core emission
The radio core of 3C 457 is a flat spectrum core as is evident from Figure 3. The X-ray spectral analysis of 3C 457 reveals that the core spectrum is well fitted with two two-component models. If we adopt Model I, then the soft power law component of the core spectrum originates from the base of the jets of the radio galaxy 3C 457, which is consistent with the results of Croston et al. (2004). The 5-GHz core flux of this source from our measurement is 3.300.16 mJy (a 5 per cent error in flux for VLA data is assumed) and the 1-keV X-ray flux obtained from the fit to Model I corresponds to 4.820.42 nJy. So it is consistent with the radio and X-ray flux correlation of the cores of radio galaxies, as found by (e.g.) Hardcastle & Worrall (1999). If we adopt Model II, then the best-fitting temperature (2.11 keV) of the soft thermal component is similar to that of the hot gas environment of 3C 457. Its bolometric luminosity (0.1100 keV) is 2.04 1043 erg s-1. This mekal temperature and the bolometric luminosity is consistent with the – correlation for the cluster atmosphere (Osmond & Ponman 2004). However, the bolometric luminosity is not well constrained and also this luminosity is only from a fraction of the environment around the core.
In Model I the soft power law is well constrained and consistent with earlier studies (e.g. Croston et al. 2004); whereas, in Model II the soft mekal model is not well constrained. Therefore, we favour Model I for the core spectrum, which is consistent with the results found for the nuclear spectra of 3C 223 and 3C 284 (Croston et al. 2004 and references therein). There is no evidence of a redshifted 6.4 keV iron line in our core spectrum.

5.1.2 Lobe emission
We fitted single power law (wabs(pow) in xspec) and mekal models (wabs(mekal) in xspec) to the X-ray spectrum of the SW lobe. Both the fits are equally good, with equal to 0.85 and 0.95 for the power law and mekal model respectively. But the mekal model temperature is too high and very poorly constrained. One plausible reason for such a high temperature, as pointed out by Croston et al. (2004), is due to supersonic expansion of the lobes which shock-heats their immediate environment. However, the single power law model yields a better constrained photon index (1.63). If we assume that the X-rays from the lobes are due to IC-CMB (as it is a power law), then this photon index is consistent with 0.82, as constrained from the radio measurements (Jamrozy et al. 2008). Moreover, the morphology is consistent with IC-CMB model, i.e., in the lobes of X-ray image, there is no edge brightened structure, which might be expected for shock heating by the supersonically expanding lobes. So we adopt the power-law interpretation of the spectrum, although we discuss the thermal model for the X-ray emission from the lobes in Section 5.2. We have constrained the magnetic fields of the lobes, using the synch code (Hardcastle, Birkinshaw & Worrall 1998; Hardcastle et al. 2004), from IC-CMB modelling without the assumption of equipartition/minimum-energy. The X-ray emission due to the IC-CMB process in the 0.1–10 keV range is due to scattering by electrons of Lorentz factor () around 1000. For the typical magnetic fields of radio lobes, those electrons radiate at a low radio frequency, i.e. a few tens to a few hundreds of MHz. Therefore, for our IC-CMB modelling we need to either assume a fiducial value for the low-frequency spectral index (the injection spectral index ()) of each lobe or to constrain it. We have taken =0.82 for both the lobes, as constrained by Jamrozy et al. (2008). The magnetic fields are 0.68 and 0.40 nT for the NE and SW lobes respectively. The corresponding minimum energy fields are 0.86 and 0.82 nT, which are within a factor of two only, in good agreement with the results of Croston et al. (2005) for a large sample of radio galaxies. Minimum energy fields are calculated with the assumptions that the filling factor of lobes are unity, the energetically dominant particles are the radiating particles only (the contribution of protons has been neglected) and the electron energy spectra extend from 10 to 105.

Spectral ageing analysis, using the revised equipartition magnetic field (see Beck & Krause 2005), done by Jamrozy et al. (2008) has revealed a prominent curvature in the spectral age vs. distance plot. Whereas, the same plot with the classical minimum energy field does not show such prominant curvature (see both Figure 9 of Jamrozy et al. 2008 and Figure 7 of this paper). The revised equipartition magnetic field ((rev)) is obtained from the formalism of Beck & Krause (2005). Their formula (equation A18) has the parameter K0 which is the ratio of the number density of protons to that of electrons in the energy range where losses are small. It is relevant to note that in this formalism particle energy is dominated by the protons. Estimating K0 from the equation K0= as given by their equation (7) (where is the proton mass, is the electron mass and which depends on the low-frequency spectral index in the observed synchrotron spectrum), we can constrain the proton spectrum and hence estimate the revised equipartition magnetic field strength, (rev). They have used the equipartition magnetic field using both the classical and revised formalisms (see Konar et al. 2008) for each strip to estimate the spectral age. It is worth mentioning that in the usual classical equipartition formalism (as used by Jamrozy et al. 2008) the electrons and protons have same total kinetic energy, which is a mere assumption and has no observational evidence. However, in this paper we have calculated our classical equipartition magnetic field for the source 3C 457 with the assumption that the energetically dominant particles in the lobes are the radiating particles only (Croston et al. 2005). We have estimated the spectral age of each strip of the lobes, using our magnetic field derived from IC-CMB modeling of the lobe X-ray emission (described in the beginning of this section), and compared with the values obtained from Jamrozy et al. (2008) for the classical equipartition field. We plotted the spectral ages estimated by us as well as Jamrozy et al. (2008) with the distance of the strip from the core. Unlike Jamrozy et al. (2008), we have used the constant field for all the strips, because IC-CMB modelling is not possible for each strip separately. Our estimates of ages for all the strips with constant magnetic field determined from IC-CMB modelling are close to the values obtained by Jamrozy et al. (see Figure 7). In fact for the SW lobe our points lie exactly on top of theirs. This shows that the classical equipartition magnetic field yields reasonably accurate spectral age, provided the break frequency determination is accurate.
All the calculations regarding magnetic field and pressure have been done with the assumption that the lobes are in the plane of the sky, as 3C 457 is not a quasar. However, assuming that the source is at 45∘ with the LOS, our calculations yield very similar numbers. The minimum energy fields change by less than 10 per cent from the values quoted above, and the fields constrained from the IC-CMB modelling changes by much less than a few per cent and hence much less than the error bars quoted above. Our estimatation of spectral age also yields very similar results. Hence all our results about magnetic fields and spectral ages are similar even if 3C 457 is inclined at an angle of 45∘ to the LOS.


5.1.3 Emission from the environment
We have made an unambiguous detection of a poor-cluster scale hot gaseous environment around the core of the radio galaxy 3C 457 over a circular region of radius 800 kpc. The environment is consistent with an isothermal gas. The spectrum is a good fit to the mekal model. The best-fitting temperature is 2.62 keV and so is reasonably well constrained. The unabsorbed bolometric luminosity (within the 0.1-100 keV energy band) of the environment, excluding the regions of lobes and a circular region of radius 40 arcsec around the core, is (4.65)1043 erg s-1. This needs to be corrected by a factor taking the excluded regions into account. We determined the radial surface brightness profile for the environment around the radio source. The radial surface brightness in units of counts arcsec-2 was extracted from concentric annuli with point sources, chip gaps and lobes masked out. We fitted a model consisting of a point source situated at the position of the core of 3C 457 and a single model. The Bayesian estimates of and core radius () are and . Errors are the 1- credible interval. The detailed analysis of the spatially extended emission around the core of 3C 457 and the -model fitting procedure were carried out in the same way as described in Croston et al. (2008).
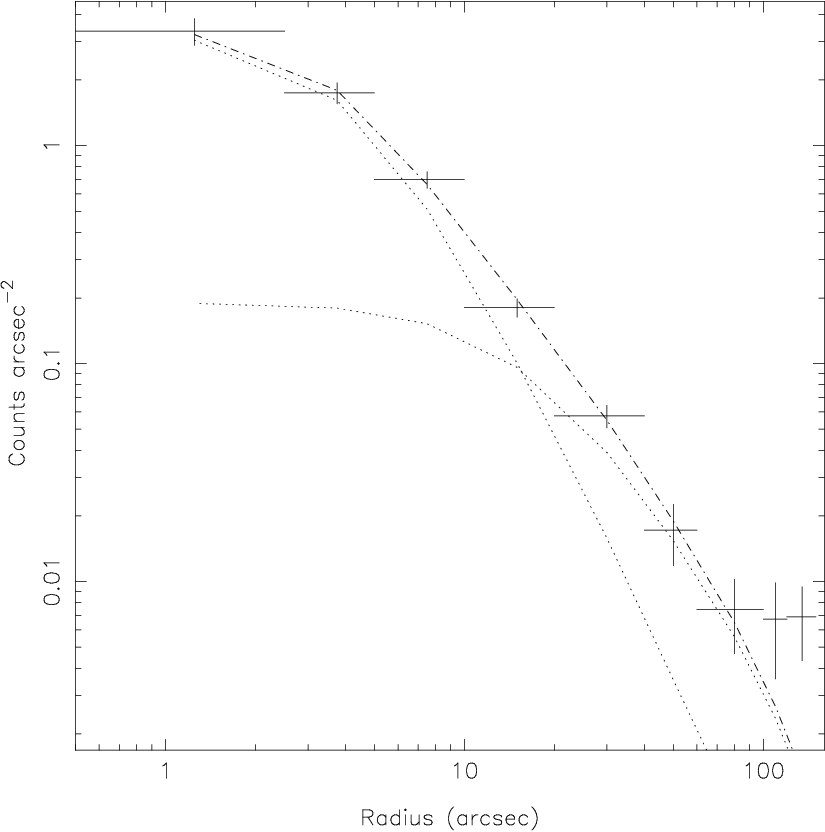
By extrapolating the model back to the core of 3C 457, and taking into account the masking of the lobe and core regions we have estimated and applied the correction factor to the bolometric X-ray luminosity of the environment given above. The corrected bolometric luminosity is 1.511044 erg s-1. The environment of 3C 457 seems to follow the luminosity temperature correlation (hereafter - correlation, Osmond & Ponman 2004). Their best-fitting relationship between and is
| (1) |
The temperature of the system predicted from Equation 1 is 3.42 keV. Our best fit temperature of this cluster scale environment is 2.62 keV which is similar to what is predicted from the - correlation. Given the error bars of the temperatures we cannot say whether the expansion of lobes has any large-scale heating effect due to work on the environment. Moreover, it should be noted that the best-fiting value of our measured temperature of the environment is lower than the mean value of what is predicted from the - correlation, i.e., Equation 1. Therefore, it is unlikely that there is any significant global heating effect on the environment due to work by the lobes. The number of counts are not sufficient to check whether there are any temperature variations in the atmosphere.
5.2 Pressure balance between radio lobes and environments
Radio lobes are thought to be filled with mostly relativistic plasma, and are generally found to be close to the equipartition condition, if we assume that the lobes contain mostly radiating particles (Croston et al. 2005; Kataoka & Stawarz 2005). Using the synch code (Hardcastle et al. 1998, 2004), we have determined the pressure of the entire lobe through IC-CMB modelling. For the internal pressure calculation, we have assumed that the filling factor of the lobes is unity, the energetically dominant particles are the radiating particles only (the contribution of protons has been neglected) and the radio spectra extend from 10 to 105 with =0.82 as constrained by Jamrozy et al. (2008). The pressures are and Pa for the NE and SW lobe respectively. As the lobes contain mostly ultra-relativistic plasma, the sound speed will be very high (). As a result we can assume that the entire lobe has the same pressure. We have determined the pressure of the environment as a function of radius from the core of 3C 457 from the emission measure and -model fit parameters. The pressure vs. radius plot is shown in Figure 11. The line connecting two triangles show the pressure along the entire SW lobe detected in low frequency GMRT maps. The line joining two squares show the same for the NE lobe. From the figure it is clear that the lobes are approximately at pressure balance with the environments near the hotspots. At the lobe-head the ratios of internal to external pressures are 0.84 and 1.31 for the NE and SW lobes respectively. At the mid points of the lobes, the ratio of external to internal pressures are 2.51 and 1.64 for the NE and SW lobes respectively. Given the error bars, the mid points of both the lobes are clearly under-pressured, although the mid point of the SW lobe might be close to pressure balance with the environment.
The presence of the hotspots says that the lobes are still expanding very fast in the longitudinal direction. There is likely to be ram pressure balance at the lobe-heads. We can calculate the head velocity of the lobes from ram pressure balance. The ram pressure balance equation is
| (2) |
where is the particle density of the environment, is the mean molecular mass of particles in the environment, is the proton mass, is the jet head velocity, is the jet power and can be expressed as with =spectral age, is the jet bulk speed which is usually assumed to be close to the speed of light and is the hotspot area over which the jet is impinging the environment. Putting cm s-1, 1.4 and expressing all other quantities in the practical units, the working formula for in units of c () is given by
| (3) |
Using the spectral ages (21.9 and 32.6 Myr for the NE and SW lobes) of the lobes from Table 9 of Jamrozy et al. (2008), assuming the hotspot diameter to be 10 kpc (Jeyakumar & Saikia 2000) and measuring and from our radio and X-ray observations, we obtain the jet-head (or lobe-head) velocities () to be 0.0084c and 0.0073c for the NE and SW lobes respectively. The average separation velocities () between the lobe-head and the back-flowing plasma estimated from the spectral ageing analysis are 0.07c and 0.04c for the NE and SW lobes respectively (Jamrozy et al. 2008). Since in general there will be a back-flow velocity () of the relativistic plasma, we can write
| (4) |
Using Equation 4, the values of come out to be 0.062c and 0.033c for the NE and SW lobes respectively, which are much higher than the lobe-head velocities. Since is estimated from the ram pressure balance at the jet head, it can be interpreted as the present lobe-head velocity. Just to compare with the velocity of sound () of the external medium we have calculated the sound velocity at temperature 2.62 keV, finding that 0.002c. So, the present lobe-head velocities for both the lobes are supersonic. It should be borne in mind that there is an ambiguity about the value of . Therefore, it is worth trying to get two limiting values of the diameters corresponding to two limiting values of . If it is the primary hotspot area that is relevant, then our measurement on the bright hotspot of SW lobe in the high resolution image of Gilbert et al. (2004) yields a major axis of 2.7 kpc. Since the image is convolved with a beam size of 0.25 arcsec (1.39 kpc), the deconvolved major axis (which we assume to be the diameter) is 2 kpc, which is a good estimate of the diameter corresponding to the lower limit of . For the lower limit of , the values of are 0.042c and 0.036c for the NE and SW lobes respectively. In this case, the back-flow velocity of the relativistic plasma will be 0.028c for NE lobe and 0.004c for the SW lobe. However, the upper limit of the quantity is not so clear. If the jet moves about at the end of the lobe on a short timescale, then it might be appropriate to use the cross-sectional area of the entire front part of the lobe for . From the high resolution map of Gilbert et al. (2004), our estimation of the entire cross-sectional area encompassing the region of primary hotspot and two secondary hotspots in SW lobe yields a diameter of 25 kpc. If this value corresponds to the diameter of the upper limit of , then the values of are 0.003c for both the lobes, which are very close to the sound speed (0.002c) of the 2.62 keV gaseous environment. In this case, the back-flow velocity of the relativistic plasma has to be very high compared to the lobe-head velocity.
For our calculations in this section, we have assumed that the lobes are in the plane of the sky, i.e., at 90∘ to the LOS. However, the lobes can be inclined at any angle between 4590∘ with the LOS, as 3C 457 is a radio galaxy rather than a quasar. It is therefore important to discuss the effect on our calculation if the lobes are inclined at an angle of 45∘ with the LOS. The values of the lobe pressure are 0.17110-12 and 0.27410-12 Pa for the NE and SW lobes respectively. The error bars of the internal pressures in this case are quite similar to the ones obtained with the assumption that the lobes are in the plane of the sky. These values are lower by about 24 per cent and 28 per cent respectively than the values obtained with the assumption that the lobes are in the plane of the sky. If the lobes are at 45∘ with the LOS, then the ratios of the internal to external pressures at the lobe-head are 1.04 and 1.50 for the NE and SW lobes respectively. So the lobe heads are still approximately at pressure balance. The ratios of external to internal pressures at the mid points of the NE and SW lobe are 2.10 and 1.42 respectively. So, if the lobes are inclined at an angle of 45 degree with the LOS, the mid point of NE lobe is still clearly over-pressured. However, the mid point of SW lobe is close to pressure balance. In the case of the lobes inclined at 45∘ with the LOS, the lobe-head velocities (from Equation 3) are 0.0088c and 0.0074c in the NE and SW lobes respectively for 10 kpc, which are very close to the values obtained with the assumption that the lobes are in the plane of the sky. The values of are also not significantly altered for the two limiting values of , compared to the values obtained for the lobes in the plane of ths sky.
Therefore, the qualitative results on the lobe-head velocity and pressure balance between the lobes and the environment are all more or less similar irrespective of whether the lobes are in the plane of the sky or inclined at an angle of 45∘ with LOS.
We now discuss the lateral expansion of the lobes. The under-pressured parts of the lobes indicate that the lateral expansion has been subsonic and might have reached a stage when it is under-pressured. These results are all consistent with the results of Croston et al. (2004) who have studied two large radio galaxies of similar kind. This implies that the IC-CMB model for the X-ray emission from the lobes of 3C 457 appears to be self-consistent (see also Croston et al. 2004, 2005). Had we found an internal pressure much higher than the external pressure of the lobes in the IC-CMB model with the assumptions adopted for our calculation, we would have expected at least some contribution to the lobe X-ray emission from shocked thermal emission. We know from spectral ageing analysis, GRSs (or large radio galaxies) are older (Jamrozy et al. 2008) and likely to represent the late stages of evolution of radio galaxies. Therefore, the results on 3C 223 and 3C 284 from Croston et al. (2004), and on 3C 457 from the present paper, suggest that we do not see any evidence of over-pressured lobes at the late stages of evolution of radio galaxies. In other words, the results on all three radio galaxies suggest that GRSs (or large radio galaxies) are likely to be at the late stages of evolution as they are no longer significantly over-pressured. We would expect over-pressured lobes to be generally found in smaller radio galaxies, as required for dynamical models of radio galaxies.
It should be borne in mind that, in carrying out the pressure balance calculation in the IC-CMB model, we assumed no contribution of protons in the lobes. With this assumption, the lobe heads are approximately at pressure balance and the mid-points of the lobes are under-pressured by a factor of 1.4 to 2.5 depending upon whether the lobes are in the plane of the sky or inclined at an angle of 45∘ with LOS. It is interesting to note that if the energy density in protons were comparable to that of electrons the lobes would still be under-pressured towards the core and would be in rough pressure balance at the mid points of the lobes. So a modest contribution from protons and other non-radiating particles would somewhat alter our conclusion about pressure balance. For the supersonic lateral expansion of the lobes, either they have to be magnetically dominated or dominated by non radiating particles. A more detailed discussion on supersonic lateral expansion is found in Section 4.5 of Croston et al. (2004). There is no strong evidence in the literature for assuming an appreciable amount of non-radiating particles inside the lobes which can cause supersonic lateral expansion. In this regard, lobe-related depolarisation measurements of 3C 457 would be important.
In Section 5.1.2, we described why we have favoured IC-CMB model. However, it is important to bear in mind that we were unable to draw a firm conclusion about the X-ray emission mechanism based on the spectral fits alone. The pressure balance arguments in this section are based on assuming the IC-CMB model, which is self-consistent. If we assume that the lobe-related X-ray emission is thermal then we have no direct information about the internal pressure; however, we will have an upper limit on the pressure due to the electrons only. For supersonic expansion of lobes (as is required for the thermal interpretation of the lobe-related X-ray emission), we would require or , where is proton energy, is the energy of radiating particles and is the magnetic field energy.

5.3 Choice of a different value of Galactic hydrogen column density
As has been described in Section 4.2, our data suggest a range of values of (0.151022 cm-2 0.2251022 cm-2 ). Any value below 0.151022 cm-2 worsens the quality and feasibility of the fit to all the spectra, and there is no strong evidence for any significantly higher value than 0.2251022 cm-2 . The results discussed above assume 0.2251022 cm-2. We will now discuss how our results are affected if we assume cm-2 (hereafter referred to as the ‘lower value of ’) instead of cm-2 (hereafter referred to as the ‘higher value of ). We have provided the best fit values of all the parameters of all the spectra for 0.151022 cm-2 in Tables 5 and 6.
For the X-ray spectrum of the core of 3C 457, in Model I, the 1 keV X-ray flux density of the soft power law is 3.84 nJy for the lower value of . This is a little lower than obtained for the higher value of ; however, 3.84 nJy is still consistent with the X-ray and radio flux density correlation as found by Hardcastle & Worrall (1999). In Model II if we use the lower value of , the soft mekal component has a best-fitting temperature of 3.99 keV, a little higher than that obtained for the higher value of , whereas, the soft mekal flux density has similar value and is not well constrained on the upper side for the lower value of , as is the case for the higher value. The best-fitting values of all the other fit parameters for both Model I and II of the core X-ray spectrum are similar within the errors. The fit quality is equally good for both values of .
For the X-ray spectrum of the SW lobe, if we consider a power law then both the parameters (photon index and 1 keV flux density) have similar best-fitting values within the errors. If we consider the mekal model fit to the SW lobe, then the best-fitting temperature is even higher and not well constrained both above and below; however, the unabsorbed flux of the mekal model is similar within the errors. So our qualitative results and reasons for favouring the power-law model, not the mekal model, still hold. With the lower value of the magnetic fields are 0.77 and 0.45 nT for the NE and SW lobes respectively. The corresponding total pressures are 0.20910-12 and 0.31710-12 Pa. The error bars shown for magnetic fields and pressures are similar to those estimated for the higher value of . Ultimately, our results that the lobe-heads are close to pressure balance and the mid points of the lobes are under-pressured are still valid.
For the environments around 3C 457, again the fits are quite similar within the errors for the lower value. The best-fitting value of the mekal temperature is 3.42 keV. The bolometric luminosity (0.1100 kev), corrected for the masked regions around the lobes and core, is 1.38 1044 erg s-1. At this environmental luminosity, the LXTX correlation (Equation 1) of the clusters predicts a temperature of 3.32 keV. Given the error bars, we cannot definitely say that there is any heating effect due to the work done by the lobes on to the environment.
In conclusions, all our results are qualitatively similar for either value.
| Model | Parameter | Model I | Model II |
|---|---|---|---|
| component | |||
| (1) | (2) | (3) | (4) |
| Soft power law | 1.81 | ||
| 1 keV flux density | 3.84 | ||
| (nJy) | |||
| Soft mekal | kT (keV) | 3.99 | |
| Unabsorbed flux | (2.75) | ||
| (erg/s/cm2) | |||
| Hard power law | Nuclear (cm-2) | (29.7) | (29.0) |
| 1.53 | 1.50 | ||
| Unabsorbed flux | (9.95) | (9.84) | |
| (erg/s/cm2) | |||
| 0.66 | 0.67 |
Note: The observed part of the spectrum has been integrated to find the flux.
| Source | Model | Parameter | Best fit values |
| Component | |||
| (1) | (2) | (3) | (4) |
| SW lobe | Power law | 1.41 | |
| 1 keV flux density | 3.17 | ||
| (nJy) | |||
| 0.80 | |||
| mekal | kT (keV) | 18.58 | |
| Unabsorbed flux | (3.33) | ||
| (erg/s/cm2) | |||
| 0.83 | |||
| Environment | mekal | kT (keV) | 3.42 |
| Unabsorbed flux | (6.00) | ||
| (erg/s/cm2) | |||
| 1.20 |
Note: The observed part of the spectrum has been integrated to find the flux.
6 Concluding remarks
We have presented multi-frequency radio observations with the GMRT and VLA and X-ray observations with XMM-Newton of a giant radio galaxy, 3C 457. At radio wavelengths we have detected the core and lobes, while at X-ray wavelengths we have detected the core, lobes and thermal gaseous environment around the source. Our multi-frequency radio observations have allowed us to constrain the radio spectra of the components within the observed frequency range, and we found that the spectra of all components as well as the integrated spectrum are consistent with a power law. The X-ray spectrum of the core is well fitted by a composite spectrum consisting of a hard heavily absorbed power law and a soft unabsorbed power law. The hard absorbed power law is a characteristic of an AGN with the absorption due to the torus. The soft unabsorbed power law is assumed to originate from the jet base. It is difficult to know the origin of this emission: it could be due to synchrotron, inverse-Compton, or a mixture of both, which cannot be disentangled with our data.
We have shown that an IC-CMB model for the X-ray emission from the lobes is self-consistent. For both the lobes, the magnetic field determined from IC-CMB modelling is within a factor of two of the minimum energy value. We find that both the lobes are close to pressure balance near the hotspots but under-pressured towards the core, if we neglect the contribution from any sort of non-radiating particles inside the lobes. If the energy density in protons were comparable to that of electrons the lobes would still be under-pressured towards the core and would be in rough pressure balance at the mid points of the lobes. So a modest contribution from protons and other non-radiating particles would alter our conclusion about pressure balance. If the lobes have supersonic lateral expansion, then either they have to be magnetically dominated or dominated by non radiating particles. There is no strong evidence in the literature for assuming an appreciable amount of non-radiating particles inside the lobes. A model in which there is no supersonic lateral expansion is consistent with our interpretation of the X-ray emission as originating in IC-CMB emission, rather than shocked hot gas surrounding the lobes.
A poor cluster scale environment around the source has been detected unambiguously, with a best-fitting temperature of 2.62keV. The environment is consistent with an isothermal gas with a model profile (e.g. Birkinshaw & Worrall 1993). The environment of 3C 457 follows the - correlation for clusters, which means that we can identify no significant global heating effect due to work on to the environment. The number of counts is insufficient to check whether there are any temperature variations in the atmosphere.
The results we present here for 3C 457, together with the results on 3C 223 and 3C 284 from Croston et al. (2004), suggest that there is no strong evidence for over-pressured lobes in large radio galaxies or GRSs, i.e. that GRSs (or large radio galaxies) are likely to be in the late stages of evolution as they are no longer significantly over-pressured.
Acknowledgments
This work is partly based on observations obtained with XMM-Newton, an ESA science mission with instruments and contributions directly funded by ESA Member States and the USA (NASA). The Giant Metrewave Radio Telescope is a national facility operated by the National Centre for Radio Astrophysics of the Tata Institute of Fundamental Research. The National Radio Astronomy Observatory is a facility of the National Science Foundation operated under co-operative agreement by Associated Universities Inc. This research has made use of the NASA/IPAC extragalactic database (NED) which is operated by the Jet Propulsion Laboratory, Caltech, under contract with the National Aeronautics and Space Administration. We thank numerous contributors to the GNU/Linux group. CK acknowledges travel support and local hospitality provided, during May 2008, by the University of Hertfordshire, Hatfield, UK, where this research was partly done. CK acknowledges Ranjeev Misra and Gulab C. Dewangan from IUCAA for useful discussions regarding data analysis and interpretations. MJH thanks the Royal Society for generous funding through the Research Fellowships scheme.
References
- [] Baars J.W.M., Genzel R., Pauliny-Toth I.I.K., Witzel A. 1977, A&A, 61, 99
- [] Beck R., Krause M., 2005, AN, 326, 414
- [] Belsole E., Worrall D.M., Hardcastle M.J., Birkinshaw M., Lawrence C.R., 2004, MNRAS 352, 924
- [] Belsole E., Worrall D.M., Hardcastle M.J., Croston J.H., 2007, MNRAS, 381, 1109
- [] Birkinshaw M., Worrall D.M., 1993, ApJ, 412, 568
- [] Croston J.H., Hardcastle M.J., Birkinshaw M., Worrall D.M., 2003, MNRAS, 346, 1041
- [] Croston J.H., Birkinshaw M., Hardcastle M.J., Worrall D.M., 2004, MNRAS, 353, 879
- [] Croston J.H., Hardcastle M.J., Harris D.E., Belsole E., Birkinshaw M., Worrall D.M., 2005, ApJ, 626, 733
- [] Croston J.H., Hardcastle M.J., Birkinshaw M., Worrall D.M., Laing R.A., 2008, MNRAS, 386, 1709
- [] Dickey J.M., Lockman F.J., 1990, ARA&A, 28, 215
- [] Falle S.A.E.G.,1991, MNRAS, 250, 581
- [] Fanaroff B.L., Riley J.M., 1974, MNRAS, 167, 31P
- [] Gilbert G.M, Riley J.M, Hardcastle M.J., Croston J.H., Pooley G.G., Alexander P., 2004, MNRAS, 351, 845
- [] Hardcastle M.J., Birkinshaw M., Worrall D.M., 1998, MNRAS, 294, 615
- [] Hardcastle M.J., Worrall D.M., 1999, MNRAS, 309, 969
- [] Hardcastle M.J., Worrall D.M., 2000, MNRAS, 319, 562
- [] Hardcastle M.J., Birkinshaw M., Cameron R.A., Harris D.E., Looney L.W., Worrall D.M., 2002, ApJ 581, 948
- [] Hardcastle M.J., Harris D.E., Worrall D.M., Birkinshaw M., 2004, ApJ, 612, 729
- [] Hardcastle M.J., Evans D.A., Croston J.H., 2006, MNRAS, 370, 1893
- [] Jamrozy M., Konar C., Machalski J., Saikia D.J., 2008, MNRAS, 385, 1286
- [] Jeyakumar S., Saikia D.J., 2000, MNRAS, 311, 397
- [] Kaiser C.R., Alexander P., 1997, MNRAS, 292, 723
- [] Kaiser C.R., Dennett-Thorpe J., Alexander P., 1997, MNRAS, 292, 723
- [] Kataoka J., Stawarz Ł., 2005, ApJ, 622, 797
- [] Konar C., Jamrozy M., Saikia D.J., Machalski J., 2008, MNRAS, 383, 525
- [] Miller N.A., Owen F.N., Burns J.O., Ledlow M.J., Voges W., 1999, AJ, 118, 1988
- [] Osmond J.P.F., Ponman T.J., 2004, MNRAS, 350, 1511
- [] Perryman M.A.C., Lilly S.J., Longair M.S., Downes A.J.B., 1984, MNRAS, 209, 159
- [] Safouris V., Subrahmanyan R., Bicknell G.V., Saripalli L., 2009, MNRAS, 393, 2
- [] Schlegel D.J., Finkbeiner D.P., Davis M., 1998, ApJ, 500, 525
- [] Spergel D.N. et al., 2003, ApJS, 148, 175
- [] Spitzer L. Jr., 1978, Physical Processes in the Interstellar Medium, John Wiley and Sons, New York
- [] Worrall D.M., Birkinshaw M., 2000, ApJ, 530, 719