Water permeation through stratum corneum lipid bilayers from atomistic simulations
Abstract
Stratum corneum, the outermost layer of skin, consists of keratin filled rigid non-viable corneocyte cells surrounded by multilayers of lipids. The lipid layer is responsible for the barrier properties of the skin. We calculate the excess chemical potential and diffusivity of water as a function of depth in lipid bilayers with compositions representative of the stratum corneum using atomistic molecular dynamics simulations. The maximum in the excess free energy of water inside the lipid bilayers is found to be twice that of water in phospholipid bilayers at the same temperature. Permeability, which decreases exponentially with the free energy barrier, is reduced by several orders of magnitude as compared to with phospholipid bilayers. The average time it takes for a water molecule to cross the bilayer is calculated by solving the Smoluchowski equation in presence of the free energy barrier. For a bilayer composed of a 2:2:1 molar ratio of ceramide NS 24:0, cholesterol and free fatty acid 24:0 at , we estimate the permeability and the average crossing time . The permeability is about 30 times smaller than existing experimental results on mammalian skin sections.
pacs
82.70.Uv, 87.10.Tf, 87.15.VvI Introduction
The thick stratum corneum (SC), the outermost layer of the skin [1], comprises rigid keratin filled pancake shaped non-viable cells (corneocytes) in an extra-cellular lipid matrix. This SC lipid matrix is believed to be the main barrier against water loss, with permeability values three to five orders of magnitude smaller compared to phospholipid bilayers forming plasma membranes [2]. This high permeation barrier is vital for life to maintain the required ionic concentration inside the body for proper biochemical reactions. At the same time, controlled modulation of the barrier properties has the potential for non-invasive drug delivery [3] and restoration of the barrier function in compromised skin [4].
The SC lipid matrix is conspicuous in having a large fraction of lipids from the ceramide (CER) family with long and asymmetric acyl tails. The other major components of the lipid matrix are cholesterol (CHOL) and free fatty acid (FFA) [5, 6]. The bricks and mortar model [7], one of the widely accepted models for the SC arrangement, pictures corneocytes as essentially impermeable bricks joined by the thin lipid matrix forming the mortar phase. One of the explanations put forward for the extremely low permeability of the SC is that the permeating molecules traverse a tortuous route through the lipid matrix. In this picture, the special chemical structure of the lipids plays no important role for the passive permeation. An apparent experimental justification for this picture is a very large lag time between introducing a radioactive molecule at one side of the SC and detecting it on the other side. With a simple diffusion model, even for water, one needs to invoke a path length two orders of magnitude larger than the physical thickness of the SC layer considered [8]. This picture assumes that water does not penetrate the corneocytes. However, the corneocytes contain small hygroscopic molecules such as amino acids [9] (collectively referred to as natural moisturizing factor or NMF [10, 11] ). For fully hydrated SC, water diffusivity in the corneocyte is estimated to be within a factor 2-3 of the diffusivity in bulk water [12, 13]. So, it is a bit contradictory to consider them as acting as an impenetrable barrier against water transport.
In this work, we limit our studies to simulations of hydrated lipid bilayers alone but include the minimal chemical details appropriate for the SC lipid matrix, and perform a series of molecular dynamics simulations to probe the permeability of the fully hydrated bilayers. Ceramide sphingolipids contain a fatty acid tail attached to a sphingosine motif. The fatty acid tail is highly polydisperse in length [14]. Also, there are at least 9 different classes of ceramides in human stratum corneum, with slight variations of the head groups, and, in case of ceramide 1, an additional esterified long fatty acid attached to the longer hydrocarbon tail. Free fatty acids also have a large polydispersity in vivo [15]. For simplicity, we only consider ceramide NS 24:0 (ceramide 2), with its fatty acid tail containing 24 carbons. Similarly, the only free fatty acid we consider contains 24 carbon atoms. This particular length was chosen to represent the majority fraction of ceramide and free fatty acid present in the human stratum corneum [14, 15].
CER with their long asymmetric tails control the main distinguishing features of SC lipid membranes compared to phospholipids [16]. The absence of any large head group leads to close packing of hydrocarbon tails. We have performed simulations of pure CER bilayers, along with more realistic bilayers with CER, CHOL and FFA present in either 1:1:1 or 2:2:1 molar ratios. Simulation studies of water permeation for phospholipid bilayers, using very similar force-field as employed in this study, exist in literature at [17]. To compare and contrast between phospholipid bilayers and SC lipid bilayer, we also simulated at . For the 2:2:1 composition ratio, where comparisons are made with experimental results, we have done additional simulations at .
Our main findings are that the diffusion of water molecules inside the lipid bilayer is highly anisotropic, and the excess chemical potential for water is much higher than in typical fluid phospholipid bilayers at the same temperature. In the presence of the high free energy barrier, the simple absorption-diffusion picture, with which much of the experimental results are interpreted in the literature, is no longer valid. Instead, the time taken by a water molecule to cross the bilayer is determined by the Kramers’ first passage time across the bilayer. Our results suggest that for water, the experimentally determined lag time and thickness of the stratum corneum can be reconciled without invoking concepts like tortuosity when the free energy barrier is accounted for correctly.
II Computational details
To calculate the permeability coefficient from simulations, we constrain a water molecule at a fixed distance from the lipid bilayer mid-plane. Here, the direction is the direction normal to the bilayer with the bilayer center of mass being at . In this paper, we use the subscript to denote quantities in the plane of the bilayer. The average component of the force on the constrained molecule is related to the spatial derivative of free energy [17, 18]
| (1) |
Here, refer to averages both over time and different system replicas. The value of the local excess chemical potential can be calculated through numerical integration from the bulk water phase. The auto-correlation of the force is related to the diffusion coefficient through a Kubo relation [17]
| (2) |
where, is the universal gas constant, the absolute temperature and . The macroscopic permeability coefficient , the ratio between the flux and concentration difference (), is macroscopically defined through [17]
| (3) |
where the integration runs over the bilayer thickness. , with being the Boltzmann’s constant. The constraint on the water molecule is only along the direction, so the in-plane diffusivity in the plane is calculated from the mean square displacement as a function of time, .

To estimate , the average time it takes for a water molecule to cross a bilayer, we introduce a steady current at , at one side of the bilayer (Fig. 1). The number density of water molecules obeys the Smoluchowski equation [19],
| (4) |
We consider a hard reflecting wall at , where (in the bulk ). An absorbing wall is placed at the maximum of the potential . Once steady state is achieved, the total number of surviving molecules is
| (5) |
In the steady state (), integrating Eq. 4, for leads to
| (6) |
Using this expression in Eq. 5 gives
| (7) |
We compute by numerical integration of functional fits to and .
All simulations are done with extended ensemble molecular dynamics at constant temperature and pressure ensemble with GROMACS molecular dynamics package [20, 21, 22] with a timestep of 1fs. The interaction parameters are based on the united atom OPLS force field [23] with modifications for the nonpolar hydrocarbon groups [24] that accurately reproduce experimental results for lipid molecules [25]. Polar hydrogens were included explicitly. The dihedral potentials in the lipid tails were described by the Ryckaert-Bellemans term [26]. At skin conditions the SC lipids do not fully ionize, so, polar groups were assigned partial charges chosen from previous simulations of similar molecules [27, 28]. The SPC model [29] was used to describe the water molecules.
Nosé-Hoover thermostats [30, 31] coupled separately to the lipid and water molecules with a time constant of were used to control the temperature. The Parrinello-Rahman barostat [32, 33] with time constant was used for pressure coupling. The diagonal components of the compressibility matrix were chosen to be . The off-diagonal components were set to zero to keep the simulation box orthogonal and standard periodic boundary conditions were applied in all three directions. Electrostatic interactions were calculated with a group-based cut-off. The cut-offs for both the Van der Waals and electrostatic interactions were set to . With the small dipole moments involved in these simulations, the electrostatic interaction becomes negligible at sufficiently small distance so that the results remain independent of using either a group-based cut-off, or Ewald summation to take account of interactions with the periodic images [16]. All lipid bonds were constrained with the SHAKE algorithm [34]. Rigid SPC water molecules were updated with the analytic SETTLE algorithm [35].
From the final equilibrated configurations from a previous study [16], we selected a random water molecule approximately above the bilayer midplane. The water molecule was pulled along the negative direction at a rate of by moving the water molecule every (discrete) fs time step. Each time the relative separation between the water molecule and the bilayer center of mass changed by , the configuration was equilibrated for with the separation between the water molecule and the bilayer midplane kept fixed. The configurations at these steps were stored at full precision for further calculations.
We evolved each of these saved configurations, with the selected water molecule constrained to be at fixed separation from the bilayer midplane for . At each time step, the force along the z-direction on the constrained water molecule and the in-plane displacement of the center of mass of the constrained water molecule were stored. Every we also store the indices of the atoms within a distance of to find out about the local environment of the constrained water molecule. The whole procedure was repeated with different random water molecules for each composition and temperature investigated.
To calculate from the autocorrelation of (Eq. 2), we first estimate the decay time of . Typical values of are . The upper time limit of the integration (eqn. 2) to calculate was chosen to be . We calculate the in-plane diffusivity from long time behavior ( ) of the mean-squared displacements with time origins chosen at intervals of for averaging.
Data from simulations with different water molecules were used together to calculate the average and error estimates for , and . Because the bilayers studied here are symmetric, is an even (odd) function of . Using the data from both leaflets we achieve a better estimate at a given . Numerical integration of from the bulk gives the excess free energy (Eq. 1). Finally, permeability is calculated by numerical integration across the bilayer (Eq. 3) using the calculated and .
III Permeability of ceramide bilayer
The asymmetric long chain ceramides are responsible for much of the distinguishing features of SC lipid structure as compared to other biologically relevant membranes. In this first part of this work we concentrate on a pure CER bilayer and contrast our findings with literature results on phospholipid bilayers.

Fig. 2 shows a snapshot of CER bilayer containing 128 CER molecules and 5250 water molecules with a water molecules constrained to be at a distance from the bilayer midplane along the direction. The long hydrocarbon tails lead to large nematic order in the bilayer. Once the water molecule is inside the lipid layer, it faces little resistance in moving along the direction, but the motion in the plane is severely restricted. Because the two tails have large asymmetry, the midplane region is mostly occupied by atoms from the longer tail of ceramide and there the nematic order is lower.
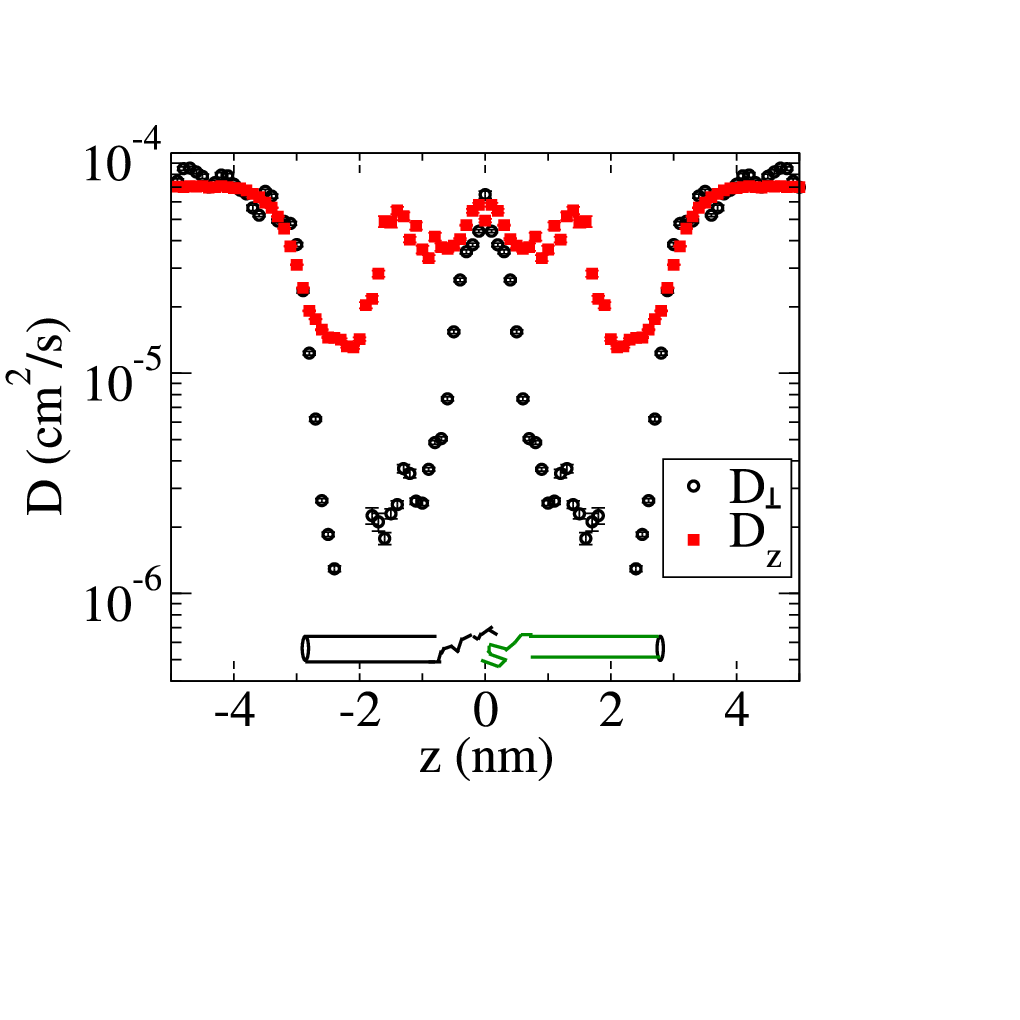
The diffusivity of water as a function of distance from the bilayer midplane is shown in Fig. 3. In the bulk water (), both methods lead to very similar value of the diffusivity. falls by nearly three orders of magnitude in the ordered tail region, while is reduced by slightly less than an order. This agrees with the interpretation of water molecule inside the ordered region of the bilayer being effectively constrained in channels defined by the hydrocarbon tails. Close to , the measured from the simulations fall below . There, the water remains confined in the same lipid neighborhood for the entire simulation and we can no longer calculate with certainty from the mean square displacement. Except for this narrow region (), the diffusivity is high enough for the water molecule to explore a large part of the system in the direction within the run time of a single simulation. The asymmetry between the two tails lead to a low density molten region at the bilayer midplane, where both and approach the bulk diffusivity and is isotropic. The decrease in the value of inside the bilayer is comparable to that found in DPPC bilayer simulations [17]. However, in DPPC, remains comparable to throughout the bilayer. At the midplane of DPPC bilayer, because of large free volume, the diffusivity was found to be almost twice that of bulk water. In ceramide, both and approach the bulk water value at the midplane, but remain less than it. The asymmetry in the two tail lengths allow the CER bilayer to have a much larger local density at the midplane region than the DPPC bilayer, because of partial interdigitation. This limits the diffusivity to a value lower than that in the bulk.

From the average force measured as a function of the depth, we numerically compute the excess chemical potential of a water molecule as a function of (Fig. 4). The chemical potential rises steeply on entering the lipid bilayer, reaching a maximum () at a distance of from the bilayer midplane. At the midplane itself, the excess chemical potential drops to a value of . The maximum in the excess chemical potential is about twice as high as that measured from DPPC bilayer simulation at the same temperature [17].
The permeability decreases exponentially with the excess chemical potential. Our estimate for the permeability for CER bilayer at 350K, , is approximately five orders of magnitude smaller than the DPPC bilayer permeability of [17] at the same temperature. This is mainly due to the much larger free energy barrier and partially due to reduced diffusivity compared to DPPC bilayer.
Using the excess free energy and diffusivity, numerical integration of Eq. 7 leads to the average crossing time for ceramide bilayer .
IV Model stratum corneum lipid bilayers


To provide some understanding for experiments with biological skin sections, we consider two ternary mixtures of CER, CHOL and FFA with 1:1:1 and 2:2:1 molar ratios. The 2:2:1 composition is considered to be representative of the in vivo composition [5]. For this composition, besides , we perform simulations at , close to the physiological temperature. In this section we concentrate on the 2:2:1 mixture and consider the results on the 1:1:1 mixture in Table 1.
CHOL reduces the local nematic order in the three component bilayers. Also, to fit the rather bulky CHOL molecule, the bilayer needs to create more free volume. This effect on the free volume is opposite to that in phospholipid, where cholesterol was found to reduce the available free volume in DPPC bilayer [36]. In the simulations with CER bilayers only the constrained water molecule enters the bilayer, while in the three component system another water molecule occasionally joins the constrained water molecule (Fig. 5). This reduces the energy due to favorable hydrogen bonds between the two water molecules. At the same time, especially close to the CHOL molecules, large enough free volume is available to accommodate the two water molecules.

Fig. 6 shows the water diffusivity as a function of for the 2:2:1 bilayer. At the bottom of the figure, we show the local mass density of the three components at . FFA follows the CER distribution closely, while CHOL prefers to stay just below the CER head group, finding favorable hydrogen bonding with CER. Water diffusivity in the bulk scales normally with temperature, varying from at to at [37]. At , and approach each other only near , signifying considerable ordering of the water molecules in the bulk liquid close to the bilayer. Inside the bilayer the diffusivity is much less affected by the temperature, because the tail ordering and free volume do not change by much for this system in this temperature range. The range of , in which the water molecule is essentially confined in the same lipid neighborhood during the entire simulation, is larger than for the pure CER bilayer.

The maximum in the excess chemical potential (Fig. 7) is lower than in the pure CER bilayer ( at and at ). At , the permeability of 2:2:1 bilayer , is about one order higher compared to CER bilayer. Permeability drops by nearly two orders of magnitude on reducing the temperature to , giving, . The average crossing time for the 2:2:1 bilayer increases from at to at .
V Comparison with experiments
| T | molar ratio | P | ||||
|---|---|---|---|---|---|---|
| (K) | CER:CHOL:FFA | (kJ/mol) | (cm/s) | (ms) | ||
| 350 | 1:0:0 | 1.3 | 42.7 | 14.7 | 0.33 | |
| 350 | 1:1:1 | 1.1 | 34.6 | 11.8 | 0.03 | |
| 350 | 2:2:1 | 1.0 | 33.8 | 11.6 | 0.02 | |
| 300 | 2:2:1 | 1.1 | 38.5 | 15.3 | 0.69 |
In table 1, we summarize the main results for the CER bilayer and the ternary mixtures. The midplane density for the 2:2:1 bilayer at is [16], comparable to that of liquid hexadecane [38]. The excess free energy of water in hexadecane is [39], which agrees with the excess chemical potential at the bilayer midplane (Fig. 7). The strong nematic order induces much larger density close to the head groups, with average density for the SC bilayers being [16]. This reflects in the maximum in free energy being . Arrhenius plots of the temperature-dependent permeability from human[2] and porcine[40] stratum corneum suggest an activation energy .
Experiments on human [41] and porcine [8] SC found a permeability of order . The permeability value at for the 2:2:1 bilayer from our simulations is , which is about a factor of lower than the experimental values. With exponential dependence of , permeability depends strongly on the composition considered. In our simulations, we found that the 2:2:1 bilayer shows one order higher permeability compared to the CER bilayer at the same temperature. The lipids in the stratum corneum are highly polydisperse and contain unsaturated lipid tails. The presence of unsaturated fatty acids and polydispersity will probably introduce greater disorder, reducing the permeability as compared to the 2:2:1 bilayer considered in this study. Also, a patch of stratum corneum is unlikely to have a defect free lipid structure throughout the sample. Confocal laser scanning microscopy seems to suggests that the stratum corneum shows large variability in permeation over length scales [42]. If there are defect pathways that offer less resistance than the defect free lipid layers, the experimental result on the permeability is likely to be dominated by these defects. Both the increased disorder due to molecular polydispersity and the presence of defects in the macroscopic sample will increase the permeability above that of a single perfect bilayer (as simulated).
In permeation experiments there is a delay between the introduction of radioactive water vapour at one side of the sample and its first detection on the other side. This lag-time was experimentally found to be for porcine skin at [8]. In a Fickian diffusion model, this would correspond to a diffusion path length . Reasonable values of the diffusivity lead to a path length which is much larger than the physical thickness of the sample [8], and hence the interpretation of a tortuous path that avoids the corneocytes.
Concentrating on the 2:2:1 bilayer at , and using the bilayer thickness () and the minimum in (), the Fickian diffusion picture yields . This estimate is a factor of lower than the calculated mean crossing time () which takes into account the free energy barrier (table 1). Use of and in this Fickian diffusion picture will suggest an apparent pathlength that is times larger than the real bilayer thickness, although the molecule actually only traversed the bilayer thickness.
VI Conclusions
In conclusion, we have calculated the excess chemical potential profile and diffusivity for water molecules in fully hydrated lipid bilayers composed of lipids corresponding to the stratum corneum lipid matrix. We find that, compared to phospholipids simulated with very similar force fields and at the same temperature as in this study, the SC bilayers show nearly twice as high a chemical potential barrier against water permeation. The high degree of correlation of the free energy profile with the lipid density profile suggests that the main reason for this large free energy barrier is because the ceramide lipids lead to dense packing of the acyl tails. Water diffusivity across the bilayer does not change drastically as compared to phospholipids. High degree of tail ordering ensures that once the water molecule is inside the hydrocarbon region, it can move without large extra free energy cost along the chain-orientation direction. However, diffusivity in the perpendicular direction (in-plane diffusivity) is decreased by two orders of magnitude.
The permeability coefficients from our simulations are much smaller than the experimental results. In our analysis, we showed that the high free energy barrier necessitates the use of a first passage time to estimate the lag time, and neglect of the barrier leads to an apparent pathlength that is much larger than the physical thickness of the sample. Our results suggest that, for water permeation, we do not need to invoke impermeable corneocytes.
It is possible to discern the importance of the free energy barrier on the lag time from experiments at different temperatures. The Kramers’ mean first passage formalism suggests that the temperature dependence of the lag time will be Arrhenius like: , while a simple diffusive picture suggests . We are not aware of any measurements which looked at this temperature dependence.
Acknowledgments
This work was supported by Yorkshire Forward through the grant YFRID Award B/302. CD acknowledges SoftComp EU Network of Excellence for financial support and computational resources. The authors thank Jamshed Anwar, Simon Connell, Michael Bonner, Andrea Ferrante, Alex Lips, Robert Marriott, Khizar Sheikh, and Barry Stidder for useful discussions.
References
- [1] The biology of the skin, ed. R. K. Freinkel and D. T. Woodley, Parthenon Publishing, London, 2001.
- [2] R. J. Scheuplein and I. H. Blank, Physiol. Rev., 1971, 51, 702–747.
- [3] M. R. Prausnitz, S. Mitragotri and R. Langer, Nat. Rev. Drug Discovery, 2004, 3, 115–124.
- [4] M. Lodén, Am. J. Clin. Derm., 2003, 4, 771–788.
- [5] L. Norlén, I. Nicander, B. L. Rozell, S. Ollmar and B. Forslind, J. Invest. Derm., 1999, 112, 72–77.
- [6] A. Weerheim and M. Ponec, Arch. Derm. Res., 2001, 293, 191–199.
- [7] A. S. Michaels, S. K. Chandrasekaran and J. E. Shaw, AICHE J., 1975, 21, 985–996.
- [8] R. O. Potts and M. L. Francoeur, J. Invest. Dermatol., 1991, 96, 495–499.
- [9] J. A. Bouwstra, A. de Graaff, G. S. Gooris, J. Nijsse, J. W. Wiechers and A. C. van Aelst, J. Invest. Derm., 2003, 120, 750–758.
- [10] T. M. Jacobson, K. U. Yüksel, J. C. Geesin, J. S. Gordon, A. T. Lane and R. W. Gracy, J. Invest. Derm., 1990, 95, 296–300.
- [11] M. Hara and A. S. Verkman, Proc. Nat. Acad. Sc., 2003, 100, 7360–7365.
- [12] J. Pieper, G. Charalambopoulou, T. Steriotis, S. Vasenkov, A. Desmedt and R. Lechner, Chemical Physics, 2003, 292, 465–476.
- [13] G. Kasting, N. Barai, T. Wang and J. Nitsche, J. Pharm. Sc., 2003, 92, 2326–2340.
- [14] H. Farwanah, J. Wohlrab, R. H. H. Neubert and K. Raith, Anal. Bioanal. Chem., 2005, 383, 632–637.
- [15] L. Norlén, I. Nicander, A. Lundsjö, T. Cronholm and B. Forslind, Arch. Derm. Res., 1998, 290, 508–516.
- [16] C. Das, M. Noro and P. D. Olmsted, submitted to Biophys. J., 2009.
- [17] S. J. Marrink and H. J. C. Berendsen, J. Phys. Chem., 1994, 98, 4155–4168.
- [18] W. K. den Otter and W. J. Briels, J. Chem. Phys., 1998, 109, 4139–4146.
- [19] P. Hänggi and P. Talkner, Rev. Mod. Phys., 1990, 62, 251–341.
- [20] H. J. C. Berendsen, D. van der Spoel and R. van Drunen, Comp. Phys. Comm., 1995, 91, 43–56.
- [21] D. van der Spoel, E. Lindahl, B. Hess, G. Groenhof, A. E. Mark and H. J. C. Berendsen, J. Comp. Chem., 2005, 26, 1701–1718.
- [22] D. van der Spoel, E. Lindahl, B. Hess, A. R. van Buuren, E. Apol, P. J. Meulenhoff, D. Tieleman, A. L. T. M. Sijbers, K. A. Feenstra, R. van Drunen and H. J. C. Berendsen, Gromacs User Manual version 3.3, www.gromacs.org, 2005.
- [23] W. Jorgensen and J. Tirado-Rives, J. Am. Chem. Soc., 1988, 110, 1657–1666.
- [24] S. Chiu, M. Clark, V. Balaji, S. Subramaniam, H. Scott and E. Jackobsson, Biophys. J., 1995, 69, 1230–1245.
- [25] O. Berger, O. Edholm and F. Jähnig, Biophys. J., 1997, 72, 2002–2013.
- [26] J.-P. Ryckaert and A. Bellemans, Chem. Phys. Lett., 1975, 30, 123–125.
- [27] R. Notman, W. K. den Otter, M. G. Noro, W. J. Briels and J. Anwar, Biophys. J., 2007, 93, 2056–2068.
- [28] M. Höltje, T. Förster, B. Brandt, T. Engels, W. von Rybinski and H.-D. Höltje, Biochim. Biophys. Acta, 2001, 1511, 156–167.
- [29] H. Berendsen, J. Postma, W. van Gunsteren and J. Hermans, Intermolecular Forces, Reidel, Dordrecht, 1981, pp. 331–342.
- [30] S. Nosé, Mol. Phys., 1984, 52, 255–268.
- [31] W. G. Hoover, Phys. Rev. A, 1985, 31, 1695–1697.
- [32] M. Parrinello and A. Rahman, J. Appl. Phys., 1981, 52, 7182–7190.
- [33] S. Nosé and M. L. Klein, Mol. Phys., 1983, 50, 1055–1076.
- [34] J. P. Ryckaert, G. Ciccotti and H. J. C. Berendsen, J. Comp. Phys., 1977, 23, 327–341.
- [35] S. Miyamoto and P. A. Kollman, J. Comp. Chem., 1992, 13, 952–962.
- [36] E. Falck, M. Patra, M. Karttunen, M. T. Hyvönen and I. Vattulainen, J. Chem. Phys., 2004, 121, 12676–12689.
- [37] P. Mark and L. Nilsson, J. Phys. Chem. A, 2001, 105, 9954–9960.
- [38] A. Bondi, J. Phys. Chem., 1954, 58, 929–939.
- [39] P. Schatzberg, J. Phys. Chem., 1963, 67, 776–779.
- [40] G. Golden, D. B. Guzek, A. Kennedy, J. McKie and R. Potts, Biochemistry, 1987, 26, 2382–2388.
- [41] I. H. Blank, J. Moloney, A. G. Emslie, I. Simon and C. Apt, J. Invest. Dermatol., 1984, 82, 188–194.
- [42] A. Schätzlein and G. Cevc, British Journal of Dermatology, 1998, 138, 583–592.