Effective leadership in competition
Abstract
Among natural biological flocks/swarms or even mass social activities, when the collective behaviors of the followers has been dominated by the moving direction or opinion of one leader group, it seems very difficult for later-coming leaders to reverse the orientation of the mass followers, especially when they are in quantitative minority. This Letter reports a counter-intuitive phenomenon, Following the Later-coming Minority, provided that the late-comers obey a favorable distribution pattern which enables them to spread their influence to as many followers as possible in a given time and to accumulate enough power to govern these followers. We introduce a discriminant index to quantify the whole group’s orientation under competing leadership, which helps to design an economic way for the minority later-coming leaders to defeat the dominating majority leaders solely by optimizing their distribution pattern. Our investigation provides new insights into the effective leadership in biological systems, with meaningful implication to social and industrial applications.
pacs
05.65.+b, 89.75.-k, 89.20.KkFor biological flocks/swarms, their collective behavior always depends on social interactions among group members. In many cases, just a few individuals have the pertinent global information, like the knowledge about the location of a food source or an obstacle, or a migration route. It is known that several species can evolve specific signals that help guide the uninformed individuals [1]. On the other hand, valuable leadership may be correlated with age, status or reputation, and it is very common for many species that experienced group members play an important role in helping the less experienced. It was demonstrated that a small proportion of informed individuals are sufficient to guide the navigating behavior of the whole group, e.g., foraging fish schools and bee swarms heading for new nest sites [2, 3].
Nevertheless, the nature of bio-groups is not always that simple, since it often happens that the informed individuals within a group may differ with each other in their preferred directions due to different experiences or motivations. This divergence also happens frequently in human society, e.g., different political parties can possess totally different beliefs. Interestingly, it is often encountered that, when the mass followers’ orientation has been completely dominated by one leader group, another leader group, who may be in quantitative minority, enters aiming at reverse the followers’ orientation to its own. For instance, migrating birds or foraging insects developed an effective way to deviate to a new promising direction at a low cost of additional leadership [3]. In elections, a new social party always desires to defeat its elder opponents with as few extra seats in a legislature as possible. In marketing competition, the newly coming corporations would manage to acquire more share from the market dominated by the monopolies at a low cost.
In the last years, this issue of effective leadership has attracted significant attention [2, 3, 4, 5]. In general, many existing works show that the whole group is more likely to follow the majority rather than the minority under the guidance of divergent leadership [6]. For instance, the cost to the groups as a whole is considerably higher for a “despotic” than for a “democratic decision” or “following the majority” manner [2]. The larger the group, the smaller the proportion of informed individuals is needed to guide the group [3]. In social science, it is shown that the public is apt to follow the majority under the impression of divergent opinions from different social parties [7, 8]. The synchronization of many hands clapping [9] and the escaping panic [10] strongly imply the rule of “following the majority”. All these bring up an important question: is it possible for the minority later-coming leaders defeat the dominating majority ones and how?
In this Letter we address this question in a generic model of collective behavior, the Vicsek model [11], in which individuals align motions to the average of their geographical neighbors to achieve the global velocity synchronization. Importantly, we have found that defeating by minority is highly possible provided that the later-comers adopt better distribution pattern to influence and persuade more followers. To quantify the effectiveness of the leadership, we propose an evaluation index which can predict reasonably the orientation of the mass followers under the guidance of diverged leadership solely basing on the parameters of the distribution patterns.
The original Vicsek model is extended to incorporate the influence of the earlier and later-coming leaders: a small proportion of the whole group of -individuals is given a preferred motion direction representing, for example, the direction to a known food resource or a migration target, or the faithfulness for one political belief or commodity brand. In our model there are three types of individuals: i) earlier-coming leaders moving rightwards, namely, , whose dynamics are ; ii) minority later-coming leaders moving leftwards, namely, , whose dynamics are with ; and iii) uninformed individuals, namely, , whose dynamics are updated by , , with . Here, denotes the position of individual , and the leaders move without being affected the others. are naive and have no preference in any particular direction but just follow the average directions of their neighbors, and cannot differentiate the leaders and the followers. Note that, at the beginning, there are just and and once the orientation of has completely aligned to , appears to compete with to reverse the orientation of .
The velocity of the -th follower, i.e. , has a constant speed and a direction , where denotes the average direction of individuals within a circle of radius surrounding individual (including itself) [11]. This kind of aligning mechanism can nicely mimic the local dynamics of “go with the stream” in both bio-groups and human society. To focus on the effects of the leaders, we do not consider the influence of the external noise.
Here, without loss of generality, we set and with periodic boundary conditions, and , as Ref. [11]. The global orientation of the whole group is defined as normalized steady-state alignment index , where denotes the steady-state direction of the whole group, thus the values , and of mean that the whole group is completely following , and no preference in direction, respectively.

Now recall the key problem this Letter addresses: is it possible for to defeat ? Questions closely relevant to this issue have already kindled up the interests of not only physicists and biologists but also social scientists and marketing researchers for years [3, 7]. In these studies, it is generally drawn that the followers would be apt to follow the majority leaders since in the alignment models each individual follows the average direction of its neighbors. Then, it can be seen that, if the majority and the minority have the same geographical distribution pattern, the majority has either larger influence area or higher particle density which intensifies their leadership. Thereby, it is natural to deduce that decisive parameter(s) for effective leadership may be not the absolute number of the leaders but the following two key, but competing factors: F1) Effective Range: to distribute leaders’ influence to as many followers as possible within a given time; F2) Persuasive Intensity: to be sufficiently persuasive to govern the followers they can influence with high density. In other words, minority leaders may defeat the majority ones provided that they have better F1 or F2 or both, and our work will verify such a hypothesis. In our scenario given above, F1 and F2 can be quantified by the normal length and clustering factor , as shown in Fig. 1. Obviously, these two factors are however somewhat contradictive since F1 requires the leaders to distributed sparsely into the followers’ region while F2 favors highly condensed leader groups, and this contradiction constitutes the main challenge of the problem.
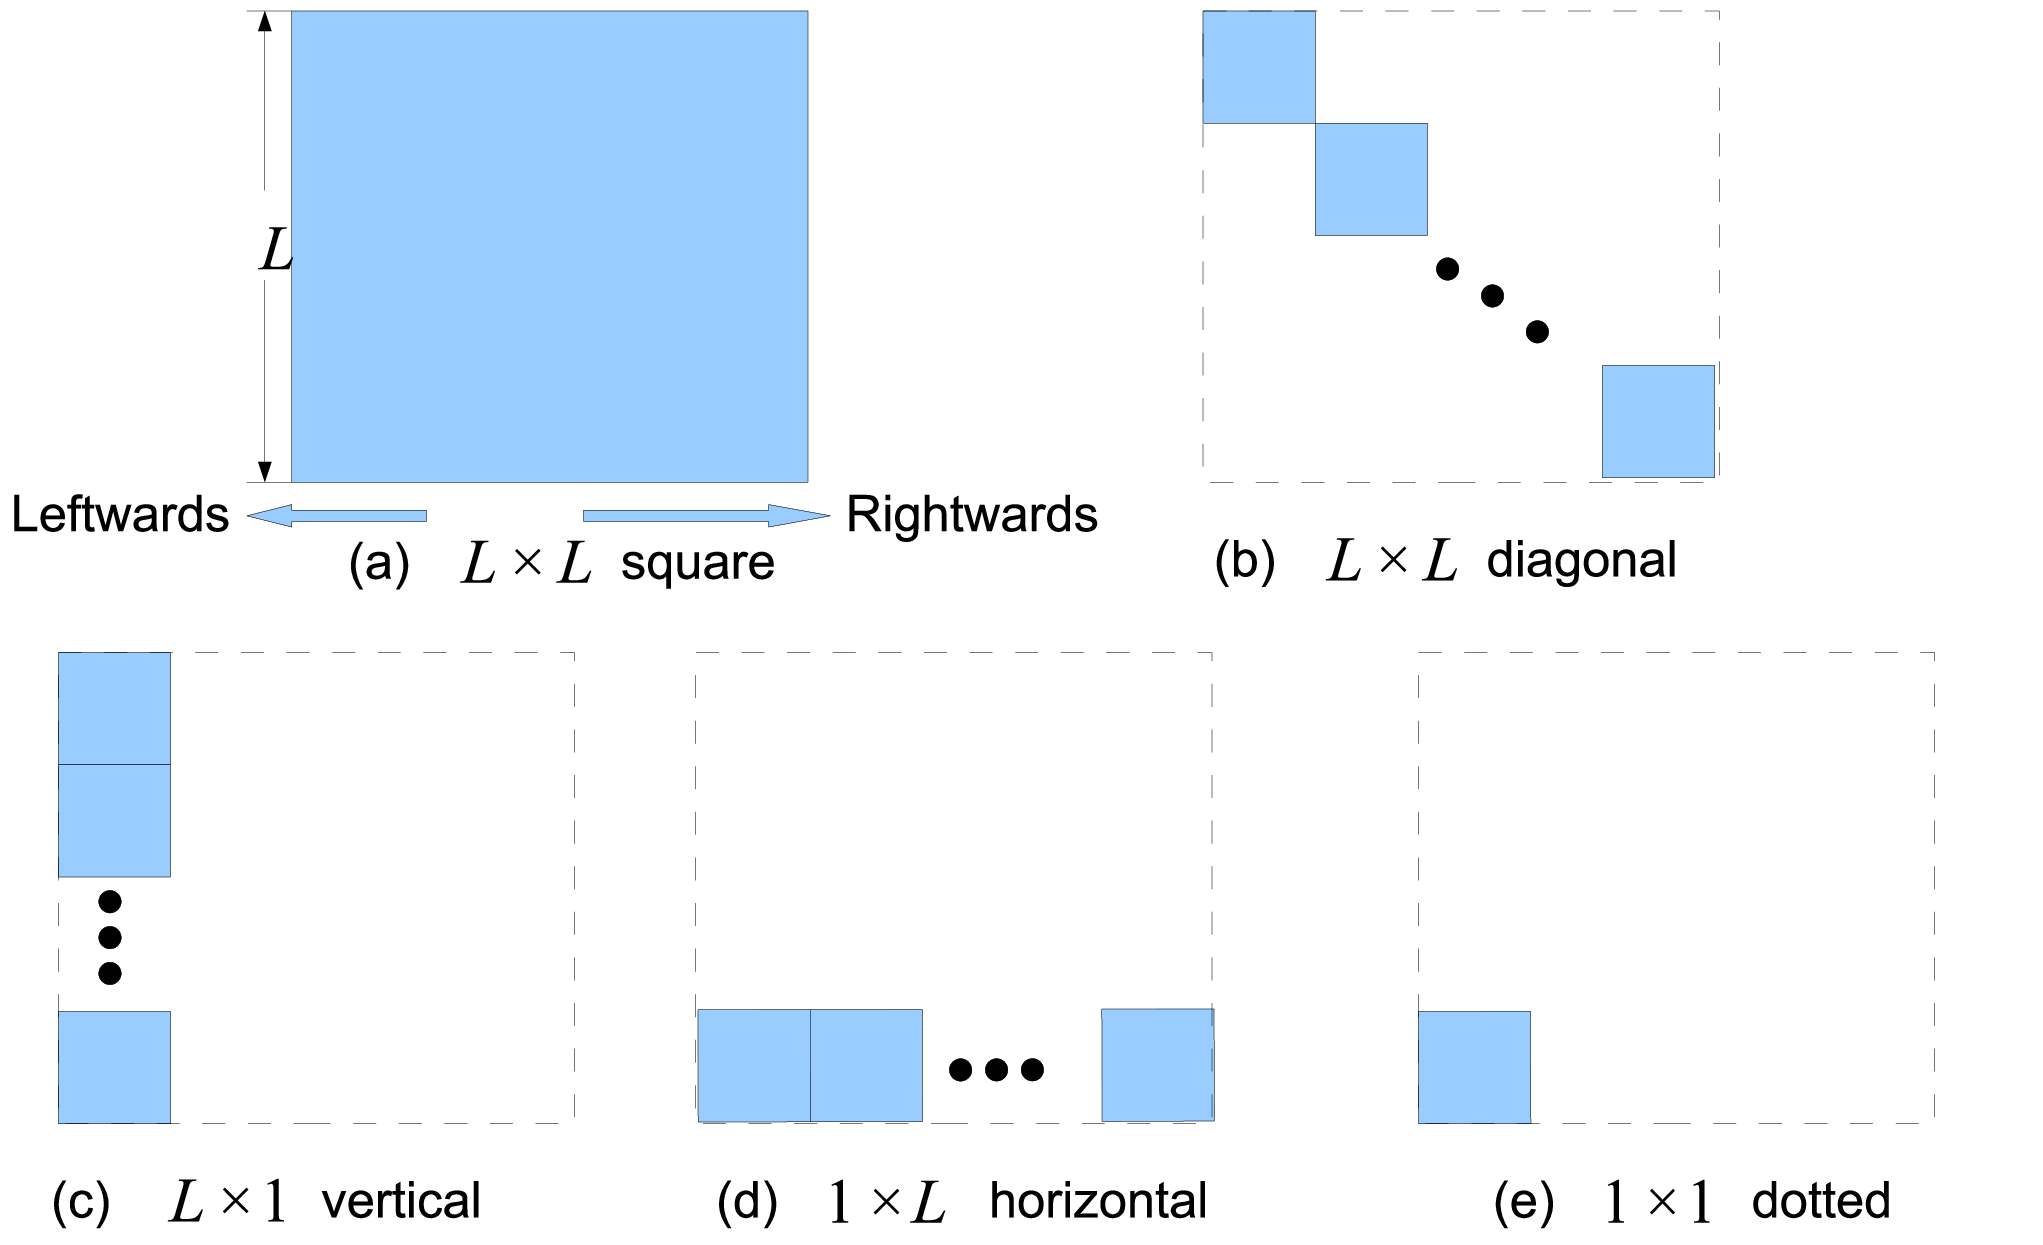
To address this interesting question, we have implemented simulations with distributed in the square (Fig. 2(a)), as considered in most previous works. We then examine the effectiveness of leader group on various distribution patterns, such as the square, diagonal, vertical, horizontal and dotted regions as shown in Figs. 2(a)–(e), respectively. According to the two factors F1 and F2 of effective leadership and taking into consideration of the moving directions of and , one can expect that outperforms because they have the identical F1 but favors F2. Analogously, can also be expected to be superior to since they have the same F2 but have better F1. However, it is difficult to compare and , since has better F1 while greatly favors F2. Thus, one has to resort to numerical simulations to reveal more concrete rules behind.

Four more interesting and concrete phenomena are observed from Fig. 3: i) vertical and dotted patterns (Figs. 2(c) and (e)) can defeat the earlier-coming square pattern and reverse the orientation of the followers, while horizontal, square and diagonal patterns (Figs. 2(a), (b) and (d)) not. ii) vertical and horizontal patterns are the most and least effective ones, respectively; iii) diagonal distribution is a little bit better than the square distribution; iv) dotted pattern is the second most effective one (just below ). Inspiringly, for adopting a dotted distribution , it takes considerable running steps to propagate its influence to remote followers, so that the converging time is much longer. These simulation results help us understand more deeply the nature of F1and F2. Specifically, in our scenario,F1 has been realized by spreading out sufficiently perpendicularly to their movement direction, while a condensed distribution corresponding to favorable F2 could first slave the followers locally and then propagate the influence to the whole population.

|

|
To this end, one can be delighted to infer that even if have been completely dominated by , it is highly possible for the minority to reverse the followers’ opinion with their better distribution pattern. Indeed, as demonstrated clearly in Fig. 4 (a), in a large region above the white dashed line where , the whole group reverses the orientation from to (blue region) to follow the leadership of the minority which has a better distribution pattern ( vertical) compared to the majority ( square). Similar results are observed for the other favorable dot pattern of .
The numerical simulations suggest that the two factors F1 (influencing area) and F2 (clustering intensity) determining the leadership performance can be quantified as below. As shown in Fig. 1, F1 can be represented by the length of the leaders’ distribution region perpendicular to the movement direction of the leader, namely the normal length . The clustering intensity F2 can be characterized by the reciprocal of the average geographical distance among the leaders, namely the clustering factor . We find that for the number of leaders , the average geographical distance between the first nearest pairs of leaders can sensitively distinguish various patterns discussed in Fig. 2 and Fig. 5. More precisely, for the leaders, . Here, denotes the geographical distance between the -th nearest pair of the leader group. The same formula hold for of the leader group .

|

|
Now with these factors and (normal lengths and clustering factors of and , respectively), one is ready to make a concrete comparison between different leaderships. To quantify the effective leadership using these factors, we further define an influencing region ratio and a clustering intensity ratio . Remarkably, we find that the effective leadership can be reasonable predicted solely by these parameters of the leader groups. We let randomly distribute in the unbiased square (Fig. 2(a)), and let (with ) randomly distribute in , , , rectangular regions, respectively, and hence ( ) while is increasing monotonously. As shown in Fig. 5(a), drops with increasing until asymptotically approaching a saturation value of , indicating dominant leadership of . To investigate the role of and simultaneously, we let (with ) randomly distribute in , , , square regions, respectively, which implies that is falling whilst is rising along this distribution sequence. Fig. 5(b) shows that reduces with increasing and . As a consequence, one can confidently draw that the minority later-coming leaders do have the potential to reverse the followers if only they have larger value of or or both.
The observation from these intensive simulations suggest that we could determine effective leadership for the two competing leader groups solely basing on specific combinations of the geometrical parameters and . In fact, taking into consideration of the maximal and minimal saturation values and of and , we hereby propose a discriminant index by
| (1) |
Here, is used to adjust the origin-traversing slope of function, which endows an essential degree of freedom. According to our extensive numerical simulations in Fig. 5, yields satisfactory approximation performance. Thereby, without loss of generality, we set , and then apply Least Square Estimation to identify , commonly for all the results in Fig. 5. Note that this index is self-consistent in the sense that: i) the maximal and minimal saturation values keep at and for the feasible ranges of and , and ii) if either value of and is 1 then will be merely determined by the other one.
It is important to note that the definition of the clustering factor naturally takes the effect of the number of leaders and into account. Remarkably, Eq. (1) with the same parameter and can account for the effective leadership for fixed patterns, but varying numbers and ( Fig. 4(b)). A comparison of the Figs. 4 (a) and (b) shows clearly that basing on the geometrical characterization of the distribution patterns of the leaders can very nicely predict the effective leadership in the model .
In summary, uncovering the nature of effective leadership is of great theoretical and practical significance. We have shown that later-coming leaders, even in quantitative minority, have the potential to defeat the earlier-coming dominating ones, if only the former obeys a better distribution pattern. A better distribution pattern has larger influential region and greater clustering factor, which can equip the leaders with the capability of influencing more followers in a given period and strengthening the persuasion power on the followers as well. Intriguing enough, the mechanism underlying such an apparent “following the minority” in the whole group is due to the scheme of “following the majority” locally. Moreover, we have demonstrated that an index merely basing on the geometrical parameters of the distribution patterns of the leaders can provide nice prediction of the effective leadership in competition. With this index one can quantify the advantage of one leader group over another so as to design an economical way for the later-coming leaders to defeat the majority earlier-coming ones. Our simulations on the other two more sophisticated models, the Couzin’s three-sphere model [1] and the alignment model [3], strongly support our conclusion on the effective leadership mechanism.
Our investigation has launched a new exploration on the essential rules that govern leadership potentials. Motivated by both natural and social systems, our findings have potential industrial and social applications as well. The results are valuable to explain how the migrating birds or foraging insects deviate to a new promising direction at a low cost of additional leadership. The findings are also helpful to endow the newborn corporations with some economic strategy to compete with their dominating opponents in marketing competitions. Moreover, industrial multi-agent systems can be expected to benefit from this work to improve its adaptability to a new environment.
The work is partially supported by the National Natural Science Foundation of China (NNSFC, Grant No. 60704041) and the Research Fund for the Doctoral Program of Higher Education (RFDP, Grant No. 20070487090) (HTZ), the NNSFC (Grant No. 10635040) (TZ) and by the Hong Kong Baptist University (CSZ).
References
- [1] I.D. Couzin, J. Krause, R. James, G.D. Ruxton and N.R. Franks, J. Theor. Biol. 218, 1 (2002).
- [2] L. Conradt and T. J. Roper, Nature 421, 155 (2003).
- [3] I.D. Couzin, J. Krause, N.R. Franks and S.A. Levin, Nature 433, 513 (2005).
- [4] D.J.T. Sumpter, Philosophical Transactions of the Royal Society B 361, 5 (2003).
- [5] J. Buhl, D.J.T. Sumpter, I.D. Couzin, J.J. Hale, E. Despland, E. R. Miller and S. J. Simpson, Science 312, 1402 (2006).
- [6] C.K.W. De Dreu and N.K. De Vries, British Journal of Social Psychology 35, 77 (1996).
- [7] S. Suo and Y. Chen, Journal of Artificial Societies and Social Simulations 11, 42 (2008).
- [8] M. Anghel, Z. Toroczkai, K. E. Bassler and G Korniss, Phys. Rev. Lett. 92, 058701 (2004).
- [9] Z. Nada, E. Ravasz, Y. Brechet, T. Vicsek and A.-L. Barabasi, Nature 403, 849 (2000).
- [10] D. Helbing, I. Farkas and T. Vicsek, Nature 407, 487 (2000).
- [11] T. Vicsek, A. Czirók, E. Ben-Jacob, I. Cohen, and O. Shochet, Phys. Rev. Lett. 75, 1226 (1995).