Near-infrared spectroscopy of SDSS J0303-0019:
a low luminosity, high Eddington ratio quasar at
Note: Accepted by ApJ on July 1, 2009
Abstract
We present sensitive near–infrared VLT ISAAC spectroscopic observations of the quasar SDSS J030331.40001912.9. This QSO is more than a magnitude fainter than other QSOs at for which NIR spectroscopy has been obtained to date and is therefore presumably more representative of the QSO population at the end of Cosmic Reionization. Combining rest–frame UV continuum luminosity with the width measurements of the Mg II and C IV lines, we derive a black hole mass of M⊙, the lowest mass observed for QSOs to date, and derive an Eddington ratio of 1.6, amongst the highest value derived for QSOs at any redshift. The Spitzer 24 m non–detection of this QSO does not leave space for a significant hot dust component in its optical/near–infrared SED, in common with one other faint QSO at , but in contrast to more than twenty more QSOs and all known lower redshift QSOs with sufficiently deep multi-wavelength photometry. We conclude that we have found evidence for differences in the intrinsic properties of at least one QSO as compared to the lower–redshift population.
Subject headings
Galaxies: high-redshift — early Universe — quasars: emission lines — quasars: individual: SDSS J030331.40-001912.9I. Introduction
The radiation from luminous quasi stellar objects (QSOs) can currently be studied up to redshift 6.5 and thus allows one to probe, over much of the Universe’s age, the properties of their central black holes (Willott et al. 2003, BHs, e.g.,), their broad line region (Freudling et al. 2003, BLR, e.g.,), and the ionization state of intergalactic gas (Fan et al. 2006b, e.g.,). The most distant QSOs are of importance for both the study of galaxy evolution and large–scale structure. Among the most surprising discoveries in this field are the detection of BH masses M⊙ (Barth et al. 2003; Willott et al. 2003, e.g.,) and the apparent constancy of the observed QSO BLR properties with redshift, even up to (Pentericci et al. 2002, e.g.,), corresponding to an age of 870 Myr. E.g., the Fe II/Mg II (Freudling et al. 2003; Maiolino et al. 2003; Iwamuro et al. 2004; Kurk et al. 2007, hereafter K07) and N V/C IV (Jiang et al. 2007) emission line ratios observed in the BLR of QSOs are as high as that observed in low-redshift objects. Thus, near-solar metallicity in the centers of some of the earliest systems and accretion of solar masses in a central BH can be attained in less than 1 Gyr. One caveat, however, has to be taken into account: until now only the most luminous objects at have been studied. These objects may experience faster evolution than less luminous objects and therefore resemble low to intermediate redshift QSOs already at . Secondly, the relationships established using low-luminosity AGN (at low redshift) may not be valid for objects at the upper end of the luminosity distribution. As an example, the determination of the BH mass in active galaxies was calibrated with reverberation mapping observations of AGN that are one to two orders of magnitude fainter than the QSOs observed until now (Kaspi et al. 2000). It is therefore important to extend studies to lower–luminosity objects. Here we present the first observations of a QSO at with luminosity lower than L erg s-1: the QSO SDSS J030331.40-001912.9 (catalog ) (hereafter J0303-0019). This QSO was detected in the Sloan Digital Sky Survey (SDSS) Deep Stripe with a magnitude of . Its discovery spectrum shows a very strong and narrow Ly emission line at (Jiang et al. 2008). As this line falls in the -band, the actual continuum luminosity is low, , 1.5 magnitudes fainter than the mean of the QSO samples studied in K07 and Jiang et al. (2007). In addition, this is one of the two out of about twenty QSOs that are not detected at 24 m with MIPS/Spitzer, implying a rest frame 3.5m/4400Å ratio far lower than for any other known QSO (Jiang et al. 2006, L. Jiang et al. in prep.).
II. Observations and reduction
II.1. Near-infrared spectroscopy
NIR spectroscopy of J0303-0019 in the and bands was obtained in service mode on December 24 and November 26 and 28, 2007, respectively, with ISAAC (Moorwood et al. 1998) at VLT UT1. We used the short wavelength arm, equipped with a 10241024 Hawaii Rockwell array which has a pixel scale of 0.147″. The 1″ slit results in a spectral resolution of 550 and 450 for the and bands, respectively. Observations were carried out in a standard ABBA offset pattern, with additional dithering to reduce the influence of bad pixels. Individual exposures were 148s, repeated 16 times per observing block. Nine such blocks were obtained in band, for a total exposure time of 5.9 hr, and two in band, for a total time of 1.3 hr. The data were reduced using ESO’s ISAAC pipeline software, which does flat fielding, background subtraction, rectification and combination of the individual frames in one observing block. We used sky lines to determine the wavelength calibration, obtaining an absolute 1 error of 3 and 7 Å, respectively, in and band. One-dimensional spectra were extracted from the pipeline products in IRAF. B and G stars with known NIR photometry were used to correct for telluric absorption and initial flux calibration of the one-dimensional spectra. Finally, the one-dimensional spectra were averaged to obtain the final spectra. These were flux calibrated using the broad band magnitudes obtained with the Calar Alto 3.5m telescope (see Sec. II.2). The reduction is similar to that carried out by K07, where more details are reported.
II.2. Near-infrared broad band imaging
For accurate flux calibration, the QSO SDSS J0303-0019 was imaged with the prime-focus NIR camera Omega2000 (Kovács et al. 2004) at the 3.5m telescope at Calar Alto, Spain. This instrument has a 2k2k HAWAII-2 detector with a pixel scale of 0.45″, resulting in a field of view of 15.4′15.4′. J0303-0019 was observed on September 10 and 11, 2008, for 20, 20, 25, and 77 minutes in , and bands, respectively. After dark subtraction and flat fielding with twilight exposures, the images were sky subtracted, registered and averaged with XDIMSUM11 1 XDIMSUM is a variant of the DIMSUM package developed by P. Eisenhardt, M. Dickinson, S.A. Stanford, and J. Ward. in IRAF22 2 IRAF is distributed by NOAO, which are operated by AURA, Inc., under cooperative agreement with NSF.. The seeing full width at half maximum (FWHM) on the combined images is 1.3″, 1.4″, 1.3″, and 1.0″, respectively. The combined images were astrometrized using the public service provided by astrometry.net (Hogg et al. 2008) using a second order polynomial to correct for distortions (which are small for Omega2000). Subsequently, we used about 80 stars from the 2MASS All-Sky Catalog of Point Sources (Skrutskie et al. 2006) to obtain the magnitude zero points. For –band, we used the UKIDSS second data release (Warren et al. 2007) catalog. Only half of the observed field is covered by UKIDSS, but this still provides 31 stars usable for the flux calibration. Systematic errors in the flux calibration are estimated to be below 0.1 mag. The resulting fluxes (Bertin & Arnouts 1996, using MAG_BEST in SExtractor,) are reported in Table 1.
| 20.600.14 | 20.440.08 | 19.780.08 | 18.950.09 |
III. Results
III.1. Optical and NIR spectra

| Line | z | FWHMaaFull width at half maximum in Å (observed frame) and km s-1 (rest frame) | FluxbbFlux in 10-17 erg cm-2 s-1 | EW0 | MBH | rEddccEddington ratio: Lbol / LEdd (CIV or MgII) | |||
|---|---|---|---|---|---|---|---|---|---|
| Å | Å | km s-1 | 10-17 cgs | Å | 108 M⊙ | ||||
| Ly (broad) | 6.0730.001 | 85991 | 1255 | 4350165 | 2556 | 872 | |||
| Ly (narrow)ddCentral wavelength fixed to that of the broad Ly line | 292 | 100070 | 10911 | 374 | |||||
| N V | 6.0630.001 | 87581 | 812 | 276080 | 902 | 321 | |||
| C IV | 6.0710.001 | 109531 | 652 | 178065 | 542 | 371 | 1.70.1 | 1.80.2 | |
| C IV | 6.0710.001 | 109531 | 653 | 177270 | 542 | 361 | 1.60.1 | 1.90.2 | |
| C IV | 6.0710.001 | 109531 | 643 | 176070 | 532 | 351 | 1.50.1 | 2.00.2 | |
| Mg II | 6.0780.001 | 198044 | 149 9 | 2261130 | 161 | 251 | 2.30.3 | 1.30.2 | |
| Mg II | 6.0780.001 | 198034 | 154 8 | 2340125 | 171 | 271 | 2.50.3 | 1.20.1 | |
| Mg II | 6.0770.001 | 198013 | 167 8 | 2525120 | 191 | 321 | 3.00.3 | 1.00.1 | |
In the top panel of Fig. 1, we show a close-up version of the optical spectrum, first presented in Jiang et al. (2008), taken at the W.M. Keck Observatory. For comparison, the SDSS QSO composite spectrum published by Vanden Berk et al. (2001, dashed curve), normalized to emission line free regions of our observed spectra, is overlayed, showing that the emission lines of J0303-0019 are much stronger and narrower than those present in the composite spectrum. We have made a simultaneous fit of the broad and narrow Ly and N V lines in the optical spectrum, after subtracting a standard (Vanden Berk et al. 2001) power law continuum with a slope as in Jiang et al. (2008). We fit only the spectrum redwards of the strong absorption feature seen in the Ly line. The best fit parameters are listed in Table 2, and the best fit curves are over plotted in Fig. 1. The equivalent width (EW) and FWHM of N V measured by us are about 20% higher than those reported by Jiang et al. (2006), who fixed the central wavelength of all fitted lines to the same redshift.
In the middle and bottom panels of Fig. 1, we show the VLT ISAAC - and -band spectra, containing the C IV and Mg II emission lines, respectively. There is also a tentative detection of Si IV/O IV]1398 at 9900 Å in the -band, which we do not try to fit. The obtained NIR photometry of J0303-0019 (Table 1) is consistent with a power law SED with slope , as measured in lower redshift QSOs (Vanden Berk et al. 2001). Imperfect flux calibration of the NIR spectra, however, may affect the slope of the reduced and band spectra. Indeed, the slope observed in the band seems redder and may be fit better by a slope of or even . As the NIR spectra are too short and the data not of sufficient quality to constrain the slope, we carry out emission line fits employing a range of slopes fixed to = 0, -1.0, and -1.5, to cover the complete range of plausible slopes. We take the slope of as the best compromise and use the parameters derived from fits employing the two extreme values to construct conservative error estimates on the fitted parameters. The C IV and Mg II lines are fit by single Gaussian functions on top of the co-addition of the power-law continuum, a Balmer pseudo-continuum and a template of Fe II lines (Kurk et al. 2007, see also). The strength of the latter two components were scaled with the power-law continuum, according to their proportions in the composite QSO spectrum by Vanden Berk et al. (2001). As the strength of the Fe II emission is not well constrained by the current spectra, but clearly lower than four times the strength in the SDSS composite spectrum, we have also carried out the fitting assuming a four times stronger and four times weaker Fe II contribution to establish proper error estimates.
The resulting best-fit parameters are displayed in Table 2. The C IV and Mg II lines have (rest frame) FWHM0 less than 2000 and 2600 km s-1, and EW0 of 361 Å and 27 Å, respectively. The mean FWHM0 of these lines in the SDSS QSO sample of Shen et al. (2008, hereafter S08) is 5700 and 5850 km s-1, respectively. Only 2% and 1% of the SDSS QSOs have C IV and Mg II FWHM0 smaller than 2000 and 2600 km s-1, respectively.
III.2. Black hole mass measurements
The widths of the Mg II and C IV lines, combined with an independent estimate of their characteristic distance from the center, can be used as a measure of the mass of the black hole (MBH). The relation between line width, luminosity and MBH has been calibrated empirically at low redshift using reverberation mapping (Kaspi et al. 2000, e.g.,). As in K07 and Jiang et al. (2007), we use the relations for C IV and Mg II presented by Vestergaard & Peterson (2006) and McLure & Dunlop (2004), respectively, which are also those applied to a sample of more than 60,000 SDSS QSOs by S08. Due to the scatter of individual data points around this relation MBH can be determined only within a factor of three. For J0303-0019, we derive MBH with these methods and take into account the range of power-law slopes and Fe II template strength described in Sec. III.1. We obtain MBH of 1.6 and 2.5108 M⊙, respectively, from the C IV and Mg II lines. These are the lowest MBH derived in a QSO to date, showing that, with this sample of fainter QSOs, we are indeed probing down the mass function of BHs. We note that the central wavelength of the C IV line is blue shifted by 350 km s-1 w.r.t. the Mg II line. According to S08, this modest shift ( km s-1) implies that the C IV line profile is dominated by gravitational effects and that MBH can therefore be reliably estimated from this line.
The MBH derived from the line widths and corresponding Eddington luminosities of = 46.31, and 46.51 erg s-1, respectively, are small compared to the QSO’s bolometric luminosity of 0.04 ergs s-1, implying a high Eddingtion ratio (rEdd). From optical, IR, and radio data (L. Jiang et al, in prep.), the bolometric luminosity of J0303-0019 is determined as in Jiang et al. (2006) to be ergs s-1. It is close to the values of = 46.62, and 46.65 erg s-1 obtained using the monochromatic luminosities at 1350 Å and 3000 Å, respectively, and the bolometric correction factors33 3 These bolometric correction factors are multiplicative in flux, unlike the common definition in units of magnitude. employed by S08 (BC1350 = 3.81, BC3000 = 5.15). Reconciling these values, we obtain the estimated bolometric luminosity stated above. The Eddington ratio of most QSOs is between 0.01 and 1 and only 804 out of the 62,185 SDSS with MBH determined from their line–width have rEdd (S08). The Eddington ratios for J0303-0019 derived from the C IV and Mg II lines are rEdd = 1.9 and 1.2 (see Table 2 and Fig. 2). Less than 2% and 0.2% of the SDSS QSOs have such an rEdd(C IV)1.9 and rEdd(Mg II)1.2. Even if we assume that the other four (faint) QSOs of the complete sample of QSOs discovered in the SDSS Deep Stripe (Jiang et al. 2008) have rEdd 1.2, the fraction of L erg s-1 QSOs at with rEdd 1.2 is 33%, almost 40 times higher than at lower redshifts.
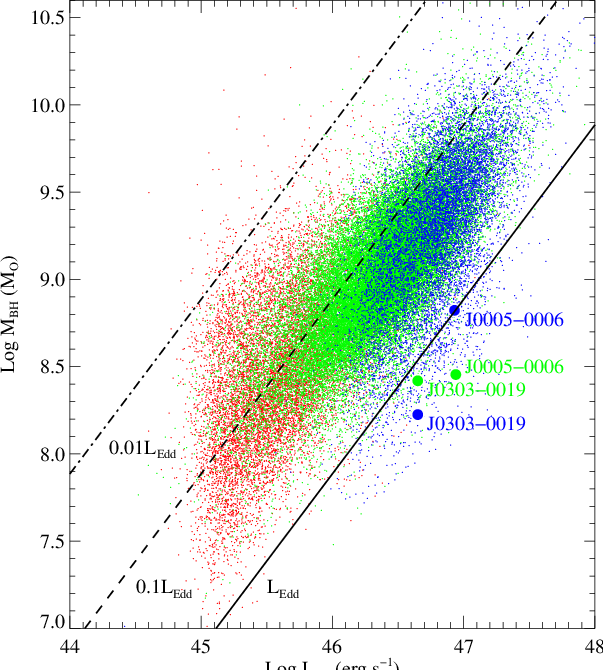
III.3. Abundance indicators
The chemical composition of gas clouds in the BLR can be explored by comparing observed emission line ratios to models. The heavy elements in the BLR are products of the star formation history in the host galaxy and therefore indicators of past star formation in at least the very center of the host. Nagao et al. (2006) present several emission line ratios observed in SDSS QSOs at and models explaining the ratios. According to Nagao et al., the strength of the N V/C IV ratio is strongly correlated with the luminosity of the QSO, which can be interpreted in terms of higher gas metallicity in more luminous QSOs. Although J0303-0019 is one of the faintest QSOs at , it has a of -26.2, which makes it moderately luminous in comparison with the SDSS QSOs studied by Nagao et al.. We measure a ratio of N V/C IV = 1.610.07, the highest ratio among the known QSOs, and also higher than those measured in the composite spectra of quasars in the luminosity range by Nagao et al. (2006). This suggests that the BLR has a high metal abundance, possibly as high as 10Z⊙ (Nagao et al. 2006, see Fig. 29 in), but the authors warn that estimates of the BLR metallicity using only emission line ratios involving N V might be quite uncertain (Hamann et al. 2002, see also).
III.4. Strömgren sphere
The intense UV radiation of the QSO keeps a region around the QSO ionized, the Strömgren sphere, which will actually only be spherical if the IGM surrounding the QSO is homogeneous. Outside this region, UV photons are absorbed by neutral hydrogen and this causes complete absorption blueward of the wavelength of redshifted Ly, the so-called GP trough (Gunn & Peterson 1965). For reasons discussed in Fan et al. (2006b), the Strömgren sphere radius is difficult to measure and we rather use the size of the proximity zone (RP), defined as the region in which the transmitted flux is 10% of the (extrapolated) continuum emission when smoothed to a resolution of 20 Å (as shown by the grey line in Fig. 1). We measure the blue edge of this region to be at 85131 Å (dashed line in Fig. 1). Combined with the systemic redshift of derived from the Mg II line (redmost dashed line in Fig. 1), we compute (K07) the co–moving radius of the Strömgren sphere to be RS = 4.50.3 Mpc. This is a typical value for luminous QSOs (Walter et al. 2003; Fan et al. 2006a, see, e.g., K07,). The average size of QSO Strömgren spheres, however, decreases by a factor 2.5 over , consistent with an increase of the neutral fraction with redshift (Fan et al. 2006b).
IV. Discussion and conclusion
SDSS J0303-0019 has the lowest BH mass known at and is a truly peculiar QSO: it has one of the highest Eddington ratios observed for a QSO, it has the highest N V/C IV ratio observed in QSOs, which is also significantly higher than that observed in lower redshift composite spectra of QSOs, and it is one of the two QSOs that is not detected in deep 24 m observations (Jiang et al. 2006, L. Jiang et al. in prep.). The other QSO which is not detected at 24 m is SDSS J000552.34-000655.8 (catalog ) (hereafter J0005-0006), which also has a high Eddington ratio: 2.4 as derived from the Mg II based MBH and 1.0 as derived from the C IV based MBH(K07). Detections at 250 GHz and 1.4 GHz have also been attempted but neither of the objects were detected down to rms values of 0.51, 0.48 mJy and 62, 130 Jy, respectively (Wang et al. 2008). In contrast, these QSOs were detected at 3.6, 4.5 and 5.8 m with IRAC/Spitzer (Jiang et al. 2006, L. Jiang et al. in prep.), implying a rest frame 3.5m/4400Å ratio far lower than for any object in the QSO sample, and lower than for any of the PG QSOs observed by Neugebauer et al. (1987) and Haas et al. (2000); Haas et al. (2003) for which the sensitivity at 3.5mu rest-frame is not an issue. Jiang et al. (2006) show that the optical/IR SEDs of the observed QSOs can be fit by two components: a power-law representing an accretion disk and a black-body representing hot dust. The respective (1 ) upper limits of 21 Jy and 9 Jy at 24 m for J0303-0019 and J0005-0006, significantly lower than the expected flux of 160 Jy based on SEDs of other QSOs, suggests the absence of hot dust. The implied lack of dust could be explained if the gas is metal–poor, as in a galaxy host which has not experienced major star formation yet. However, this interpretation would contradict the potentially high metallicity based on the measured N V/C IV ratio. Alternatively, the non-detection of the hot dust component could be due to different dust properties, or due to a surrounding cool dust torus hiding the hot component (Jiang et al. 2006).
We conclude that, with the observation of QSOs with bolometric luminosity erg s-1, we start to probe a population of QSOs that shows different observed properties as compared to higher luminosity QSOs and lower–redshift QSOs of all luminosities. We can only speculate that the hosts of the lower–luminosity QSOs at may be younger than higher–luminosity QSOs at the same redshift because the host galaxies of the latter are more massive and have therefore formed earlier. It is, however, unclear at this stage what physical mechanisms are causing the observed differences.
References
- Barth et al. (2003) Barth, A. J., et al. 2003, ApJ, 594, L95
- Bertin & Arnouts (1996) Bertin, E., & Arnouts, S. 1996, A&AS, 117, 393
- Fan et al. (2006a) Fan, X., et al. 2006a, ARA&A, 44, 415
- Fan et al. (2006b) —. 2006b, AJ, 132, 117
- Freudling et al. (2003) Freudling, W., et al. 2003, ApJ, 587, L67
- Gunn & Peterson (1965) Gunn, J. E., & Peterson, B. A. 1965, ApJ, 142, 1633
- Haas et al. (2003) Haas, M., et al. 2003, A&A, 402, 87
- Haas et al. (2000) —. 2000, A&A, 354, 453
- Hamann et al. (2002) Hamann, F., et al. 2002, ApJ, 564, 592
- Hogg et al. (2008) Hogg, D. W., et al. 2008, in ASP Conference Series, Vol. 394, ADAS XVII, ed. R. W. Argyle, P. S. Bunclark, & J. R. Lewis, 27
- Iwamuro et al. (2004) Iwamuro, F., et al. 2004, ApJ, 614, 69
- Jiang et al. (2008) Jiang, L., et al. 2008, AJ, 135, 1057
- Jiang et al. (2006) —. 2006, AJ, 132, 2127
- Jiang et al. (2007) —. 2007, AJ, 134, 1150
- Kaspi et al. (2000) Kaspi, S., et al. 2000, ApJ, 533, 631
- Kovács et al. (2004) Kovács, Z., et al. 2004, in SPIE Conference Series, ed. J. D. Garnett & J. W. Beletic, Vol. 5499, 432
- Kurk et al. (2007) Kurk, J. D., et al. 2007, ApJ, 669, 32
- Maiolino et al. (2003) Maiolino, R., et al. 2003, ApJ, 596, L155
- McLure & Dunlop (2004) McLure, R. J., & Dunlop, J. S. 2004, MNRAS, 352, 1390
- Moorwood et al. (1998) Moorwood, A., et al. 1998, The Messenger, 94, 7
- Nagao et al. (2006) Nagao, T., et al. 2006, A&A, 447, 157
- Neugebauer et al. (1987) Neugebauer, G., et al. 1987, ApJS, 63, 615
- Pentericci et al. (2002) Pentericci, L., et al. 2002, AJ, 123, 2151
- Shen et al. (2008) Shen, Y., et al. 2008, ApJ, 680, 169
- Skrutskie et al. (2006) Skrutskie, M. F., et al. 2006, AJ, 131, 1163
- Vanden Berk et al. (2001) Vanden Berk, D. E., et al. 2001, AJ, 122, 549
- Vestergaard & Peterson (2006) Vestergaard, M., & Peterson, B. M. 2006, ApJ, 641, 689
- Walter et al. (2003) Walter, F., et al. 2003, Nature, 424, 406
- Wang et al. (2008) Wang, R., et al. 2008, ApJ, 687, 848
- Warren et al. (2007) Warren, S. J., et al. 2007, ArXiv Astrophysics e-prints
- Willott et al. (2003) Willott, C. J., et al. 2003, ApJ, 587, L15