Comparisons of the radial distributions of core-collapse supernovae with those of young and old stellar populationsThanks: Based on observations made with the Isaac Newton Telescope operated on the island of La Palma by the Isaac Newton Group in the Spanish Observatorio del Roque de los Muchachos of the Institute de Astrofisica de Canarias, and on observations made with the Liverpool Telescope operated on the island of La Palma by Liverpool John Moores University in the Spanish Observatorio del Roque de los Muchachos of the Instituto de Astrofisica de Canarias with financial support from the UK Science and Technology Facilities Council.
Abstract
We present observational constraints on the nature of core-collapse supernovae through
an investigation into their radial distributions with respect to those of
young and old stellar populations within their host galaxies,
as traced by H emission and -band light respectively. We discuss results and the
implications they have on the nature of supernova progenitors, for a sample of 177 core-collapse
supernovae.
We find that the radial positions of the overall core-collapse population closely follow the
radial distribution of H emission, implying that both are excellent tracers of star formation
within galaxies. Within this overall distribution we find that there is a central deficit of SNII
which is offset by a central excess of SNIb/c. This implies a strong metallicity dependence on the
relative production of the two types, with SNIb/c arising from higher metallicity progenitors than SNII.
Separating the SNIb/c into individual classes we find that a trend emerges in terms of
progenitor metallicity going from SNII through SNIb to SNIc, with the latter arising from the highest
metallicity progenitors.
Keywords:
stars: supernovae: general – galaxies: general – galaxies: statistics1 Introduction
Determining the characteristics of supernova (SN) progenitors is a key area of research given their importance and influence on many other astrophysical processes. The distribution of SNe within host galaxies can give substantial information as to the nature of their progenitors. At different galactocentric radii within galaxies different stellar populations are found with different mean ages and metallicities. One can therefore investigate how the radial distributions of SNe correlate with those of different stellar populations and use this to further constrain the nature of progenitor stars. Here we present results on the radial distribution of a large number of core-collapse (CC) SNe with respect to the -(or r’)-band light and H emission of their host galaxies, and discuss the implications these have on the nature of SN progenitors. Results from an initial data set were presented in James & Anderson (2006) (JA06 henceforth) which showed that SNIb/c tended to occur within more central parts of the light distribution of their host galaxies, albeit with small number statistics (only 8 SNIb/c). This was ascribed to SNIb/c arising from higher metallicity progenitors. We test these initial results with an increased sample size enabling us to distinguish between the various SN sub-types, and present further results from a combined sample of 115 SNII, 58 SNIb/c and 4 SN ‘impostors’.
1.1 Core-collapse supernova progenitors
CC SNe are thought to arise from stars with initial masses 8 (a value that has been converged upon
from progenitor direct detections: Smartt et al. 2009, and
the maximum observed masses of WDs: Williams
et al. 2009). The different CC SN types are then thought
to arise as a result of processes dependent on progenitor mass, metallicity and/or binarity.
CC SNe are classified according to
the presence/absence of spectral lines in their early time spectra, plus
the shape of their light curves (see Filippenko 1997, for a review of
SN classification). The first major classification comes from the presence of
strong hydrogen emission in the SNII. SNIb and Ic lack any detectable
hydrogen emission, while SNIc also lack the helium lines seen in SNIb. SNII
can also be separated into various sub-types. SNIIP and IIL are classified in terms of
the decline shape of their light curves (Barbon
et al. 1979; plateau in the former and linear in the latter),
thought to indicate different masses of their envelopes prior to SN,
while SNIIn show narrow emission lines within their spectra (Schlegel, 1990), thought to arise
from interaction of the SN ejecta with a slow-moving circumstellar medium (e.g. Chugai &
Danziger 1994).
SNIIb are thought
to be intermediate objects between the SNII and Ib as at early times their
spectra are similar to SNII (prominent hydrogen lines), while at later times they
appear similar to SNIb (Filippenko
et al. 1993).
The main advances in our understanding of CC SN progenitors over the past decade have come from the direct detection
of progenitor stars on pre-explosion images. A recent compilation of a decade long search for
SN progenitors was presented by Smartt et al. (2009). One of the main conclusions from this work was a
mass range for the production of SNIIP of between 8.5 and 16.5. However, the statistics
on any of the other CC types currently preclude any firm conclusions as
to the exact nature of their progenitors. Their spectral and light curve characteristics indicate
that they must have lost some (the various II sub-types) or
all (SNIb) of their hydrogen envelopes during their
pre-SN evolution, with SNIc additionally having lost all helium. Whether this is due to different mass ranges of progenitors producing stronger
stellar winds and thus removing increasing amounts of mass, or whether metallicity or binarity play a dominant role
in deciding SN type is still under debate.
In the previous paper in this series (Anderson &
James 2008, AJ08 henceforth) we concluded that the main CC SN types
form a sequence of increasing progenitor mass, going from SNII to SNIb and SNIc, with the latter
arising from the highest mass progenitors. Meanwhile there is
also increasing evidence that SNIb/c tend to arise in more metal rich host galaxies than SNII
(Prantzos &
Boissier 2003, Prieto
et al. 2008). It therefore seems likely that both progenitor mass and metallicity
play important roles in producing the diversity of observed types. Stellar modeling also
predicts these dependencies (e.g. Heger et al. 2003, Eldridge &
Tout 2004) for single star progenitors. There is also a strong likelihood
that massive close binaries produce some of the range of CC SN types. Evidence
for binarity has been claimed for both SN 1987A and SN 1993J (Podsiadlowski et al. 1990 and Nomoto et al. 1993; Podsiadlowski et al. 1993; Maund et al. 2004 respectively),
while comparisons of the number ratio of SNII to SNIb/c with predictions from single star models and observations of massive stars in
the local group (Massey 2003, Crowther 2007), would seem to suggest that the production of a significant fraction of SNIb/c from binaries
is required.
Therefore while we have yet to tie down the progenitors of the different CC SN types (apart from possibly the SNIIP)
there seem to be many available avenues within our current understanding of stellar evolution to
produce the observed SN diversity.
1.2 The radial distribution of supernovae
At different radial positions within galaxies, stellar populations with different characteristics are thought to dominate. For example
in spiral galaxies the central regions may be dominated by the old stellar bulge while at larger radii younger stellar populations
associated with spiral arms are likely to become relatively more dominant. The metallicities of
particular stellar populations are also observed to strongly correlate with galactic radial position, with higher chemical
abundances found in the centres, decreasing with radial distance. This characteristic is found in nearly all galaxy types with
the steepest abundance gradients found in normal spirals (see Henry &
Worthey 1999, for a review on this subject). One can therefore
study the radial distributions of different SN types to look for implied differences in their parent stellar populations and their progenitor stars.
Following Bartunov et al. (1992), van den
Bergh (1997) found a suggestion that
SNIb/c are more centrally concentrated than SNII, a result that has been confirmed with better statistics by Tsvetkov et al. (2004) and
most recently Hakobyan (2008). This suggests a metallicity dependence in producing SNIb/c, consistent with the scenario where
higher metallicity progenitors have stronger line driven winds (see e.g. Puls et al. 1996; Kudritzki &
Puls 2000; Mokiem
et al. 2007)
and thus lose more of their pre-SN envelopes
producing a higher fraction of SNIb/c. These studies generally normalise the SN galactocentric distances to the total size
of host galaxies in order to make statistical arguments on differences between the radial distributions of SN types. However,
this analysis does not take into account how the stellar populations of these host galaxies are radially distributed
and therefore complicates the interpretations that can be made on the nature of SN progenitors.
Here we use -(or r’)-band and H imaging to investigate how the different SN types are radially distributed with respect to
a young stellar population as traced by the H emission and an older stellar populations as traced by the -(or r’)-band
continuum light. Using this analysis we address two questions. Firstly, are the radial positions of the different SN types consistent with being drawn at
random from a young or an old stellar population?
Secondly, do any of the SN types preferentially occur at particular
radial positions within their host galaxies and what can this tell us about the nature
of their progenitor ages and metallicities?
The paper is arranged as follows: in the next section we present the data and discuss the reduction
techniques employed, in § 3 we summarise the radial aperture analysis used throughout
this work, in § 4 we present the results for the radial distribution
of the different SN types, in § 5 we discuss possible explanations for the results and
implications that these have on the nature of SN progenitors and finally in § 6 we
draw our conclusions.
2 Data
The initial galaxy sample that formed the data set for JA06 was the H Galaxy Survey (HGS).
This survey was a study of the SF properties of the local Universe using H imaging of
a representative sample of nearby galaxies, details of which can be found in James
et al. (2004).
63 SNe were found to have occurred in the 327 HGS galaxies
through searching the International Astronomical Union (IAU) database
11
1
http://cfa-www.harvard.edu/iau/lists/Supernovae.html.
Through three observing
runs on the Isaac Newton Telescope (INT) and a long term time allocation on
the Liverpool Telescope (LT) we have now obtained imaging for the host galaxies of
a total of 178 CC SNe, the analysis of which is presented here. The LT is a fully robotic 2m telescope
operated remotely by Liverpool John Moores University. To obtain our imaging we used
RATcam together with the narrow H and the broad-band Sloan r’ filters. Images were binned
22
to give 0.278′′ size pixels, and the width of the H filter enabled us to image
target galaxies out to 2500 kms-1. The INT observations used the Wide Field Camera (WFC) together
with the Harris R-band filter, plus the rest frame narrow H (filter 197)
and the redshifted H (227) filters enabling us to image host galaxies out to 6000 kms-1. During our
2005 INT observing run we also used the SII filter (212) as a redshifted H filter and imaged 15
SN hosting galaxies at recession velocities of 7500 kms-1. The pixel scale on all INT images is 0.333′′ per pixel
and with both the LT and INT our exposure times were 800 sec in H and 300 sec in R (or r’,
for the remainder of this paper ‘-band’ will refer to both these filters, and the filter
that was used for each target galaxy is listed in Table A1).
These additional SNe and host galaxies
were chosen from the Padova-Asiago SN catalogue22
2
http://web.pd.astro.it/supern/,
as specific SN types were more complete for the listed SNe.
At a later date all SN type classifications taken from the Padova-Asiago catalogue
were checked through a thorough search of the literature and IAU circulars, as classifications
can often change after the initial discovery and therefore those in the catalogue may not be completely accurate.
The full list of SN types is given in Table A1, where references are given if classifications were changed from
those in the above catalogue. The main discrepancies were the classification of the so-called SN ‘impostors’
as SNIIn in the Padova-Asiago catalogue. These are transient objects that are believed to be the outbursts from very massive Luminous Blue Variable
stars (LBVs), which do not fully destroy the progenitor star and are therefore not classed as true SNe (e.g. van Dyk et al. 2000; Maund
et al. 2006).
Four such objects were found in our sample, and the results on these ‘impostors’ are presented and discussed separately
in the following sections.
Through the above telescope
time allocations we obtained data on host galaxies of a large fraction of the
discovered CC SNe that have been classified as IIP, IIL, IIb, IIn, Ib, and Ic, and were observable within the H filters of the two telescopes.
There are obvious biases within a set of data chosen in the above way. As we use
any discovered SNe for our sample, the various different biases in the different SN surveys
that discovered them mean that the galaxy/SN sample is by no means representative of the
overall SN populations. Bright, well studied galaxies will be over represented, as will brighter
SNe events that are more easily detectable. However, firstly we are not analysing the overall host
galaxy properties, but
are analysing where within the distribution of stellar populations of the host galaxy the SNe are occurring.
Secondly, the small number of SNe of each of the CC sub-types that have been discovered means that
no individual survey can currently manage to analyse the properties of their host galaxies
or parent stellar populations in any statistically significant way
(most statistical observational studies do not even
attempt to separate the Ib and Ic SN types). Taking our approach enables us to make statistical
constraints on all the major SN types. The results that are presented
in this paper are on the analysis of the parent stellar populations of 115 SNII, of which 35 are IIP,
6 IIL, 8 IIb and 12 IIn, 4 SN ‘impostors’, plus 22 Ib, 30 Ic and 6 that only have Ib/c as their classification, taken from
both the initial HGS sample and our additional data described above. The results for individual
SNe obtained from the following analysis are listed in Table A1, together with host galaxy characteristics.
For each SN host galaxy we obtained H+[Nii] narrow band imaging, plus R-band imaging.
Standard data reduction (flat-fields, bias subtraction etc) were
achieved through the automated pipeline of the LT (Steele
et al., 2004), and the
INT data were processed through the INT Wide Field Camera (WFC), Cambridge Astronomical Survey Unit (CASU)
reduction pipeline. Continuum subtraction
was then achieved by scaling the broad-band image fluxes to those of the H images using
stars matched on each image, and subtracting the broad-band images from the H images. Our reduction
made use of various Starlink packages.
3 Radial aperture analysis
To analyse where within the radial distribution of -band and H light SNe occurred, radial growth curves for
both were constructed for the host galaxy images. These were derived in the following way. For both the -band and H images all apertures were centred on the -band galaxy centroid positions. Galaxy parameters (semi-major and -minor axis sizes, plus position angles)
were taken from the NASA/IPAC
Extragalactic Database (NED)33
3
http://nedwww.ipac.caltech.edu/.
For face-on spiral and irregular galaxies circular
apertures were produced, while for inclined spirals elliptical apertures were produced using the ratio of the galaxy axes taken from NED.
These were then checked on each host
galaxy image by eye to ensure they were a good fit to the sample images. Concentric apertures were then produced
that increased in semi-major axis by 5′′ and sampled the galaxy light out to sky levels.
In general 20 to 100 apertures were
required to sample the full extent of the galaxy light. For those galaxies where less than 25 apertures were required (43 host galaxies)
concentric apertures that increased by 2.5′′ in semi-major axis were used so that a significant sampling of radial positions was
achieved.
These concentric apertures were then used to produce radial growth curves for each SN host galaxy by
calculating the flux within each ellipse of increasing size. This enables one to define the edge of the host galaxy at the point
where the curves flatten off as the aperture counts have reached sky levels.
The next step was to calculate the total flux within the aperture just
including the SN position.
This aperture was calculated using the SN coordinates relative to the galaxy centre, plus both
the position and inclination angles of the host galaxy (the value calculated is therefore the
semi-major axis of the ellipse that just includes the SN position, taking into account the projection along
the minor axis).
Using these apertures one can then calculate the fraction of the total galaxy -band light and H emission (Fr and FrH
as they will be referred to in the results) that is within the position of each SN.
This is achieved by measuring the flux within the SN-containing ellipse and dividing this by the measured flux within the
largest ellipse (i.e. the total galaxy flux).
In Figure 1 we show an example of this technique at work, where two -band images
of the SN host galaxy NGC 3627 are presented. The top image shows the position of the SNIIP 1973R and the aperture that just includes the
SN, while the bottom image has overlaid the aperture that contains all of the -band flux of the galaxy.
During this analysis it was found that there were some SNe where it was not possible to perform the
above procedure accurately. Some of the -band images were not used due to there being
too many bright stars in the field as it can be difficult to
remove stars from images without leaving residuals that may affect the results. This in general is not a
problem for the H images as stars are removed through the continuum subtraction applied. There
were also images where due to the size of the field of view of the detector used (mainly LT images), it was not
possible to apply the radial analysis out the full size of the host
galaxies and therefore these data were removed from the subsequent
analysis and results.


The method described above normalises the distributions to the host galaxy properties (overall
-band light and H emission fluxes). This enables an analysis of a sample of SNe that occur in a wide range
of galaxy morphologies and sizes, without the characteristics of those host galaxies affecting the overall distribution of
SN positions.
If one were to merely use absolute SN distance from its host galaxy centre (in say, kpc)
then there would be a systematic overabundance of SNe occurring at small radial positions as these
positions would be populated with SNe exploding in all host galaxies, while larger radial positions
would only be populated by SNe occurring in the largest host galaxies. This
normalisation also allows an investigation into whether the different SN types trace the
overall distributions of the two types of light within their host galaxies, as discussed in § 1.2.
If the SNe are equally likely to arise from any part of the H emission or -band light distributions then one would expect a mean fraction of 0.5
and the fractions of light to be evenly distributed throughout the radial light profiles (i.e. a flat distribution). This is the test
that is presented in the following section; whether the different SN types better trace the
radial distribution of the -band light or the H emission. It is also investigated whether there
are differences between the radial distributions of the different SN types and what
implications these may have for the nature of their progenitors.


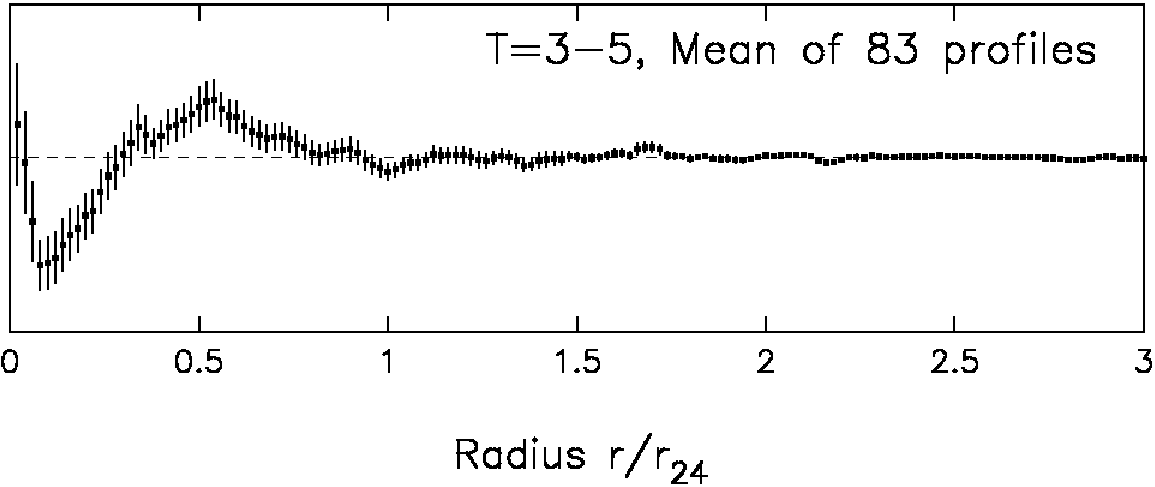
In Fig. 2 we show the normalised radial light profiles (flux in elliptical annuli), averaged over all of the T-types 3-5 galaxies (Sb, Sbc and Sc Hubble types, both barred and unbarred) within the HGS survey. This range of types is chosen to illustrate the typical light profiles for galaxies used in the present investigation, as they represent those galaxies that dominate the SF within the local Universe (James et al., 2008), and also dominate the morphological types within our sample (as shown in § 5.5). In the top panel we show the averaged H profile, in the middle panel we show the averaged -band profile, and finally in the bottom panel we show the difference between the two. In the final plot the central spike is possibly due to central SF or AGN in barred galaxies, while the negative values between r/r24 of 0.1 and 0.3 show the effect of the central bulge, where there is a deficit in the SF relative to the -band light. For a detailed discussion of the calculation of these profiles, and in particular the scaling of the input profiles by radius and total flux, see James et al. (2009).
4 Results
4.1 SNII
The mean fraction of -band light (Fr henceforth) within the positions of the 113 SNII is 0.566 (standard error on the mean of 0.022) while for the H emission (FrH henceforth) it is 0.572 (0.025). Histograms of these two distributions are shown in Figs. 3 and 4 respectively. Using a Kolmogorov Smirnov (KS) test there is only 0.1% chance that the SNII are drawn from the same radial distribution as the -band light and there seems to be a deficit at both small and large radii. Although the distribution of SNII compared to the H emission appears reasonably flat in Fig. 4, there is only a 5% chance that they follow radial distribution of the HII regions. This is due to the deficit of SNe at small radii which will be discussed in the next section. Results on the individual SNII sub-types will now be presented.


4.1.1 SNIIP
The Fr and FrH distributions for the SNIIP are shown in Figs. 5 and 6 respectively. Both of these distributions appear similar and are consistent with the SNIIP being drawn from the same population as both the -band and H emission (using a KS test), although there appears to be slightly more of a deficit at small and large radii for the SNe with respect to the -band light, as seen for the overall SNII population. The mean Fr is 0.511 (0.046) and the mean FrH is 0.522 (0.050). Both of these distributions are also consistent with being drawn from the same population as the overall SNII values.


4.1.2 Other SNII sub-types
In Table 1 we list the radial statistics for the SN types IIL, IIb, IIn and ‘impostors’. All these distributions are consistent with being drawn from the same parent population as the overall SNII. However, we note that all distributions are shifted to higher mean values than the SNII. The ‘impostors’ in particular seem to be located towards the outer parts of their host galaxies.
| SN type | N | M | H | M | |
|---|---|---|---|---|---|
| IIL | 6 | 0.520 | 0.074 | 0.561 | 0.101 |
| IIb | 8 | 0.581 | 0.106 | 0.577 | 0.116 |
| IIn | 12 | 0.591 | 0.060 | 0.580 | 0.089 |
| ‘impostors’ | 4 | 0.725 | 0.150 | 0.757 | 0.168 |
4.1.3 Comparison of SNIIP to other sub-types
For a comparison of the SNII sub-types with the individual SNIIP presented above, in Figs. 7 and 8 the distributions of the combined sample of the SNIIL, IIb and the IIn plus the four SN ‘impostors’ are presented. It is immediately clear that there is a large deficit of these non-IIP SNe at small radii compared to the SNIIP (see Figs. 5 and 6), an effect that seems more prominent in the -band. However, using a KS test both of the distributions are consistent with those of the SNIIP. The non-IIP SNe have a 3% chance of being drawn from the distribution of -band light (i.e. a flat distribution) while they are consistent with being drawn from the H emission distribution. The mean Fr for the 30 non-IIP SNe is 0.592 (0.040) and the mean FrH (only 29) is 0.600 (0.050)


4.2 SNIb/c
The radial distributions of the overall SNIb/c population with respect to the -band light and H emission are shown in Figs. 9 and 10 respectively (52 SNe in the -band histogram and 58 in the H plot). It is immediately clear that they are weighted to the central parts of the light distribution, especially when comparing them to the other SN types discussed above. This is also reflected in the mean values of their distributions; the mean Fr is 0.408 (0.041) and mean FrH is 0.405 (0.041). Comparing these distributions to that of the overall SNII population it is found that for both the -band and the H there is only 0.1% chance that the SNIb/c and SNII are drawn from the same radial distributions. Comparing the above samples to flat distributions it is found that there is only 2% chance that the SNIb/c are drawn from the same radial distribution as that of the SF while there is only 1% chance that they are drawn from the radial distribution of the -band light. Results on the SNIb and Ic will now be presented separately.


4.2.1 SNIb
The mean Fr for the 17 SNIb is 0.468 (0.088) and the mean FrH (22 SNe) is 0.465 (0.072) and histograms of the two distributions are presented in Figs. 11 and 12 respectively. These SNe are consistent with being drawn from the same radial distribution as that of the -band light and the H emission of their host galaxies. There is only a 2% (-band) and 7% (H) chance that the SNIb are drawn from the same radial distributions as the SNII.


4.2.2 SNIc
The Fr (29 SNe) and FrH (30) distributions for the SNIc are shown in Figs. 13 and 14 respectively. The mean Fr is 0.338 (0.047) and the mean FrH is 0.306 (0.047). The histograms show that both these distributions are strongly weighted to small light fractions; i.e. the central parts of the light distributions of host galaxies. This is are backed up by KS tests that show there is only 1% chance that the SNIc follow the same radial distributions as that of the -band light, while there is 1% chance that they follow the same radial distribution as the line emission. Comparing these distributions to those of the SNIb it is found that while when looking at their distributions (specifically comparing Figs. 12 and 14, and the mean FrH values) they seem to occur at different host galaxy radii (particularly with respect to the complete deficit of SNIc in the outer 20% of the band light distribution), statistically they are consistent with being drawn from the same parent distribution.
5 Discussion
5.1 Implications for progenitor metallicity
As discussed in § 1.2, radial position within galaxies can be used as a proxy for environment metallicity with galaxy centres tending to have higher metal content. Differences in the radial distributions of SN types can therefore be used to infer differences in progenitor metallicity. Comparing Fig. 9 to Fig. 3 it is immediately clear that the SNIb/c are more centrally concentrated than the SNII (a result also seen in van den Bergh 1997, and most recently Hakobyan 2008) implying higher metallicity progenitors. This trend is also backed up by the KS statistics presented above.

To further illustrate this point, in Fig. 15
the cumulative distributions of the radial positions of the main CC SN types (II, Ib and Ic) with respect to the
-band light are plotted (the -band light distribution is chosen to show this result as it will be a more
reliable indicator of integrated SF over the galaxy’s lifetime, and therefore metallicity, than the distribution of
H emission). Apart from a central deficit of SNII these SNe seem to follow the distribution of -band light while the SNIb
then the SNIc appear more centrally concentrated as their distributions are biased to smaller radii. This
plot implies that the SNIb/c tend to preferentially occur in
regions of higher metallicity than SNII. The arrow on the plot shows the implied direction
of increasing metallicity and one can see that a trend is observed going
from SNII to SNIb and finally SNIc arising from progenitors of the highest metallicity.
Stars
of higher metallicity tend to have stronger radiatively driven stellar winds (e.g. Puls et al. 1996; Kudritzki &
Puls 2000; Mokiem
et al. 2007).
As discussed in § 1.1 the spectral appearance of SNIb suggests that these SNe have lost their
hydrogen envelopes while SNIc spectra indicate that they have also lost their helium envelopes. The results presented above are therefore
consistent with progenitor metallicity playing a significant role in removing SN progenitor envelopes
and producing the different CC SNe that we see.
This metallicity dependence has also been seen in research looking at the host galaxy
properties of CC SNe. Prantzos &
Boissier (2003) looked at the relative rates of
SNII and SNIb/c as a function of host galaxy luminosity, using this as
a proxy for metallicity. They found that the ratio of SNII to SNIb/c
events strongly correlated with host luminosity in the sense
that relatively more SNIb/c were found in more luminous, i.e. more
metal rich environments. Prieto
et al. (2008) investigated the
metallicity of SDSS galaxies that had hosted CC SNe using spectra and came to similar
conclusions. While our results are consistent with these findings, they
would also suggest that the metallicity implications that these authors discuss
are underestimates of the true differences between progenitor
metallicity of SNIb/c and SNII (as Prieto
et al. 2008 point out). This is due to the fact that while SNIb/c seem to arise from
higher metallicity host galaxies, they are also more centrally concentrated,
and therefore within these host galaxies are likely to come from higher metallicity stellar populations than SNII as well.
These
different studies (including the current analysis) are also
consistent with the model predictions of single stellar models
(e.g. Heger et al. 2003, Eldridge &
Tout 2004),
that SNIb/c generally arise from more metal rich progenitors. One
point that we emphasise here is that these studies (and others), plus stellar models
tend to group SNIb and SNIc together when discussing
differences in progenitor characteristics. We find that when splitting
these SNe into their Ib and Ic classifications there appears to be a
trend in progenitor characteristics that we observe, implied from the results presented both
here and in AJ08.
This trend implies that SNIb tend to arise from higher mass and more metal rich
progenitors than SNII, while SNIc arise from still higher mass and
metallicity progenitors.
We note that while the statistics that we present here, plus
those from elsewhere suggest that on average SNIc
arise from metal rich stellar populations, a number of cases that do not fit this trend have
been observed. Examples of these can be found in Modjaz
et al. (2008)
and Prieto
et al. (2008). Therefore while
SNIc seem to favour high metallicity environments,
it seems that these events can arise from low metallicity progenitors.
5.2 Comparison of SN and stellar radial distributions
Although the overall SNII population follows the distribution of SF as indicated in Fig. 4 (as would be expected for SNe with massive progenitors),
there is a substantial deficit at small radii, a result that was also seen in JA06.
One may initially presume that this is due to the bulge
components of galaxies within their centres that are too old to produce SNII. However, this distribution is with respect
to the SF of the host galaxies and therefore there is a fraction of high mass SF (the central tenth of the emission) that
is not producing its share of SNII. One possible explanation is the decreasing efficiency of detecting SNe in the central
parts of galaxies due to either the high surface brightness of the stellar background (Shaw 1979) or
extinction effects which have been deduced to result in significant deficits in SN detection rates, even in
near-IR searches (Mannucci et al. 2003).
Another
explanation is that there is an additional emission-line component at the centres of galaxies that is not
related to SF and hence not linked to SNII. However, both of these explanations would then seem in contradiction
to the above findings that SNIb/c are more centrally concentrated than would be expected if they accurately traced
the emission, which is also seen with respect to
the -band light (see Figs. 9 and 10), as there seems
no reason why these effects would apply to the SNII but not the SNIb/c (although the possible effects of differences
in intrinsic SN brightness will be discussed below). If one then follows the above
arguments on radial positions being indicators of metallicity of stellar environment, this
then implies that there is some metallicity upper limit, above which SNII tend not to occur in significant
numbers. The stellar models of Eldridge &
Tout (2004) predict that the minimum initial mass for producing SNII
increases with metallicity. Therefore the increased metallicity in galaxy centres may be
expected to produce a smaller fraction of SNII than in the lower metallicity outer disk regions (although note that the models
of Heger et al. 2003, do not predict a change in the minimum initial mass).
Therefore the most plausible explanation for the above result
seems to be that there is some physical mechanism that favours the production of SNIb/c and also
limits the production of SNII in the centres of galaxies.
A remarkable feature of Fig. 13 is that 13 out of the 29 SNIc arise from the central 20% of the -band luminosity of these galaxies, which would generally be assumed to be dominated
by the passive, non-star forming bulge population.
5.3 The overall CC SN distribution and correlations with host galaxy star formation

In Fig. 16 we show the distributions of locations of all types of CC SNe combined, together
with the individual SNII distribution to show the relative contribution of the different SN types at different radii, with respect to the distribution
of host galaxy H emission.
This distribution is remarkably flat and consistent with the CC SNe being drawn from the same stellar population as that of the recent SF,
and the mean
FrH is 0.516 (0.023).
We can therefore conclude that
the H emission within galaxies accurately traces the CC SN progenitor parent stellar population, and this further
implies that both CC SNe and H emission are excellent tracers of SF within galaxies.
This plot
then implies that (as discussed above) the central deficit of SNII (and the central excess of SNIb/c) is due to higher metallicities resulting in relatively more SNIb/c than SNII,
while as one goes further out into the disk of galaxies the lower metallicities inhibit the production of SNIb/c relative to SNII.
Another explanation for the above results is that there are deviations from a ‘normal’ IMF as a function of radial
positions. Maness et al. (2007) investigated the properties of 329 late-type giant stars in the central parts of the Galaxy. They concluded that
these stars originated from a top-heavy IMF. If this applies to the current sample
then the above results can be explained by relatively more high mass stars being formed and hence fractionally more
progenitor stars exploding as SNIb/c than as SNII when compared to the outer parts of galaxies with standard IMF
stellar populations. However, this would not naturally produce the flat distribution seen in Fig. 16
(in fact, the higher fraction of high mass stars would give more central H emission per SN progenitor star).
It can be asked whether the
fraction of different events within the current sample is a true reflection of reality as the sample was
not chosen to be complete. However when the make up of the sample is compared to recent
local estimates of the relative SN rates (e.g. Smartt et al. 2009), good agreement is found (the
only real discrepancy is the additional numbers of the SNIIL, IIb and IIn at the expense of SNIIP).
The percentages of SNII and SNIb/c in the current sample are 66% and 34% respectively compared to the Smartt et al.
estimates of 71% and 29%.
The different CC SNe discussed above have different characteristic absolute magnitudes. This could therefore
affect their relative detections at different radial positions (e.g. there may be more extinction or a higher
stellar background in central regions). Richardson et al. (2002) used the Padova-Asiago SN catalogue to carry out a comparative study of SN
absolute magnitude distributions. They determined mean peak absolute magnitudes in the -band of –18.04 for SNIb/c, –17.00
for SNIIP, –18.03 for SNIIL and finally –19.15 for SNIIn. One may speculate that the fainter magnitudes of
SNIIP (the most abundant SNII sub-type) compared to the SNIb/c naturally explains the higher fraction of SNIb/c
in the centres of galaxies where there is likely to be higher extinction and a higher stellar background, preventing the detection of lower
luminosity events (however the SNIIP have a plateau phase in their light curves after maximum light meaning that they will
be detectable over a longer time period).
It is possible that these selection effects could affect the above results, however this effect would have to be quite severe and
it is interesting to note that there are no SNIIn (out of 12 in the current sample),
the brightest CC SNe according to Richardson et al. (2002), detected within the central 20% of the SF or the central 30% of the -band light.
It is stressed here that while there are many processes that may be at play in producing more or less of the different CC SNe at different radii, nearly all those discussed above would not produce a flat distribution as is seen in Fig. 16. The only interpretation of these results that naturally produces the extremely flat distribution observed, is that CC SNe are produced from a constant mass range of stars that have a non-changing IMF, and that the change in relative numbers of SNII and SNIb/c seen in the centres of galaxies is down to there being a substantial metallicity dependence of progenitors. Within the central 10% of the SF within host galaxies more SNIb/c than SNII have been produced within the current sample.
5.4 SNII sub-types
In § 4.1.3 the distributions of the SNIIP were compared to those of all the other SNII sub-types and the SN ‘impostors’ (the small number of SNe of each of the other sub-types meant that a statistical comparison of each individually was not viable). It can be seen that all the other sub-types tend to preferentially occur at larger radii with respect to both the -band light and the H emission (see Figs. 5, 6, 7 and 8 plus the mean values given for the various types in § 4). While there only seems a slight deficit in SNIIP at small radii with respect to the -band light, there is only one SN of the other types that has exploded within the inner 30% of the light (this difference is also seen with respect to the H emission, but to a lesser extent). Again if we regard these differences in terms of radial metallicity gradients within host galaxies then one comes to the conclusion that SNIIP arise from more metal rich progenitors than the other sub-types. However, the spectra of the SNII sub-types indicate that their progenitors can be sorted into a sequence of increasing pre-SN stellar mass-loss going from SNIIP to IIL, IIb and finally IIn (Chevalier 2006). Therefore if there was a metallicity dependence on producing the SNIIP compared to the other sub-types one would presume that in fact SNIIP would be found in less metal rich environments than those of the SNIIL, IIb, IIn and SN ‘impostors’ (higher metallicity progenitors are likely to have stronger stellar winds). Theory also predicts that SNIIL and IIb will only be produced above some limiting metallicity (Heger et al. 2003). While these differences between SNII sub-type environments are not statistically significant, it is clear that there is some process that is preventing SNIIL, IIb, IIn and SN ‘impostors’ from being detected or occurring within the central parts of galaxies. The selection effects that may be at play to reduce the detections of these events in the central regions of galaxies were discussed in the previous section, and while these may seem valid by themselves the detection of large numbers of SNIb/c in the same central regions again makes these explanations unsatisfactory. The most plausible explanation seems therefore to be that there is some higher metallicity limit that inhibits the production of these SNe.
5.5 Morphological classifications of SN host galaxies
One may question whether there are intrinsic differences between the host galaxies of the different SN types that may influence our
results. To investigate this possibility morphological classifications were taken from the Padova-Asiago SN catalogue
for each SN host galaxy in the current sample. There were 9 galaxies within our sample for which classifications were not available. For these we
used our own -band imaging to assign morphological types. All host galaxy classifications were then changed to T-type classifications following the
prescription in de
Vaucouleurs (1959). The sample was then split into SNII, SNIb and SNIc host galaxies. Mean T-types were
found of; 4.60 (standard error on the mean of 0.18) for the SNII, 4.73 (0.39) for SNIb and 4.45 (0.37) for SNIc, and
using a KS test it was found that all three galaxy distributions were consistent with being drawn from the same parent population.
It therefore seems that there are no significant differences in host galaxy characteristics that could strongly
bias the results presented above. It is interesting to note that the distribution of T-type classifications for the galaxies in the current sample
peaks between Sbc and Sc galaxies, consistent with the findings of
James et al. (2008), that the SFR in the local universe is concentrated
within these galaxy types.
5.6 The radial distribution of SNe with respect to host galaxy D25 and the nature of galaxy metallicity gradients
The analysis above was based on fractions of total galaxy fluxes lying within SN locations.
However, metallicity gradients in galaxies are usually quoted as logarithmic
changes over a radial range normalised to an isophotal galaxy size, e.g. dex per (r/D25).
Therefore, here we present a further analysis using r/D25 in place of fractional luminosity.
We do this to a) check the robustness of the above results and discussion, and b) to make some quantitative
statements on the differences in metallicity of the host stellar environments of CC SNe.
For the complete SN and host galaxy sample discussed above we used the radius of the semi-major axis (in arcsec) of the aperture that just
includes the SN position (calculated in § 3) and normalise this by dividing by the D25 semi-major axis
of the host galaxy taken from NED, giving a value
of r/D25. The distribution of these values for the SNII, SNIb and SNIc populations is shown in Fig. 17.

This plot shows qualitatively the same results as shown in the histograms presented in
§ 4 and the cumulative distribution plot shown in Fig. 15.
The SNIc are the most centrally concentrated distribution, followed by the SNIb and the SNII,
implying, as above, a decreasing sequence of progenitor metallicity.
The mean r/D25 for the SNIc is 0.149 (standard error on the mean of 0.024), 0.244 (0.032) for the SNIb and 0.295 (0.020) for the
SNII distribution. Using KS tests we find that there is less than 0.1% probability that the SNIc are drawn from the same radial distribution as that of the
SNII, while the SNIb are consistent with arising from the same parent distribution as that of the SNII. There is a 7.7% chance that the SNIb and SNIc
distributions arise from the same parent population.
Henry &
Worthey (1999) published metallicity gradients for a range of galaxy types. They found a mean metallicity gradient within galaxies
of [O/H]= –1.0(r/D25) (a value also observed by Prantzos &
Boissier 2000). Using this gradient together with the differences between the mean values
of r/D25 presented above we estimate that the mean metallicity difference between the stellar environments of SNIc and
SNII is roughly 0.15 dex, i.e. that SNIc arise from progenitors with
metal abundances a factor of 1.4 higher on average than those of SNII.
The above analysis shows that there are real differences in the
radial positions of the different CC SN types. However, it is not clear whether the
metallicity differences that we derive can alone produce the differences in the relative rates of SNIc and SNII
that we find between galaxy centres and out in the disc, and therefore other factors must be at play.
As discussed earlier, studies investigating the
global host galaxy properties (Prantzos &
Boissier, 2003; Prieto
et al., 2008) have concluded that
SNIb/c are generally found in higher metallicity galaxies than SNII. We therefore investigated this in
the current sample. Host galaxy absolute -band magnitudes were calculated using galaxy
photometry and distances taken from NED. Surprisingly we do not recover the differences in host galaxy
magnitude between the SNIb/c and SNII published by Prantzos &
Boissier, and all host galaxy magnitude distributions are
statistically the same. It is not clear what is the cause of this discrepancy because, as shown
above the host galaxy morphologies in our sample are typical for SF galaxies and therefore one would assume typical
for the Prantzos &
Boissier sample, which was drawn from the Padova-Asiago SN catalogue. One possibility is that
the current sample is too small to observe differences in the host galaxy magnitudes (and we also note the size of the error bars in their analysis).
We also note that in interpreting these results, it should be borne in mind that many SNe are detected
in searches targeted on bright galaxies, which may somewhat affect the metallicity effects between galaxies, although any effect can only be small.
While Prantzos &
Boissier used host galaxy magnitude as a proxy for galaxy metallicity, Prieto
et al. (2008) obtained host galaxy
metallicities derived from spectra of the host galaxies and again found that SNIb/c were typically found in more metal rich galaxies than SNII.
Therefore it seems likely that SNIb/c arise from both more metal rich galaxies and, as found
in the current study more metal rich environments within those galaxies.
However, we concur with the conclusion of Prieto
et al., that metallicities should be
directly derived at the SN locations, and we have such a project underway (see also Modjaz
et al. 2008, for a similar
study).
5.7 Implications for progenitor metallicity or mass?
In this paper we have generally assumed that
the increased centralisation of a SN distribution implies increased
progenitor metallicity. Recently Kelly
et al. (2008) presented statistics on the association of
SNe to the g′-band light of their host galaxies (using a similar fractional flux technique
as that presented in AJ08), which has been modeled by Raskin et al. (2008) to derive initial
progenitor mass estimates.
This work showed that SNIc are concentrated towards
the brightest parts of their host galaxies while the SNIb and SNII populations followed
the distribution of g′-band light. These authors then argue that the
brightest regions of galaxies are likely to correspond to the largest SF regions,
where the most massive stars are formed, a plausible argument given that SF results in local enhancement of g′-band
luminosity. Using this assumption they conclude that SNIc arise from higher mass progenitors than SNII and SNIb.
However, this interpretation is ambiguous, since
g′-band brightness can be enhanced from other causes, and in particular shows a systematic trend with radius, and
hence plausibly with metallicity, which complicates the interpretation of their result.
Our method, presented in AJ08 and the current paper, attempts to disentangle effects due to progenitor mass/age
and those due to metallicity. The correlations of AJ08 make use of the continuum-subtracted H surface brightness,
which explicitly traces only the young stellar population, independently of radial position and local metallicity.
The present paper demonstrates that, within that very young stellar population, the part laying closest
to the galaxy centres tends to produce large numbers of SNIc, and fewer SNII. These radial changes we
attribute to metallicity effects.
5.8 Progenitor binarity
One major point of discussion that we have up to this point ignored is the possibility that a large fraction of CC SN progenitors (in particular the SNIb/c) may arise from binary systems. As discussed earlier the relative ratio of SNIb/c to SNII when compared with predictions from single star models and observations of massive stars in the local group (Massey 2003, Crowther 2007), would seem to suggest that the production of a significant fraction of SNIb/c from binaries is required. While a detailed discussion of CC SN production through binaries and how this may be affected by environment is beyond the scope of this paper, here we briefly summarise the points that may be relevant to the current work. As with single stars, theory in general predicts that the production of SNIb/c from binaries should increase with increasing progenitor metallicity (see Fryer et al. 2007 and Eldridge et al. 2008, although also see Izzard et al. 2004 for differing predictions). If correct, the higher degree of centralisation of SNIb/c (and in particular SNIc), can be explained again in terms of increasing metallicity, which increases the relative production of these SNe through both single and binary progenitor scenarios. We also note that Eldridge et al. (2008) have shown that the observed trends of the ratio of SNII to SNIb/c with metallicity (they use the SN host galaxy luminosity observations of Prantzos & Boissier 2003) are most convincingly reproduced from binary model predictions. Therefore, while in general we have discussed our results in terms of single star SN progenitors, it seems that the implications of our results are also compatible with current thinking on SN production from binary channels, and further work is needed in order to further constrain the fraction of events produced by the different progenitor scenarios.
6 Conclusions
We have presented results and discussion on the radial distribution of CC SNe with respect to both old stellar populations as traced by the -band continuum light and young stellar populations as traced by the H emission within host galaxies. We find that the distribution of the overall CC SN population closely follows the distribution of H line emission, implying that both are accurate tracers of SF within galaxies. Within this correlation we find that the ratio of SNII to SNIb/c is strongly correlated with galactocentric radial position, with the SNIb/c (in particular the SNIc) dominating the CC SN production within the central parts of the host galaxies’ SF while as one moves out into the disk the SNII become more dominant. This implies a strong metallicity dependence on the relative production of these SN types from massive star progenitors. We now list our main conclusions that arise from this work:
-
The radial distribution of CC SNe closely follows the radial distribution of H emission within galaxies with a central deficit in the number of SNII offset by a central excess of SNIb/c. This implies that both CC SNe and H emission are excellent tracers of SF within galaxies
-
SNIb/c are observed to occur within more central positions of host galaxies than SNII implying that they arise from more metal rich progenitors. This confirms and strengthens the results of van den Bergh (1997), Tsvetkov et al. (2004) and Hakobyan (2008)
-
SNIc are seen to be the most centrally concentrated of all CC SN types with many SNe occurring within the central 20% of the host galaxy light and none found to occur in the outer 20% . This implies that the majority of SNIc occur within metal rich environments
-
SNIb are found to trace the host galaxy light and line emission more accurately than the SNIc while still being more centrally concentrated than the SNII, implying a progenitor metallicity sequence going through SNII, SNIb and SNIc, with the latter arising from the highest metallicity progenitors
-
SNIIP are found to be more centrally concentrated than the other SNII sub-types implying that SNe of types SNIIL, IIb, and IIn generally arise from less metal rich progenitors than SNIIP, in apparent contradiction to theoretical predictions
Acknowledgments
We thank the anonymous referee for their constructive comments. We also thank Stephen Smartt and Mike Bode for useful discussion, and Mike Irwin for processing the INT data through the CASU WFC automated reduction pipeline. This research has made use of the NASA/IPAC Extragalactic Database (NED) which is operated by the Jet Propulsion Laboratory, California Institute of Technology, under contract with the National Aeronautics and Space Administration.
References
- Anderson & James (2008) Anderson J. P., James P. A., 2008, MNRAS, 390, 1527
- Barbon et al. (1979) Barbon R., Ciatti F., Rosino L., 1979, A&A, 72, 287
- Bartunov et al. (1992) Bartunov O. S., Makarova I. N., Tsvetkov D. I., 1992, A&A, 264, 428
- Burket et al. (2005) Burket J., Pugh H., Li W., Puckett T., Cox L., 2005, IAUC CBET, 8504, 2
- Chevalier (2006) Chevalier R. A., 2006, ArXiv Astrophysics e-prints
- Chugai & Danziger (1994) Chugai N. N., Danziger I. J., 1994, MNRAS, 268, 173
- Crowther (2007) Crowther P. A., 2007, ARA&A, 45, 177
- de Vaucouleurs (1959) de Vaucouleurs G., 1959, Handbuch der Physik, 53, 275
- Eldridge et al. (2008) Eldridge J. J., Izzard R. G., Tout C. A., 2008, MNRAS, 384, 1109
- Eldridge & Tout (2004) Eldridge J. J., Tout C. A., 2004, MNRAS, 353, 87
- Filippenko (1993) Filippenko A. V., 1993, in Bulletin of the American Astronomical Society Vol. 25 of Bulletin of the American Astronomical Society, The Spectroscopic and Photometric Evolution of Type II Supernovae. pp 819–+
- Filippenko (1997) Filippenko A. V., 1997, ARA&A, 35, 309
- Filippenko et al. (1993) Filippenko A. V., Matheson T., Ho L. C., 1993, ApJ Let., 415, L103+
- Fryer et al. (2007) Fryer C. L., et al., 2007, PASP, 119, 1211
- Ganeshalingam et al. (2003) Ganeshalingam M., Graham J., Pugh H., Li W., 2003, IAUC CBET, 8134, 1
- Gaskell et al. (1986) Gaskell C. M., Cappellaro E., Dinerstein H. L., Garnett D. R., Harkness R. P., Wheeler J. C., 1986, ApJ Let., 306, L77
- Goodrich et al. (1989) Goodrich R. W., Stringfellow G. S., Penrod G. D., Filippenko A. V., 1989, ApJ, 342, 908
- Graham et al. (2005) Graham J., Li W., Schwartz M., Trondal O., 2005, IAUC CBET, 8465, 1
- Hakobyan (2008) Hakobyan A. A., 2008, Astrophysics, 51, 69
- Hamuy (2003) Hamuy M., 2003, ApJ, 582, 905
- Heger et al. (2003) Heger A., Fryer C. L., Woosley S. E., Langer N., Hartmann D. H., 2003, ApJ, 591, 288
- Hendry et al. (2006) Hendry M. A., et al., 2006, MNRAS, 369, 1303
- Henry & Worthey (1999) Henry R. B. C., Worthey G., 1999, PASP, 111, 919
- Izzard et al. (2004) Izzard R. G., Ramirez-Ruiz E., Tout C. A., 2004, MNRAS, 348, 1215
- James & Anderson (2006) James P. A., Anderson J. P., 2006, A&A, 453, 57
- James et al. (2009) James P. A., Bretherton C. F., Knapen J. H., 2009, ArXiv e-prints
- James et al. (2004) James P. A., et al., 2004, A&A, 414, 23
- James et al. (2008) James P. A., Knapen J. H., Shane N. S., Baldry I. K., de Jong R. S., 2008, A&A, 482, 507
- Kelly et al. (2008) Kelly P. L., Kirshner R. P., Pahre M., 2008, ApJ, 687, 1201
- Kudritzki & Puls (2000) Kudritzki R.-P., Puls J., 2000, ARA&A, 38, 613
- Maness et al. (2007) Maness H., Martins F., Trippe S., Genzel R., Graham J. R., Sheehy C., Salaris M., Gillessen S., Alexander T., Paumard T., Ott T., Abuter R., Eisenhauer F., 2007, ApJ, 669, 1024
- Mannucci et al. (2003) Mannucci F., Maiolino R., Cresci G., Della Valle M., Vanzi L., Ghinassi F., Ivanov V. D., Nagar N. M., Alonso-Herrero A., 2003, A&A, 401, 519
- Massey (2003) Massey P., 2003, ARA&A, 41, 15
- Matheson & Calkins (2001) Matheson T., Calkins M., 2001, IAUC CBET, 7597, 3
- Matheson et al. (2001) Matheson T., Jha S., Challis P., Kirshner R., Berlind P., 2001, IAUC CBET, 7756, 4
- Maund et al. (2006) Maund J. R., et al., 2006, MNRAS, 369, 390
- Maund et al. (2004) Maund J. R., Smartt S. J., Kudritzki R. P., Podsiadlowski P., Gilmore G. F., 2004, Nature, 427, 129
- Mazzali et al. (2004) Mazzali P. A., Deng J., Maeda K., Nomoto K., Filippenko A. V., Matheson T., 2004, ApJ, 614, 858
- Modjaz et al. (2008) Modjaz M., Kewley L., Kirshner R. P., Stanek K. Z., Challis P., Garnavich P. M., Greene J. E., Kelly P. L., Prieto J. L., 2008, AJ, 135, 1136
- Mokiem et al. (2007) Mokiem M. R., et al., 2007, A&A, 473, 603
- Nomoto et al. (1993) Nomoto K., Suzuki T., Shigeyama T., Kumagai S., Yamaoka H., Saio H., 1993, Nature, 364, 507
- Pastorello et al. (2004) Pastorello A., et al., 2004, MNRAS, 347, 74
- Podsiadlowski et al. (1993) Podsiadlowski P., Hsu J. J. L., Joss P. C., Ross R. R., 1993, Nature, 364, 509
- Podsiadlowski et al. (1990) Podsiadlowski P., Joss P. C., Rappaport S., 1990, A&A, 227, L9
- Prantzos & Boissier (2000) Prantzos N., Boissier S., 2000, MNRAS, 313, 338
- Prantzos & Boissier (2003) Prantzos N., Boissier S., 2003, A&A, 406, 259
- Prieto et al. (2008) Prieto J. L., Stanek K. Z., Beacom J. F., 2008, ApJ, 673, 999
- Pugh et al. (2004) Pugh H., Li W., Manzini F., Behrend R., 2004, IAUC CBET, 8452, 2
- Puls et al. (1996) Puls J., et al., 1996, A&A, 305, 171
- Raskin et al. (2008) Raskin C., Scannapieco E., Rhoads J., Della Valle M., 2008, ApJ, 689, 358
- Richardson et al. (2002) Richardson D., Branch D., Casebeer D., Millard J., Thomas R. C., Baron E., 2002, AJ, 123, 745
- Schlegel (1990) Schlegel E. M., 1990, MNRAS, 244, 269
- Shaw (1979) Shaw R. L., 1979, A&A, 76, 188
- Smartt et al. (2009) Smartt S. J., Eldridge J. J., Crockett R. M., Maund J. R., 2009, MNRAS, 395, 1409
- Steele et al. (2004) Steele I. A., et al., 2004, in Oschmann Jr. J. M., ed., Ground-based Telescopes. Edited by Oschmann, Jacobus M., Jr. Proceedings of the SPIE, Volume 5489, pp. 679-692 (2004). Vol. 5489 of Presented at the Society of Photo-Optical Instrumentation Engineers (SPIE) Conference, The Liverpool Telescope: performance and first results. pp 679–692
- Tsvetkov (1994) Tsvetkov D. Y., 1994, Astronomy Letters, 20, 374
- Tsvetkov et al. (2004) Tsvetkov D. Y., Pavlyuk N. N., Bartunov O. S., 2004, Astronomy Letters, 30, 729
- van den Bergh (1997) van den Bergh S., 1997, AJ, 113, 197
- van Dyk (1992) van Dyk S. D., 1992, AJ, 103, 1788
- van Dyk et al. (2005) van Dyk S. D., Filippenko A. V., Chornock R., Li W., Challis P. M., 2005, PASP, 117, 553
- van Dyk et al. (2000) van Dyk S. D., Peng C. Y., King J. Y., Filippenko A. V., Treffers R. R., Li W., Richmond M. W., 2000, PASP, 112, 1532
- Williams et al. (2009) Williams K. A., Bolte M., Koester D., 2009, ApJ, 693, 355
Appendix A SN and host galaxy data
Table A1. Data for all SNe and host galaxies SN SN type Host galaxy Galaxy type V (kms-1) Fr FrH Filter Reference 1921B II NGC 3184 SABcd 592 0.856 0.954 1926A IIL NGC 4303 SABbc 1566 0.607 0.736 1937F IIP NGC 3184 SABcd 592 0.808 0.930 1940B IIP NGC 4725 SABab 1206 0.675 0.802 1941A IIL NGC 4559 SABcd 816 0.208 0.131 1941C II NGC 4136 SABc 609 0.880 0.882 1954A Ib NGC 4214 IABm 291 0.968 0.992 1954C II NGC 5879 SAbc 772 0.615 0.511 1961I II NGC 4303 SABbc 1566 0.697 0.877 1961V ‘impostor∗’ NGC 1058 SAc 518 0.968 0.931 Goodrich et al. (1989) 1962L Ic NGC 1035 SAc 1208 0.754 0.518 r’ 1964A II NGC 3631 SAc 1156 0.915 0.992 1964F II NGC 4303 SABbc 1566 0.189 0.106 1964H II NGC 7292 IBm 986 0.551 0.719 1965H IIP NGC 4666 SABc 1529 0.324 0.198 r’ 1965L IIP NGC 3631 SAc 1156 0.622 0.658 1965N IIP NGC 3074 SABc 5144 0.110 0.059 1966B IIL NGC 4688 SBcd 986 0.571 0.454 r’ 1966J Ib NGC 3198 SBc 663 0.898 0.936 1967H II∗ NGC 4254 SAc 2407 0.664 0.648 van Dyk (1992) 1968V II NGC 2276 SABc 2410 0.699 0.790 1969B IIP NGC 3556 SBcd 699 0.197 0.494 1969L IIP NGC 1058 SAc 518 1.000 1.000 1971K IIP NGC 3811 SBcd 3105 0.809 0.900 1971S IIP NGC 493 SABcd 2338 0.605 0.570 1972Q IIP NGC 4254 SAc 2407 0.811 0.791 1972R Ib NGC 2841 SAb 638 0.855 0.904 1973R IIP NGC 3627 SABb 727 0.471 0.566 1975T IIP NGC 3756 SABbc 1318 0.846 0.856 1982F IIP NGC 4490 SBd 565 0.277 0.202 1983I Ic NGC 4051 SABbc 700 0.498 0.473 1984E IIL NGC 3169 SAa 1238 0.684 0.731 1985F Ib∗ NGC 4618 SBm 544 0.121 0.087 r’ Gaskell et al. (1986) 1985G IIP NGC 4451 Sbc 864 0.138 0.212 1985L IIL NGC 5033 SAc 875 0.585 0.571 1986I IIP NGC 4254 SAc 2407 0.334 0.318 1987F IIn NGC 4615 Scd 4716 0.489 0.333 1987K IIb NGC 4651 SAc 805 0.409 0.303 1987M Ic NGC 2715 SABc 1339 0.129 0.044 1988L Ib NGC 5480 SAc 1856 0.230 0.369 r’ 1989C IIP UGC 5249 SBd 1874 0.017 0.058 r’ 1990E IIP NGC 1035 SAc 1241 0.272 0.363 r’ 1990H IIP∗ NGC 3294 SAc 1586 0.156 0.125 Filippenko (1993) 1990U Ic NGC 7479 SBc 2381 0.603 0.488 1991A Ic IC 2973 SBd 3210 0.742 0.588 1991G IIP NGC 4088 SABbc 757 0.466 0.453 1991N Ic NGC 3310 SABbc 993 0.268 0.277 1992C II NGC 3367 SBc 3040 0.689 0.687 1993G IIL∗ NGC 3690 Double 3121 0.464 0.744 Tsvetkov (1994) 1993X II NGC 2276 SABc 2410 0.899 0.619 1994I Ic NGC 5194 SAbc 463 0.122 1994Y IIn NGC 5371 SABbc 2558 0.355 0.212 1994ak IIn NGC 2782 SABa 2543 0.725 0.977 r’ 1995F Ic NGC 2726 SABc 2410 0.037 0.050 1995N IIn MCG -02-38-17 IBm 1856 0.612 0.822 r’ 1995V II NGC 1087 SABc 1517 0.368 0.497 1995ag II UGC 11861 SABdm 1481 0.343 0.170 1996ae IIn NGC 5775 Sb 1681 0.757 0.671 1996ak II NGC 5021 SBb 8487 0.619 0.659 1996aq Ic NGC 5584 SABcd 1638 0.178 0.086 r’ 1996bu IIn NGC 3631 SAc 1156 0.923 0.993 1996cc II NGC 5673 SBc 2082 0.924 0.934 1997X Ic NGC 4691 SB0/a 1110 0.171 0.472 1997bs ‘impostor∗’ NGC 3627 SABb 727 0.362 0.348 van Dyk et al. (2000)
Table A1. Data for all SNe and host galaxies SN SN type Host galaxy Galaxy type V (kms-1) Fr FrH Reference 1997db II UGC 11861 SABdm 1481 0.633 0.396 1997dn II NGC 3451 Sd 1334 0.872 0.946 1997dq Ic∗ NGC 3810 SAc 993 0.774 0.734 Mazzali et al. (2004) 1997eg IIn NGC 5012 SABc 2619 0.503 0.449 1997ei Ic NGC 3963 SABbc 3188 0.197 0.053 1998C II UGC 3825 SABbc 8281 0.544 0.377 1998T Ib NGC 3690 Double 3121 0.056 0.056 1998Y II NGC 2415 Im 3784 0.612 0.720 1999D II NGC 3690 Double 3121 0.560 0.849 1999br IIP∗ NGC 4900 SBc 960 0.786 0.932 Hamuy (2003) 1999bu Ic NGC 3786 SABa 2678 0.180 0.522 1999bw ‘impostor∗’ NGC 3198 SBc 663 0.745 0.755 van Dyk et al. (2005) 1999dn Ib NGC 3451 Sd 2798 0.872 0.946 1999ec Ib NGC 2207 SABbc 2741 0.521 1999el IIn NGC 6951 SABbc 1424 0.320 0.259 1999em IIP NGC 1637 SABc 717 0.276 0.268 r’ 1999gb IIn NGC 2532 SABc 5260 0.485 0.443 1999gi IIP NGC 3184 SABcd 592 0.276 0.112 1999gn IIP∗ NGC 4303 SABbc 1566 0.418 0.429 Pastorello et al. (2004) 2000C Ic NGC 2415 Im 3784 0.706 0.820 2000cr Ic NGC 5395 SAb 3491 0.538 0.549 2000db II NGC 3949 SAbc 800 0.364 0.253 2000de Ib NGC 4384 Sa 2513 0.087 0.140 2000ew Ic NGC 3810 SAc 993 0.261 0.147 2001B Ib IC 391 SAc 1556 0.062 0.060 2001M Ic NGC 3240 SABb 3550 0.323 0.251 2001X IIP NGC 5921 SBbc 1480 0.579 0.369 2001aa II UGC 10888 SBb 6149 0.830 0.796 2001ac ‘impostor∗’ NGC 3504 SABab 1534 0.826 0.992 Matheson & Calkins (2001) 2001ai Ic NGC 5278 SAb 7541 0.323 0.256 2001co Ib/c NGC 5559 SBb 5166 0.618 0.497 2001ef Ic IC 381 SABbc 2476 0.082 0.052 2001ej Ib UGC 3829 Sb 4031 0.152 0.391 2001fv IIP∗ NGC 3512 SABc 1376 0.669 0.689 Matheson et al. (2001) 2001gd IIb NGC 5033 SAc 875 0.692 0.675 2001is Ib NGC 1961 SABc 3934 0.749 2002A IIn UGC 3804 Scd 2887 0.419 0.253 2002bu IIn NGC 4242 SABdm 506 0.896 0.930 2002ce II NGC 2604 SBcd 2078 0.381 0.560 2002cg Ic UGC 10415 SABb 9574 0.151 0.092 2002cp Ib/c NGC 3074 SABc 5144 0.936 0.961 2002cw Ib NGC 6700 SBc 4588 0.642 2002dw II UGC 11376 Sbc 6528 0.431 0.644 2002ed IIP NGC 5468 SABcd 2842 0.811 0.791 2002ei IIP MCG -01-09-24 Sab 2319 0.195 0.195 r’ 2002gd II NGC 7537 SAbc 2674 0.759 0.685 2002hn Ic NGC 2532 SABc 48 0.023 0.011 2002ho Ic NGC 4210 SBb 2732 0.146 0.051 2002ji Ib/c NGC 3655 SAc 1473 0.709 0.957 2002jz Ic UGC 2984 SBdm 1543 0.091 0.099 2003H Ib NGC 2207 SABbc 2741 0.259 2003T II UGC 4864 SAab 8368 0.682 0.643 2003Z IIP∗ NGC 2742 SAc 1289 0.675 0.736 Pastorello et al. (2004) 2003ab II UGC 4930 Scd 8750 0.559 0.454 2003ao IIP NGC 2993 Sa 2430 0.456 0.784 r’ 2003at II MCG +11-20-33 Sbc 7195 0.732 0.871 2003bp Ib NGC 2596 Sb 5938 0.486 0.362 2003db II MCG +05-23-21 Sc 8113 0.603 0.603 2003ed IIb NGC 5303 Pec 1419 0.369 0.298 r’ 2003ef II∗ NGC 4708 SAab 4166 0.335 0.352 Ganeshalingam et al. (2003) 2003el Ic NGC 5000 SBbc 5608 0.482 0.476 2003hp Ic UGC 10942 SBbc 6378 0.660 0.742 2003hr II NGC 2551 SA0/a 2344 0.914 1.000 2003ie II NGC 4051 SABbc 700 0.838 0.885
Table A1. Data for all SNe and host galaxies SN SN type Host galaxy Galaxy type V (kms-1) Fr FrH Reference 2003ig Ic UGC 2971 Sbc 5881 0.176 0.108 2004A IIP∗ NGC 6207 SAc 852 0.729 0.660 Hendry et al. (2006) 2004C Ic NGC 3683 SBc 1716 0.532 0.545 2004D II UGC 6916 SBbc 6182 0.457 0.336 2004G II NGC 5668 SAd 1582 0.657 0.595 2004T II UGC 6038 Sb 6446 0.507 0.260 2004Z II MCG +10-19-85 SB0/a 6933 0.548 0.333 2004ak II UGC 4436 Sbc 1124 0.887 0.882 2004ao Ib UGC 10862 SBc 1691 0.215 2004au II MCG +04-42-2 Sb 7800 0.330 0.446 2004bi IIb UGC 5894 Sab 6537 0.875 0.846 2004bm Ic NGC 3437 SABc 1283 0.073 0.076 2004bn II NGC 3441 Sbc 6554 0.509 0.491 2004bs Ib NGC 3323 SBc 5164 0.191 0.119 2004dk Ib NGC 6118 SAcd 1573 0.673 0.626 2004dg IIP∗ NGC 5806 SABb 1359 0.484 0.378 S. Smartt (2008, priv comm) 2004eb II NGC 6387 Pec 8499 0.413 0.540 2004ed II NGC 6786 SBc 7500 0.550 0.624 2004ep II IC 2152 SABab 1875 0.461 0.560 r’ 2004es II UGC 3825 SABbc 8281 0.974 0.904 2004ez IIP NGC 3430 SABc 1586 0.788 0.833 r’ 2004gj IIb IC 701 SBdm 6142 0.674 0.652 2004gq Ib NGC 1832 SBbc 1939 0.672 0.328 r’ 2004gr II∗ NGC 3678 Sbc 7210 0.553 0.570 Pugh et al. (2004) 2004gt Ib/c NGC 4038 SBm 1642 0.834 0.991 r’ 2005D IIb∗ UGC 3856 Scd 8505 0.999 0.981 Graham et al. (2005) 2005K II NGC 2923 S0/a 6538 0.743 0.784 2005O Ib NGC 3340 SBbc 5558 0.322 0.305 2005V Ib/c NGC 2146 SBab 893 0.033 0.091 2005ad IIP NGC 941 Sc 1608 0.831 0.864 S. Smartt (2008, priv comm) 2005az Ic∗ NGC 4961 SBcd 2535 0.426 r’ Burket et al. (2005) 2005ci II NGC 5682 SBb 2273 0.204 0.191 r’ 2005cs IIP NGC 5194 SAbc 463 0.222 2005dl II NGC 2276 SBc 2410 0.247 0.099 2005dp II NGC 5630 Sdm 2655 0.534 0.590 r’ 2005ip II NGC 2906 Scd 2140 0.399 0.528 r’ 2005kk II NGC 3323 SBc 5164 0.766 0.875 r’ 2005kl Ic NGC 4369 SAa 1045 0.271 0.540 r’ 2005lr Ic ESO 492-G2 Sb 2590 0.005 r’ 2006T IIb NGC 3054 SABbc 2426 0.302 r’ 2006am IIn NGC 5630 Sdm 2655 0.604 0.617 r’ 2006gi Ib NGC 3147 SAbc 2820 0.984 0.991 r’ 2006jc Ib/c UGC 4904 SB 1670 0.332 0.525 r’ 2006ov IIP NGC 4303 SABbc 1566 0.418 0.429 2007C Ib NGC 4981 SABbc 1680 0.320 0.236 2007am II NGC 3367 SBc 3040 0.302 0.314 r’ 2007fp II NGC 3340 SBbc 5558 0.170 0.125 r’ 2008ax IIb NGC 4490 SBd 565 0.328 0.284