Diamagnetism and Cooper pairing above in cuprates
Abstract
In the cuprate superconductors, Nernst and torque magnetization experiments have provided evidence that the disappearance of the Meissner effect at is caused by the loss of long-range phase coherence, rather than the vanishing of the pair condensate. Here we report a series of torque magnetization measurements on single crystals of (LSCO), (Bi 2201), (Bi 2212) and optimal . Some of the measurements were taken to fields as high as 45 T. Focusing on the magnetization above , we show that the diamagnetic term appears at an onset temperature high above . We construct the phase diagram of both LSCO and Bi 2201 and show that agrees with the onset temperature of the vortex Nernst signal . Our results provide thermodynamic evidence against a recent proposal that the high-temperature Nernst signal in LSCO arises from a quasiparticle contribution in a charge-ordered state.
pacs
74.25.Dw, 74.25.Ha, 74.72.HsI Introduction
A series of experiments utilizing the Nernst Effect [1, 2, 3, 4, 5] has demonstrated that an enhanced Nernst signal is observed in hole-doped cuprates at temperatures significantly above the superconducting transition temperature . The high- Nernst region was identified as a continuous extension of the vortex liquid state. In this strongly fluctuating vortex-liquid state, the large Nernst signal arises from phase slippage caused by singular phase fluctuations of the pair condensate [2, 5]. In the phase-disordering scenario, the unbinding of vortex-antivortex pairs (in zero applied ) leads to the loss of long-range phase coherence at [6]. The condensate is incapable of displaying long-range supercurrent response. Hence, even in weak , there is no Meissner effect above despite the survival of the pair condensate. Nevertheless, the persistent short-range phase stiffness supports vorticity and produces a large, strongly -dependent Nernst signal in the presence of a temperature gradient and an applied magnetic field . The Nernst effect above has also been investigated in Refs. [7, 8, 9]
Subsequently, thermodynamic evidence for the pair condensate above was obtained by torque magnetometry, which is a very sensitive probe of diamagnetism in the cuprates [10, 11]. A large diamagnetic response, that is non-linear in and grows strongly with decreasing , is specific to the Cooper pair condensate. Consequently, the diamagnetism results present clear evidence for survival of the pair condensate – with sharply reduced phase stiffness – to temperatures high above . This complements the transport evidence from the Nernst experiments. To date, the high-resolution torque measurements above have been reported in the bilayer cuprate [10, 11, 12, 13, 14] and in lightly-doped at low [15]. For earlier measurements of diamagnetism above , see Ref. [16] (on Bi 2212) and Ref. [17] (LSCO).
We report further torque magnetization experiments on , , and , which show that, when a positive Nernst signal appears below the onset temperature , it is accompanied by a large diamagnetic signal that grows steeply with decreasing . Extending the torque measurements to intense fields (33 T to 45 T), we also show that the curves of vs. are nonlinear with a profile characteristic of vortex liquid response, even at elevated .
Recently, the fluctuating vortex-liquid interpretation of the Nernst effect has been challenged by Cyr-Choiniere et al. [18], who carried out Nernst measurements on a series of Nd- and Eu-doped LSCO cuprates, in which charge ordering associated with stripe formation is known to occur at a charge ordering temperature . By a qualitative comparison of the Nernst coefficient in Nd-LSCO and Eu-LSCO, Cyr-Choiniere et al. proposed that, in pure LSCO, the high-temperature Nernst signal arises from small quasiparticle pockets as a result of Fermi-Surface (FS) rearrangement, rather than from phase-slippage in the pair condensate. We discuss the problem of separating the vortex Nernst term from quasiparticle contributions, and the key role that diamagnetism plays in this task. In pure LSCO, we explain how the magnetization results reported here pose serious difficulties for this hypothesis.
We adopt the abbreviations LSCO 09, LSCO 12 and LSCO 17 for with the Sr content = 0.09, 0.12 and 0.17, respectively. We use Bi 2201 and Bi 2212 to stand for and , respectively, and YBCO for . The terms underdoped, optimally-doped and overdoped are abbreviated as UD, OPT and OV, respectively.
II Torque Magnetometry
The torque magnetization was measured with the sample glued to the tip of a thin cantilever, with applied at a tilt angle = 10-15o to the crystal -axis. The deflection of the cantilever by the torque was detected capacitively. The cantilever typically can resolve changes in the magnetic moment of emu. Because of the 2D electronic dispersion in cuprates, the diamagnetic orbital currents are largely confined to the - plane [19, 10]. This makes torque magnetometry well-suited for detecting weak, incipient diamagnetism in cuprate crystals. We generally report the raw data as the effective torque magnetization defined as , where is the torque signal, the vacuum permeability, and the sample volume. ( includes all contributions to the observed torque signal.)

To describe our analysis, we first examine the curves of vs. shown in Fig.1A for Sample LSCO 09 with 24 K. At temperatures 100 K, is strictly linear in and paramagnetic in sign. This reflects the dominance of the anisotropic Van Vleck paramagnetic susceptibility , which has a weak dependence given by , with at 200 K. (The -dependence of will be shown later in Fig. 9.) The reason for measuring a dense set of curves in the high- interval 100-200 K will emerge when we discuss extraction of the onset temperature for diamagnetic response (Sec. VI). Below 100 K, begins to display a weak diamagnetic contribution that rapidly increases in magnitude as decreases. The temperature at which the diamagnetic contribution (referred to as hereafter) appears is identified as the onset temperature .
We note that becomes increasingly nonlinear in as decreases from 60 K to (24 K). Below , the diamagnetic term becomes so dominant in magnitude that is forced to large, negative values despite the positive contribution of the paramagnetic Van Vleck term. At , the curves at low fields display strong hystereses between up-sweep and down-sweep branches because of strong pinning in the vortex-solid state. In the plotted curves, this is seen as a fork (we suppress the full hysteretic curves in both branches for clarity). The field at which the down-sweep branch deviates from the up-sweep branch is experimentally defined as the melting field of the vortex solid (indicated by arrow for the curve at 7 K). As is raised, decreases rapidly, reaching zero at . A detailed investigation of in lightly doped LSCO is reported in Ref. [15]. The spin contribution to , which becomes important below 2 K in samples with 0.06, is also treated in detail in Ref. [15].
We assume that the paramagnetic background follows the trend that is seen at . Hence the diamagnetic term is related to the observed torque magnetization by
| (1) |
Hereafter, we subtract the background Van Vleck term from and plot the diamagnetic term vs. (except stated otherwise).
III LSCO
Carrying out the background subtraction for LSCO 09, we obtain the vs. curves. They are displayed at selected in Fig. 1B (4.2–30 K) and Fig. 1C (20–80 K). As shown in Panel B, is nonlinear in over a broad temperature interval. The curve at 22 K (bold curve) displays a characteristic flat profile in low fields (0.5 T 5 T). We identify this temperature as the “separatrix” temperature [10]. Below , takes on very large, negative values at small . As increases, displays an initially steep logarithmic increase, followed by a slower approach towards zero as approaches the upper critical field . The low-field curvature of the vs. curve changes from negative below to positive above . To emphasize the high temperature diamagnetic response, panel C displays the of Sample LSCO 09 at in expanded scale. For , the curves remain diamagnetic, displaying pronounced nonlinearity vs. . We regard the nonlinear diamagnetic response above as clear evidence for the presence of local supercurrents as well as finite pair amplitude in the pseudogap state.

As in the superconducting state, the diamagnetic signals above can be suppressed by an intense magnetic field. To get a sense of how large this field scale is, we extended the torque measurements on LSCO 09 to 33 T. After the background subtraction described above, the resulting curves are isolated and plotted in Fig. 2. For , these nonlinear curves display a broad minimum. The characteristic field locating the minimum increases rapidly with (from 8 T at 25 K to 33 T at 40 K). A rough measure of the field-scale needed to observe the inherent nonlinear response above is given by .
We emphasize that, above 50 K, is seemingly linear in . However, this is simply because has now moved outside the experimental window. It is incorrect to attribute – using a limited field range 15 T – this putative linear behavior to a different mechanism (e.g. quasiparticles with Landau diamagnetism). Above , is inherently non-linear in up to the onset temperature , but one needs progressively higher fields to see the non-linearity as increases.
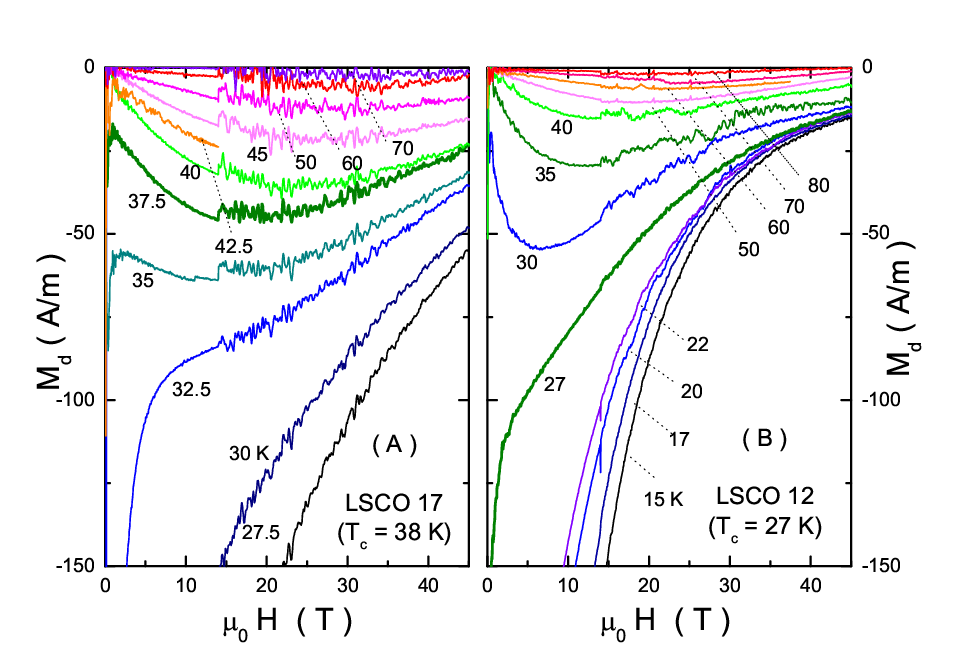
The diamagnetic curves of Sample LSCO 17 ( = 0.17, 38 K) and Sample LSCO 12 ( 0.12, 27 K) measured in up to 45 T are plotted in Fig. 3A and Fig. 3B, respectively. In these higher-doped crystals, the pattern of the curves is broadly similar to that in LSCO 09, and the foregoing discussion applies to the diamagnetic curves. The higher field accessed (45 T) in Fig. 3A, B confirms the intrinsic non-linearity of . In Panel A, is manifestly nonlinear at all up to 70 K, even though it seems linear when the field range is restricted to 10 T.
The magnitude of in the high-field curves reveals an interesting difference (for ) between LSCO 17 and LSCO 12. The monotonic decrease of with provides an estimate of the upper critical field scale (by extrapolating ). Comparing LSCO 17 with LSCO 12, we see that the scale of above 20 T is 2-3 times larger in the former at the same and . However, the stronger curvature of vs. in LSCO 12 implies that the decay of is more gradual, so that its is actually higher than that in LSCO 17. In the related cuprate , stripe formation at drives to 4 K [20]. The “dip” in the dome in the phase diagram of LSCO suggests that fluctuating stripes may also exist at . If this is true, the results suggest that fluctuating stripes reduce the overall pair condensate strength (compared with ) but allows it to survive to slightly larger fields.
IV Bismuth-based cuprates
The nonlinear diamagnetic signals above are also observed in the single-layer (Bi 2201) family. In this series, the transition temperature is tuned by the La content . The optimal occurs at 0.44. Samples with 0.44 are UD, while those with 0.44 are OV.


Figure 4 displays the diamagnetic curves of the single-layer cuprate Bi 2201 samples in the UD region (Panel A and B), in the optimally-doped region (C), and in the OV region (D). Above , the curves in Bi 2201 are also similar to those in LSCO shown in Fig. 2 and Fig. 3, except that the magnitudes of and field scales are slightly smaller in the former. Above , attains a broad minimum at fields below 20 T, and then approaches zero at 40 T. Like the curves for LSCO in Fig. 2 and Fig. 3, the curvature of the low-field curves changes from negative to positive as increases across . As is increased beyond 20 T, is greatly suppressed. Above , the complete suppression of requires very high fields – comparable to those needed below . Even in UD Bi 2201 with 0.7, where is quite low (12 K), the curves are suppressed to zero at 38 - 42 T at 45 K. Above ( 50 K in this sample), vanishes throughout our entire field range. The interesting weak-field region is discussed under “fragile London rigidity”.
In Fig. 5, we compare the curves in OPT and UD bilayer Bi 2212
(Panels A and B, respectively). Relative to the single-layer Bi 2201, the
amplitude in Bi 2212 attains much larger values, and extend to higher field scales. By extrapolating the low- - curves, we estimate that exceeds 150 T (compared with 50-80 T for Bi 2201).
Fragile London Rigidity
One of the most interesting features of the vortex liquid state above
is the fragile London rigidity, observable in the
limit . In Ref. [11], Li et al. discovered that
over a broad interval of (86-105 K) in OPT Bi 2212, the
low- follows the
power-law dependence
| (2) |
with an exponent that grows rapidly from 1 (at 105 K) to large values (6) as . This implies that the weak-field diamagnetic susceptibility is weakly divergent throughout the interval in where . However, this divergence is extremely sensitive to field suppression. The fragile London rigidity seems to reflect the increasing tendency of the phase-disordered condensate to establish long-range superfluid response as . It has no analog in bulk samples of low- superconductors, but may exist in a finite interval above the Kosterlitz-Thouless (KT) transition in 2D systems such as Mo1-xGex and InOx.
Using a soft cantilever, we have observed a similar pattern of magnetization in OPT Bi 2201. As shown in Fig. 6A, the curves display increasingly strong curvature as approaches zero from either direction. As decreases from 38 K to (30 K), the zero- slope rises sharply to a vertical line (see expanded scale in Panel B). The curve at (bold curve) seems to approach a logarithmic dependence vs. (equivalent to ). (As may be seen by the oscillations, mechanical noise in this soft cantilever precludes accurate measurements for 300 Oe. In Ref. [11], high-resolution SQUID magnetometry was used to extend measurements down to 10 Oe, but the volume of the present Bi 2201 crystal is too small for similar SQUID measurements.) Despite the lower resolution, the divergent curvature apparent in Fig. 6 is consistent with the appearance of fragile London rigidity starting 8 K above . The curves in Fig. 6B are remarkably similar to those reported in [11, 14] for OPT Bi 2212.
The fragile London rigidity is likely to extend over a larger interval
in UD samples. However, it would be more difficult to disentangle the
intrinsic weak-, nonlinear - behavior from the effects of inhomogeneous broadening arising from local variations of .
In OPT samples,
we reason that such effects are minimized. The bulk of the sample
has the maximum (OPT) . Minority regions with lower
contribute only negligibly to the screening current. Hence, observation of
the fragile state in OPT samples uncovers, in our opinion, a highly
unusual feature of cuprates that is intrinsic.

Contour Plot
An instructive way to view the nonlinear diamagnetic magnetization
is the contour plot of in the - plane [13].
Figure 7 displays the contour plot in
single-layer UD Bi2201 (La content 0.7, 12 K).
The value of is as indicated at selected contours.
With fixed (e.g. at 10 T), decreases monotonically
as is raised from 4 K to 60 K. Just as in the Nernst signal,
the diamagnetic signal in the - plane
bulges out to temperatures high above , with
no obvious discontinuities or changes of slope.
The highest temperature at which
is resolved is 50 K (the onset temperature in this
sample). The absence of a boundary at
implies that the vortex-liquid state below evolves
continuously to the diamagnetic state above .
If we fix (e.g. at 4 K) and increase , also decreases rapidly, as plotted in Fig. 4. The field (=45 T) at which is plotted as open circles. With increasing , gradually decreases, roughly tracking the contour at 2 A/m. However, unlike the mean-field BCS scenario, remains very large at (arrow). The magnetization contour plots in Bi 2212 (see Ref. [13]) are roughly similar to that in Fig. 7. However, the scale of the magnitude is much larger as expected. also extends to much higher field scales. A particular feature is that, near , the contours in OPT Bi 2212 are nearly vertical up to 33 T (the maximum applied field) [13]. This implies that, at the separatrix at , remains nearly -independent up to 33 T. By contrast, in Bi 2201, the constancy extends only to 10 T, as may be seen in Fig. 7.


V Optimally-doped YBCO
Optimally-doped YBCO (= 92 K) is distinguished as the cuprate with the smallest resistivity anisotropy and the largest interlayer (-axis) coupling energy. Because the coherence-length anisotropy = 3-5 is only moderate, the vortices have the largest stiffness modulus along among cuprates ( and are the coherence lengths along the axes and , respectively). Accordingly, the vortex solid melting line rises very rapidly below (to 15 T at 87 K). In the vortex-solid state (), the dissipationless state survives to fields of 60 T or more. Optimally-doped YBCO should be the least susceptible to the phase disordering mechanism for the destruction of long-range phase coherence at (and hence the best candidate for Gaussian fluctuations among cuprates).
However, the torque measurements reveal that in OPT YBCO is also dictated by large phase fluctuations. Figure 8A displays the - curves in OPT YBCO (twinned) measured to 14 T. The curves are broadly similar to those in LSCO 17 and OPT Bi2212, except for the larger magnitude of (at comparable and ). At = 92 K, reaches the substantial value 60 A/m at 14 T (by contrast, it should be nearly unobservable in a Gaussian mean-field picture). Over the broad interval 92130 K, a large diamagnetic signal is easily observed. As in the other hole-doped cuprates, very intense fields are needed to suppress in this interval.
In Panel (B), we plot the dependence of the total torque magnetization observed at 14 T (solid circles). As in the other hole-doped cuprates, is unresolved from the Van Vleck line until reaches 130 K (arrow), below which it accelerates to very large negative values. For comparison, we have also plotted the magnetization measured in a very weak 10 Oe (dashed curve) using a SQUID magnetometer. The nearly vertical decrease signals flux expulsion at . We remark that, although – measured with =10 Oe – is virtually unresolvable above , the diamagnetic susceptibility is actually quite large above (as is clear from Panel A). Because is robust to intense (100 T), the curve at 14 T reveals the existence of the large fluctuating diamagnetism associated with the vortex liquid. This point, emphasized in Refs. [10, 11], highlights the major difference between the diamagnetism in hole-doped cuprates and low- superconductors. In the latter, increasing in the fluctuation regime above rapidly squelches the (Gaussian) fluctuation signal altogether. The curves in Fig. 8A displaying significant diamagnetism surviving to intense fields, at temperatures up to 40 K above is strong evidence that we are observing the phase-disordering mechanism, rather than Gaussian mean-field fluctuations. A comparison of the Nernst and magnetization signals in UD YBCO is given in Ref. [24].


VI Onset temperatures and phase diagram
An important question is how high in temperature does the diamagnetic signal extend above . Following the procedure in Wang et al. [10], we have plotted the total effective magnetization measured in fixed (14 T) versus . Figure 9 displays these plots for several samples of Bi 2201 (Panel A) and LSCO (Panel B). In agreement with the results for Bi 2212 in Ref. [10], displays a weak dependence at elevated that may be fitted to the Van Vleck anisotropy term (straight lines). The anisotropy leads to a paramagnetic torque background, as displayed. In each sample, displays a sharp downward deviation, beginning at the temperature defined as (arrows). This reflects the appearance of local supercurrents induced in response to the applied field. While feeble near , the diamagnetic term grows very rapidly in magnitude to pull to large negative values.
To determine with reasonable accuracy, it is important to establish the Van Vleck term with a sufficiently dense set of points above . At elevated temperatures, the magnetization curves become closely spaced. Thus, the stability of the cantilever as well as the resolution in measuring must be sufficiently high to allow adjacent curves to be distinguished. As examples, we display in Fig. 10 A and B expanded views of the curves in LSCO 09 and LSCO 12, respectively. The values of at = 14 T are the ones plotted in Fig. 9.
The profile of vs. is common to all the samples investigated, even those in the extreme UD regime. The characteristic profile is qualitatively different from that seen in the gaussian regime in BCS superconductors. Remarkably, the rapid downward acceleration of the diamagnetic signal matches the equally rapid growth of the Nernst signal taken at 14 T (Fig. 3 in Ref. [10] compares the profiles of the Nernst signal and measured in the same crystal of Bi 2212).
To compare obtained here with the onset temperature of the vortex Nernst signal [2], we plot the 2 onset temperatures vs. doping in the phase diagram for LSCO (Fig. 11A) and Bi 2201 (Fig. 11B). Remarkably, in LSCO, (open squares) is nominally equal to in LSCO over the entire doping range investigated. The major difference is that the former seems to peak at = 0.12 whereas the latter peaks at 0.10. The error bars at both temperatures are too large to determine if the disagreement is real. In the interesting UD side, both temperatures decrease roughly linearly with as . [In an earlier analysis [2], was extrapolated below = 0.05 to reach 0 at 0.03. Our recent results show that this extrapolation is incorrect. Because the Nernst signal at = 0.03 is too weak to resolve even at low , there is actually no experimental information on . By contrast, the results on vs. (Fig. 9B) allow to be fixed reliably at small .] Interestingly, the dependence of obtained in Ref. [15] is also linear in in this regime.
In Bi 2201 (Panel B), the 2 temperature scales are also quite similar. However, the trend of on the OV side appears to be slightly steeper than that of . A caveat is that the torque measurements here were not performed on the same crystals as the Nernst experiments.
VII Discussion
Diamagnetism and Supercurrent Response
The presence of a large diamagnetic response that is both
strongly dependent and non-linear in deeply implicates
Cooper pairing. Diamagnetism involves an orbital current density that
is antiparallel to the applied vector potential
(as in the London equation).
Cooper pairing is – to our knowledge – the only established
electronic state capable of generating the current response
consistent with the nonlinear, strongly -dependent
diamagnetism reported here.
[Core diamagnetism in insulators and Landau diamagnetism
(observed in pure Bi) are both
strictly -linear to extremely large (,
where is the band-width and the Bohr magneton) and nearly
independent. A “superdiamagnetic” state based on toroidal, orbital moments has been theorized [21], but this state has never been observed.] Hence, diamagnetism provides a rather direct
detector of incipient Cooper pairing in the cuprates.
As shown in Secs. III, IV and V for LSCO, the Bi-based cuprates and YBCO, respectively, the - curves above show similar patterns - a broad minimum in moderate fields followed by a steady suppression to zero in very high fields. This pattern evolves continuously from the curves measured below , which display a divergence at low field caused by the Meissner effect. Above , this divergence vanishes because of the loss of long range phase coherence. Nonetheless, a reduced local phase rigidity survives [11], which gives rise to the enhanced diamagnetic above at low fields. Although its overall magnitude is 10 times smaller than below (when observed at similar ), is readily detected as a strongly -dependent and -nonlinear response. In UD Bi 2201, we have accomplished full field suppression of in fields 45 T. However, in all other cuprates, the full suppression requires fields in excess of 80 T (possibly as high as 150 T). These impressively large field scales are a consequence of the anomalously large binding energies of Cooper pairs in hole-doped cuprates. The broad similarity of the magnetization curves in LSCO, Bi 2201, Bi 2212 and YBCO suggests that the diamagnetic behavior above is universal in the hole-doped cuprates. They are qualitatively different from the diamagnetic response in low- supercondcutors.
It is instructive to compare the diamagnetism in cuprates with the fluctuating diamagnetism observed in disordered MgB2. In a recent experiment, Bernardi et al. [22] compared the magnetization of pure MgB2 ( = 39 K) with disordered Mg1-xB2Alx ( = 0.25, = 25 K). In the disordered sample (which has a broad transition width of 15 K), the curves of vs. show that sizeable diamagnetism exists in the narrow interval 28-32 K above its (Fig. 5 of [22]). The profile of vs. , which displays a broad minimum at 200 Oe, is roughly similar to the profiles reported here (aside from the field scale). The broad transition width implies large inhomogneities in the Al distribution. As the diamagnetic response above does not persist above of pure MgB2 (39 K), we suggest that the fluctuation diamagnetism arises from Al-poor regions of MgB2 which have the highest . Thus, over the whole sample, diamagnetism is observable above 25 K, but not above 39 K. This contrasts with the cuprates. In the OPT sample within each family, extends above by factors of 1.3 (YBCO), 1.4 (Bi 2212), 2.1 (LSCO) and 2.5 (Bi 2201). Clearly, we cannot simply explain away the high- diamagnetism as coming from isolated OPT regions with the highest . The comparison shows that the local supercurrents detected in MgB2 arise from isolated regions with strong amplitude fluctuations and a broad distribution of local ’s. By contrast, the diamagnetic signal in cuprates arises from a condensate that has lost phase stiffness, even though the gap amplitude remains large and nominally uniform above .
Quasiparticle term in Nernst signal
In UD LSCO, the quasiparticle (qp) current makes a significant contribution
to the Nernst signal . In the initial report
of Xu et al. [1], the onset temperature was found to remain high
even when falls below 0.1 (150 K for = 0.05).
This was traced [2] to a significant qp contribution
to the Nernst signal. To discuss the qp term, it is crucial to consider the
sign of the Nernst effect.
By convention, the sign of the Nernst effect is defined as that of the triple product with the observed Nernst -field [5]. This rule is equivalent to the old convention based on “Amperian” current direction (clearly described by Bridgman [23]). For vortices, where the vortex line velocity is . Hence vortex flow produces a positive Nernst signal. The qp contribution may have either sign (unrelated to their charge sign).
When the qp term is negative, it is relatively easy to separate the 2 contributions, especially by going to intense . However, if the qp term is positive, the separation is more difficult. In Ref. [2], Wang et al. introduced a method for separating the qp and vortex terms by simultaneous measurements of the Hall angle and thermopower vs. to obtain the term . This subtraction procedure yields the onset temperature for the vortex term (45 K at = 0.05), which is plotted in Fig. 11A. With the qp subtraction applied to the samples 0.07, the curve of vs. has a tilted dome profile with a sharp peak at = 0.125. For OPT and OV LSCO, Wang et al. found [5] that the qp term is negative and negligible compared with the vortex term. Hence, gives the onset of the vortex term without the need for corrections. (The qp term is also negative in YBCO, Bi 2201 and Bi 2212 [5]).
Recently, this assumption has been challenged by Cyr-Choiniere et al. [18], who proposed that rearrangement of the FS – possibly by charge ordering or stripe formation – produces a positive quasi-particle term that dominates the Nernst signal over the LSCO phase diagram at high temperatures. Although their Nernst measurements were largely on Eu-doped and Nd-doped LSCO where static stripes are experimentally observed, they have extended their hypothesis to pure LSCO. There, they proposed that a positive qp also accounts for its Nernst signal at elevated (except in a narrow interval just above ).
In the scenario of Ref. [18], the onset temperature for vortex fluctuations should lie considerably lower than the dome of plotted in Fig. 11A. However, the good agreement between and shows that this is not the case. As we argued above, the strongly - and -dependent diamagnetism arises only from the pair condensate, and is unaffected by qp contributions. The agreement between and seems to us to be strong evidence against the proposal in Ref. [18], at least in pure LSCO. For the claim to be viable, the hypothetical quasiparticles would have to produce a large, -dependent diamagnetism that is also strongly non-linear in , as well as a positive Nernst signal.
The hypothesis of Cyr-Choiniere et al. [18] is the latest of several proposals (see discussion in Ref. [5]) that have sought to explain away the unexpected Nernst signal in the cuprates by invoking quasiparticles with ad hoc properties. Are the large Nernst signals at high from vortices in a phase -disordered condensate or from quasiparticles (qp)? We argue that torque magnetometry and the Nernst effect together constitute an incisive combination that answers this question. When the 2 probes show that a large positive Nernst signal coexists with a diamagnetic susceptibility (with the same onset temperatures and similar profiles vs. and ), the case in favor of phase slippage in a pair condensate with strongly disordered phase seems compelling to us. This is one of our main conclusions.
The magnetization-Nernst approach can also be turned around to identify situations when the Nernst signal is not caused by vorticity. As mentioned, in UD LSCO (0.07) the agreement of and provides confirmation that the subtraction proceduce based on [2] is valid. (In the broad interval between and , extending from 45 to 150 K for = 0.05, there is a large positive Nernst signal, but diamagnetism is absent. Thus, even if the qp contribution had not been identified [2], the present experiment would have detected the correct onset of the vortex term.)
In UD YBa2Cu3O6+y (YBCO), the qp Nernst signal
is unusually large in a narrow window of
doping. In this doping range, when the qp term appears at high ,
it is negative as in OV LSCO. Significantly, the diamagnetic signal is absent
until the vortex Nernst signal appears at a lower
(detailed YBCO results are reported in Ref. [24]).
Hence, when used together, the torque magnetization and Nernst effect
readily distinguish qp from vortex contributions to the Nernst signal.
Nernst effect and diamagnetism studies on
[20]
should provide valuable insight into the fluctuation regime in
which stripes coexist with Cooper pairing.
Related Experiments
The surviving pair condensate above has also been observed in other experiments, notably in measurements of the kinetic inductance [25], STM experiments on the gap above [26], and survival of Bogolyubov quasiparticles above [27]. Consistent with these observations, our results imply that the pair condensate exists well above , surviving as
a dilute vortex liquid with local phase rigidity of short phase-correlation
length. A number of groups recently calculated the
Nernst signal and diamagnetism above in
2D superconductors and applied the results to cuprates
[32, 29, 28, 30, 31]. The vortex liquid viewed as an incompressible superfluid has been treated by Anderson [33, 34]. A relevant discussion
of the relation of the quantum oscillation results to the
Nernst and magnetization results is given in Ref. [35].
To summarize, the high-field torque magnetometry measurements reveal that the diamagnetism persists well above in several families of hole-doped cuprates. As a strongly nonlinear vs. is characteristic of local supercurrent response, the diamagnetism is direct evidence that the pair condensate exists above , surviving in places all the way to . Hence, phase slippage is the origin of the large Nernst effect signals observed to that temperature. The agreement between the onset temperatures and precludes quasiparticle interpretations for the positive Nernst signal above . The magnetization results pose very serious difficulties for the quasiparticle hypothesis [18] proposed recently for the Nernst effect in pure LSCO.
We acknowledge numerous helpful discussions with P. W. Anderson, J. C. Davis, S. A. Kivelson, P. A. Lee, T. Senthil, Z. Tešanović and A. Yazdani. The research at Princeton is supported by funds from U.S. National Science Foundation under the MRSEC Grants DMR-0213706 and DMR-0819860. Y.W. is supported by NSFC and MOST of China. G. D. G. is supported by the Department of Energy (DOE) under contract No. DE-AC02-98CH10886. The high-field experiments were performed at the National High Magnetic Field Laboratory, which is supported by NSF Cooperative Agreement No. DMR-084173, by the State of Florida, and by the DOE.
References
- [1] Z. Xu, N.P. Ong, Y. Wang, T. Kakeshita and S. Uchida, Nature 406, 486 (2000).
- [2] Yayu Wang, Z. A. Xu, T. Kakeshita, S. Uchida, S. Ono, Yoichi Ando, and N. P. Ong, Phys. Rev. B 64, 224519 (2001).
- [3] Yayu Wang, N. P. Ong, Z.A. Xu, T. Kakeshita, S. Uchida, D. A. Bonn, R. Liang and W. N. Hardy, Phys. Rev. Lett. 88, 257003 (2002).
- [4] Yayu Wang, S. Ono, Y. Onose, G. Gu, Yoichi Ando, Y. Tokura, S. Uchida, and N. P. Ong, Science 299, 86 (2003).
- [5] Yayu Wang, Lu Li, and N. P. Ong, Phys. Rev. B 73, 024510 (2006).
- [6] V. J. Emery, S. A. Kivelson, Nature 374, 434 (1995).
- [7] C. Capan, K. Behnia, J. Hinderer, A. G. M. Jansen, W. Lang, C. Marcenat, C. Marin, and J. Flouquet, Phys. Rev. Lett. 88, 056601 (2002).
- [8] F. Rullier-Albenque, R. Tourbot, H. Alloul, P. Lejay, D. Colson, and A. Forget, Phys. Rev. Lett. 96, 067002 (2006)
- [9] F. Rullier-Albenque, H. Alloul, Cyril Proust, P. Lejay, A. Forget, and D. Colson, Phys. Rev. Lett. 99, 027003 (2007).
- [10] Yayu Wang, Lu Li, M. J. Naughton, G. Gu, S. Uchida and N. P. Ong, Phys. Rev. Lett. 95, 247002 (2005).
- [11] Lu Li, Yayu Wang, M. J. Naughton, S. Ono, Yoichi Ando, and N. P. Ong, Europhys. Lett. 72, 451 (2005).
- [12] Lu Li, Yayu Wang, J.G. Checkelsky, M.J. Naughton, Seiki Komiya, Shimpei Ono, Yoichi Ando, and N.P. Ong, Physica C 460-462, 49 (2007).
- [13] Lu Li, Yayu Wang, M.J. Naughton, Seiki Komiya, Shimpei Ono, Yoichi Ando, N.P. Ong, J. Magnetism Magnetic Mater. 310, 460 (2007).
- [14] N. P. Ong, Yayu Wang, Lu Li, and M. J. Naughton, Phys. Rev. Lett. 98, 119702 (2007).
- [15] Lu Li, J. G. Checkelsky, Seiki Komiya, Yoichi Ando and N. P. Ong, Nature Physics 3, 311 (2007).
- [16] D. C. Johnston, and J. H. Cho, Phys. Rev. B 42, 8710 (1990).
- [17] A. Lascialfari, A. Rigamonti, L. Romano’, A.A. Varlamov, and I. Zucca, Phys. Rev. B68, 100505(R) (2003).
- [18] Olivier Cyr-Choiniere et al., Nature, 458, 743 (2009).
- [19] C. Bergemann, A. W. Tyler, A. P. Mackenzie, J. R. Cooper, S. R. Julian, and D. E. Farrell, Phys. Rev. B 57, 14387 (1998).
- [20] Q. Li, M. Huc̈ker, G. D. Gu, A. M. Tsvelik, and J. M. Tranquada, Phys. Rev. Lett. 99, 067001 (2007).
- [21] V. L. Ginzburg, A. A. Gorbatsevich, Yu. V. Kopayev and B. A. Volkov, Solid State Commun. 50, 339 (1984).
- [22] E. Bernardi, A. Lascialfari, A. Rigamonti, and L. Romano’, Phys. Rev. B77, 064502 (2008).
- [23] P. W. Bridgman, Phys. Rev. 24, 644 (1924).
- [24] Minhao Liu, Yayu Wang, Lu Li and N. P. Ong, in preparation.
- [25] J. Corson, R. Mallozzi, J. Orenstein, J. N. Eckstein, and I. Bozovic, Nature, 398, 221 (1999).
- [26] Kenjiro K. Gomes, Abhay N. Pasupathy, Aakash Pushp, Shimpei Ono, Yoichi Ando, Ali Yazdani, Nature, 447, 569 (2007).
- [27] Jhinhwan Lee, K. Fujita, A. R. Schmidt, Chung Koo Kim, H. Eisaki, S. Uchida, and J.C. Davis, Science 325, 1099 (2009).
- [28] L. Benfatto, C. Castellani, T. Giamarchi, Phys. Rev. Lett. 98 117008 (2007); ibid., Phys. Rev. Lett. 99, 207002 (2009).
- [29] V. Oganesyan, D. A. Huse, and S. L. Sondhi, Phys. Rev. B, 73, 094508 (2006).
- [30] Z. Tešanović, Nature Physics 5, 408 (2008).
- [31] Daniel Podolsky, Srinivas Raghu, and Ashvin Vishwanath, Phys. Rev. Lett. 99, 117004 (2007).
- [32] Subroto Mukerjee and David A. Huse, Phys. Rev. B70, 014506 (2004).
- [33] P. W. Anderson, Nature Physics 3, 160 (2007).
- [34] P. W. Anderson, Phys. Rev. Lett. 100, 215301 (2008).
- [35] T. Senthil, P. A. Lee, Phys. Rev. B79, 245116 (2009).