Hot and cool water in Herbig Ae protoplanetary disks
Abstract
The spatial origin and detectability of rotational H2O emission lines from Herbig Ae type protoplanetary disks beyond 70 m is discussed. We use the recently developed disk code ProDiMo to calculate the thermo-chemical structure of a Herbig Ae type disk and apply the non-LTE line radiative transfer code Ratran to predict water line profiles and intensity maps. The model shows three spatially distinct regions in the disk where water concentrations are high, related to different chemical pathways to form the water: (1) a big water reservoir in the deep midplane behind the inner rim, (2) a belt of cold water around the distant icy midplane beyond the “snowline” AU, and (3) a layer of irradiated hot water at high altitudes , extending from about 1 AU to 30 AU, where the kinetic gas temperature ranges from 200 K to 1500 K. Although region 3 contains only little amounts of water vapour (), it is this warm layer that is almost entirely responsible for the rotational water emission lines as observable with Herschel. Only one ortho and two para H2O lines with the lowest excitation energies K are found to originate partly from region 2. We conclude that observations of rotational water lines from Herbig Ae disks probe first and foremost the conditions in region 3, where water is predominantly formed via neutral-neutral reactions and the gas is thermally decoupled from the dust . The observation of rotational water lines does not allow for a determination of the snowline, because the snowline truncates the radial extension of region 1, whereas the lines originate from the region 3. Different line transfer approximations (LTE, escape probability, Monte Carlo) are discussed. A non-LTE treatment is required in most cases, and the results obtained with the escape probability method are found to underestimate the Monte Carlo results by 2%45%.
Key Words.
Astrochemistry; circumstellar matter; stars: formation; Radiative transfer; Methods: numerical; line: formation1 Introduction
Water is one of the most important species in planet formation, disk evolution and for the origin of life. In protoplanetary disks, water can be abundant either in the gas phase or as solid ice, owing to a high sublimation temperature.
Water vapour is predicted to be abundant inside of the snowline within a few AU where densities are high and temperatures are too warm for ice formation (Agúndez et al., 2008; Glassgold et al., 2009). Indeed, observations in the near- and mid-infrared with Spitzer (Salyk et al., 2008; Carr & Najita, 2008; Najita et al., 2009; Eisner et al., 2009) reveal the presence of water vapour and other simple organic molecules (OH, C2H2, HCN, CO2). Simple modelling of the line emissions constrains the warm gas (a few 100 K) to be located inside of AU.
The core-accretion model for planet formation is only efficient in the cold midplane of disks where dust grains are covered by water ice. Icy grains are stickier than bare silicate grains and coagulate faster into planetesimals (Ida & Lin, 2008). Liquid water is one of the prerequisites for the emergence of life on terrestrial planets. But its origin, either via release of water molecules trapped in hydrated rocks during volcanism or via the impact of comets, is still being debated (Nuth, 2008).
The lowest rotational lines of water lie in the far IR and are only observable by satellites, e. g. the Herschel Space Observatory. Other recent works on rotational water lines from protoplanetary disks used X-ray models (without UV photoprocesses) to calculate the thermo-chemical disk structure on top of a pre-described density structure (Meijerink et al., 2008) and applied a multi-zone escape probability method (Poelman & Spaans, 2005; Poelman & Spaans, 2006) to compute the line fluxes. In this Letter, we use the disk code ProDiMo to compute the disk structure, temperature, and water abundance self-consistently, and discuss the prospects for detecting rotational water lines by means of the Monte Carlo code Ratran (Hogerheijde & van der Tak, 2000).
2 The model
We used the recently developed disk code ProDiMo to calculate the thermo-chemical structure of a protoplanetary disk around a Herbig Ae type star with parameters listed in Table 1. ProDiMo combines frequency-dependent 2D dust-continuum radiative transfer, kinetic gas-phase and UV photo-chemistry, ice formation, and detailed non-LTE heating & cooling with the consistent calculation of the hydrostatic disk structure. ProDiMo does not include X-rays at the moment. X-ray to FUV luminosity ratios of Herbig Ae stars are often low (Kamp et al., 2008), so that we assume that the FUV irradiation provides the main energy input for the disk. The model is characterised by a high degree of consistency between the various physical, chemical, and radiative processes, where the mutual feedbacks are solved by global iterations. For more details see Woitke et al. (2009), henceforth called Paper I. Recent updates include an improved treatment of UV photorates by detailed cross sections in the calculated radiation field (Kamp et al., 2009, see).

| quantity | symbol | value |
|---|---|---|
| stellar mass | ||
| effective temperature | K | |
| stellar luminosity | ||
| disk mass | ||
| inner disk radius | 0.5 AU | |
| outer disk radius | 150 AU | |
| radial column density power index | 1.0 | |
| dust-to-gas mass ratio | 0.01 | |
| minimum dust particle radius | m | |
| maximum dust particle radius | m | |
| dust size distribution power index | 3.5 | |
| dust material mass density | 2.5 g cm-3 | |
| strength of incident ISM UV | 1 | |
| abundance of PAHs relative to ISM | 0.1 |
: soft inner edge applied, see Woitke(2009) : dust optical constants from Draine & Lee (1984)
The model results in a flared disk structure with a puffed-up inner rim and a vertically extended hot atomic layer above from the inner rim to about AU, similar to Fig. 9 in Paper I (l.h.s.), where K due to the stellar UV-irradiation. The major difference between the T Tauri type disk discussed in Paper I and the Herbig Ae disk discussed here is that in Herbig disks, the star is much more luminous, so the dust is warmer in the midplane (here K inward of AU), which prevents water ice formation.
Water molecules generally form in deeper layers, and the resulting water concentration in these layers is depicted in Fig. 1. The vertical H2O column densities in this model are found to be at 1 AU, still at 10 AU, but then quickly dropping below at 30 AU and beyond.
3 Chemical pathways to water
| region | [AU] | [K] | [K] | ||
|---|---|---|---|---|---|
| 1 | 0.720 | 240 | 240 | ||
| 2 | 20150 | 38 | 37 | ||
| 3 | 130 | 0.10.3 | 410 | 150 |
The formation of H2O follows different chemical pathways in the three different regions shown in Fig. 1. Two of these regions (1 and 3) have been previously identified in vertical slab models for X-ray irradiated T Tauri disks by Glassgold et al. (2009).
1) The big inner water reservoir. The deep midplane regions from just behind the inner rim to a distance of about 10 AU in this model host the majority of the water in the disk, see Table 2. This region is almost completely shielded from the stellar and interstellar radiation , is still too warm for water to freeze out , and is characterised by large particle densities and thermal equilibrium between gas and dust (). The important chemical reactions in this region are in detailed balance with their direct reverse reaction; i. e. the gas-phase chemistry is close to thermochemical equilibrium. Since H2O is the thermodynamically most stable oxygen carrier under these conditions (after CO), the water concentration is given approximately by the element abundance of oxygen minus the fraction thereof bound in CO.
2) The distant water belt. Region 2 at AU and is characterised by particle densities , temperatures K, and UV-strengths (see Eq. (41) in Paper I) below 500. These conditions allow water to freeze out, and there is a tight equilibrium between water adsorption and photodesorption , where H2O# designates water ice. The formation of gaseous water in this region is mainly controlled by the following two photoreactions
| (1) | |||||
| (2) |
Therefore, the strength of the UV field controls the water vapour concentration11 1 Our analysis is restricted to the case of kinetic chemical equilibrium. Thus, we cannot discuss the history of water ice formation with our model. Water ice may furthermore be photodesorbed directly into OH, see e.g. Andersson & van Dishoeck (2008).. At AU, drops from to virtually between and . The UV photons mostly come from the star and are scattered around the optically thick core of the disk. Water is photo-dissociated for that is too high, and freezes out for too low . The result is a thin belt of cold water vapour with concentrations in excess of around the distant icy midplane. Glassgold et al. (2009) have not found region 2 in their T Tauri models, probably because their model did not include the UV photoprocesses.
|
full model |
 |
 |
 |
|---|---|---|---|
|
hot water layer 3 removed |
 |
 |
 |
3) The hot water layer. At distances AU and relative heights , the model is featured by an additional layer of warm water-rich gas that is thermally decoupled from the dust . The particle density is about in this layer, the dust temperature K, the gas temperature K, and the UV radiation field strength .
Above region 3, the high gas temperatures in combination with the direct UV irradiation from the star efficiently destroys all OH and H2O. In region 3, the medium is shielded from the direct stellar irradiation by the puffed-up inner rim. In the shadow of the inner rim, drops quickly by about two orders of magnitude (the remaining UV photons are scattered stellar photons), and water forms via the following chain of surface and neutral-neutral reactions
| (3) | |||||
| (4) | |||||
| (5) |
counterbalanced by the photo-dissociation reactions and . The reason for the minimum of the H2O concentration between regions 3 and 1 lies in the high activation energies required for reactions (4) and (5). These neutral-neutral reactions become inefficient when the gas temperature drops below K. The radial extension of the hot water layer is restricted for the same reason. Since UV chemistry is lacking in (Glassgold et al., 2009), their water formation is counterbalanced by charge transfer reactions with H, which also destroys OH and H2O.
4 Spectral appearance of rotational water lines
Having calculated the density structure, the molecular abundances, the dust and gas temperatures and the continuous radiation field in the disk, we performed axisymmetric non-LTE line transfer calculations for selected rotational water lines as summarised in Table 3. The non-LTE input data for ortho (para) H2O is taken from the Leiden Lambda database (Schöier et al., 2005), which includes 45 (45) levels, 158 (157) lines, and 990 (990) collisional transitions with H2. A scaled version of the last data is also applied to collisions with H, which is essential as region 3 is partly H2-poor and H-rich. The velocity field is assumed to be Keplerian. We add a turbulent line width of 0.15 km/s to the thermal line width throughout the disk. The ratio between para and ortho H2O is assumed to be as in LTE.
We used three different methods of increasing complexity to calculate the water population numbers: local thermal equilibrium (LTE), a simple escape probability method (ES, see Sect. 6.1 of Paper I) and a modified version of the 2D Monte Carlo code Ratran (Hogerheijde & van der Tak, 2000), see (Kamp et al., 2009) for modifications. The LTE and ES methods used the full 150150 ProDiMo output directly as thermo-chemical input model. The grid size of the MC model needed to be somewhat reduced for practical reasons. We decided to run 8080 MC models, which need about photon packages to converge to a signal/noise ratio better than 5 for the worst population number in the worst cell, which takes about 13 CPU hours on a 2.66 GHz Linux machine.
To investigate the role of the hot water layer (region 3) for the spectral appearance of the rotational lines, we calculated two sets for each model. The first set includes the full chemical input model. In the second set, we artificially put the water abundance in region 3 to zero (if and K). The results of the two sets of MC models are compared in Fig. 2.
We generally observe double-peaked line profiles typical for rotating gas in emission. In the case of the full input model, the peak separation generally measures the radial extension of region 3 (Kepler velocity is 8.8 km/s at 25 AU in this model, inclined to gives 4.4 km/s). However, the peak separation of the lowest o-H2O excitation line (538.29m) and the two lowest p-H2O excitation lines (269.27m and 303.46m, see Table 3) correspond to the full radial extent of the model, 150 AU.
The truncated model generally results in smaller line fluxes with a broader, often unclear profile. If the water in region 3 is missing, the lines originate mainly from region 1, which is optically thick even in the continuum. Since the gas is in thermal balance with the dust in region 1 (), the lines do not go much into emission in region 1. Again, the lowest three excitation lines behave differently, and region 2 contributes by for these lines. There is furthermore one intermittent case (o-H2O 179.5m with K) where the truncated model reveals a small contribution of the extended region 2 with the character of low-excitation lines (middle column in Fig. 2).
All rotational water lines of the Herbig Ae disk discussed in this letter are above the detection limit of the PACS spectrometer (, depending on ). The strongest water lines at m and m are above the detection limit. However, the lines sit on a strong dust continuum, which possibly complicates the detection by Herschel.
5 LTE vs. escape probability vs. Monte Carlo
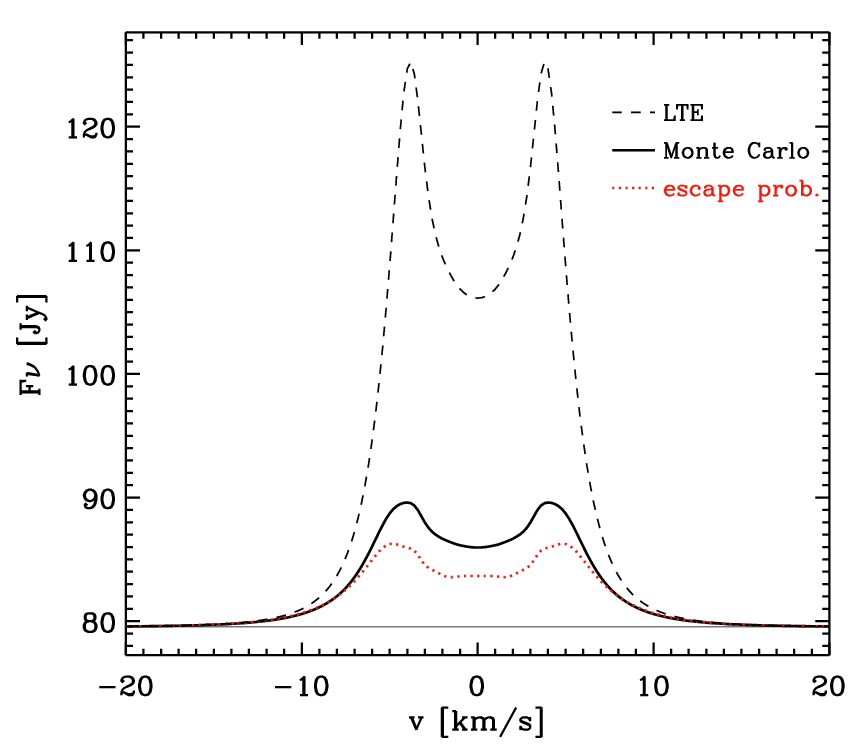
Figure 3 compares the results obtained by three different line transfer methods for the high-excitation para-H2O line at 89.99m. The results for the other lines are listed in Table 3. We consider the deviations from the results of the most advanced method (MC) as a measure of the quality of the other methods. The LTE predictions are generally too high, by up to a factor of 3.5, although continuum flux, line width, and peak separation are similar. Since the densities in region 3 are lower than the critical density , the levels tend to depopulate radiatively, which explains the overpredictions by LTE. Deviations between ES and MC are between 2% and 45%, and increase with excitation energy . Our ES method tends to underestimate the line fluxes in general. The levels in region 3 are pumped by line radiation from distant regions in LTE that have larger line source functions. This effect is difficult, if not impossible, to be properly account for in the ES approximation.
| carrier | transition | m] | LTE | ES | MC | ES-MC | ||
|---|---|---|---|---|---|---|---|---|
| o-H2O | 538.29 | 0.0035 | 61 | 0.702 | 0.531 | 0.538 | 2% | |
| o-H2O | 180.49 | 0.0306 | 194 | 9.27 | 2.32 | 3.39 | 37% | |
| o-H2O | 179.53 | 0.0559 | 114 | 11.9 | 7.69 | 8.59 | 11% | |
| o-H2O | 174.63 | 0.0505 | 197 | 12.7 | 7.47 | 8.88 | 17% | |
| o-H2O | 108.07 | 0.256 | 194 | 54.8 | 11.4 | 17.9 | 44% | |
| o-H2O | 78.74 | 0.484 | 432 | 94.5 | 24.6 | 35.9 | 37% | |
| p-H2O | 303.46 | 0.0058 | 101 | 1.27 | 1.48 | 1.40 | 5% | |
| p-H2O | 269.27 | 0.0184 | 53 | 2.40 | 2.22 | 2.09 | 6% | |
| p-H2O | 144.52 | 0.0332 | 397 | 5.53 | 4.57 | 4.15 | 9% | |
| p-H2O | 138.53 | 0.125 | 204 | 14.3 | 7.76 | 8.71 | 12% | |
| p-H2O | 100.98 | 0.260 | 196 | 32.5 | 8.66 | 10.9 | 23% | |
| p-H2O | 89.99 | 0.352 | 297 | 48.0 | 10.2 | 14.0 | 31% |
6 Conclusions
The rotational water lines from Herbig Ae disks beyond 70m originate predominantly from a warm molecular layer at relative altitudes where H2O is formed via neutral-neutral reactions in a thermally decoupled gas (). The more distant cold water around the icy midplane, where the ice is photodesorbed, contributes only to the lowest excitation lines. The peak separation of all other lines measures the radial extension of the warm molecular layer, which is about 40 AU in the discussed model. In contrast, the vast majority of water vapour in the disk is situated in the deep midplane, extending from just behind the inner rim outward to the snowline, where water freezes out to form water ice. The gas in this massive deep water reservoir is in thermal balance () with optically thick dust and, therefore, no strong line emissions are produced with respect to the continuum from this deep region. Thus, no information about the position of the snowline can be deduced from the rotational water lines. A similar conclusion was reached by Meijerink et al. (2008). The line analysis generally requires a non-LTE treatment. Our escape probability method is found to underestimate the water line fluxes with respect to the more expensive Monte Carlo method by about 2%45%.
Acknowledgements.
We thank Dr. Rowin Meijerink for an open discussion about water in disks and Dr. Dieter Poelman for internal benchmark tests of different non-LTE line transfer methods.References
- Agúndez et al. (2008) Agúndez, M., Cernicharo, J., & Goicoechea, J. R. 2008, A&A, 483, 831
- Andersson & van Dishoeck (2008) Andersson, S. & van Dishoeck, E. F. 2008, A&A, 491, 907
- Carr & Najita (2008) Carr, J. S. & Najita, J. R. 2008, Science, 319, 1504
- Draine & Lee (1984) Draine, B. T. & Lee, H. M. 1984, ApJ, 285, 89
- Eisner et al. (2009) Eisner, J. A., Graham, J. R., Akeson, R. L., & Najita, J. 2009, ApJ, 692, 309
- Glassgold et al. (2009) Glassgold, A. E., Meijerink, R., & Najita, J. R. 2009, astro-ph 0905.4523
- Hogerheijde & van der Tak (2000) Hogerheijde, M. R. & van der Tak, F. F. S. 2000, A&A, 362, 697
- Ida & Lin (2008) Ida, S. & Lin, D. N. C. 2008, ApJ, 685, 584
- Kamp et al. (2008) Kamp, I., Freudling, W., Robberto, M., Chengalur, J., & Keto, E. 2008, Physica Scripta Volume T, 130, 014013
- Kamp et al. (2009) Kamp, I., Tilling, I., Woitke, P., Thi, W.-F., & Hogerheijde, M. R. 2009, A&A, in prep.
- Meijerink et al. (2008) Meijerink, R., Poelman, D. R., Spaans, M., Tielens, A. G. G. M., & Glassgold, A. E. 2008, ApJ, 689, L57
- Najita et al. (2009) Najita, J. R., Doppmann, G. W., Carr, J. S., Graham, J. R., & Eisner, J. A. 2009, ApJ, 691, 738
- Nuth (2008) Nuth, J. A. 2008, Earth Moon and Planets, 102, 435
- Poelman & Spaans (2005) Poelman, D. R. & Spaans, M. 2005, A&A, 440, 559
- Poelman & Spaans (2006) Poelman, D. R. & Spaans, M. 2006, A&A, 453, 615
- Salyk et al. (2008) Salyk, C., Pontoppidan, K. M., Blake, G. A., et al. 2008, ApJ, 676, L49
- Schöier et al. (2005) Schöier, F. L., van der Tak, F. F. S., van Dishoeck, E. F., & Black, J. H. 2005, A&A, 432, 369
- Woitke et al. (2009) Woitke, P., Kamp, I., & Thi, W.-F. 2009, A&A, in press, astro-ph 0904.0334, (Paper I)