Searching for hep Neutrinos using the Sudbury Neutrino Observatory
Abstract
The Sudbury Neutrino Observatory has recently finished its third and final phase, and has accumulated over 1082 days of neutrino data, spanning the energy range from approximately 5-20 MeV. Almost all the observed neutrinos are due to the 8B reaction in the Sun. The so-called hep process ( 3He + p 4He + e+ + ) also occurs in the Sun, but has not yet been observed. The hep neutrino energy endpoint extends above the 8B spectrum. This paper describes the three phase analysis that will ultimately be the most sensitive to this reaction.
1 SNO Overview
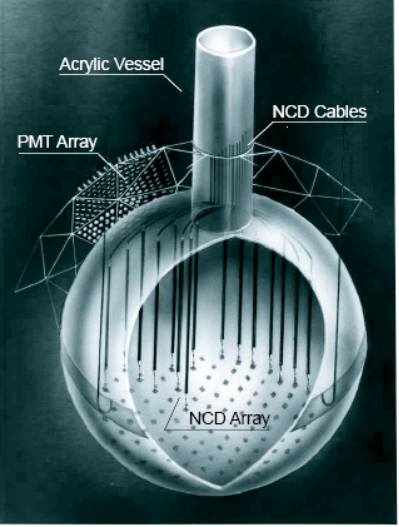
The Sudbury Neutrino Observatory is located near Sudbury, Ontario, Canada, two kilometres underground in Vale INCO’s Creighton mine. This location uses the 6000 metre water equivalent (two km of norite rock) overhead as a shield against cosmic rays. The detector itself is a one-kilotonne ultra-pure heavy water Cerenkov light detector[1]. The heavy water (D2O) is contained in a 12 metre diameter spherical acrylic vessel (AV), surrounded by a 17.8 metre geodesic photomultiplier support structure (PSUP). This frame houses nearly 10,000 photomultiplier tubes. To shield the heavy water from external backgrounds and help support the AV the remainder of the cavity is filled with light water.
Neutrinos can exist in three probability states known as flavours[2]. SNO has the unique ability to detect all three neutrino flavours via the reactions:
| (1) |
| (2) |
| (3) |
These equations describe the charged current (CC), neutral current (NC) and elastic scattering (ES) reactions, respectively. The charged current reaction is only sensitive to the flavour, but the neutral current reaction is sensitive to any of the three flavours, , where can be , , or . All prior solar neutrino experiments showed a deficit of neutrinos to the predicted rate by the standard solar model (SSM)[3][4][5][6]. SNO’s sensitivity to both NC and CC allowed SNO to distinguish an oscillation scenario () from a solar model scenario (). SNO solved the solar neutrino problem by showing that the rate of NC reaction events agreed with the number predicted by the standard solar model[7], while the rates of CC reaction events and ES events were consistent with oscillations in which two-thirds of the neutrinos at the Earth are not neutrinos.
The SNO experiment was done in three phases. Each phase employed a different technique to detect neutrons. The first phase looked for neutron capture on the deuterium[7]. The second phase involved the addition of NaCl salt to the active volume[8]. Chlorine has a larger cross section for neutron capture and thus improved the efficiency of the NC reactions and this increased the statistical precision. The third and final phase of SNO removed the NaCl and added 3He proportional counters in the active volume[9]. The counters were referred to as neutral current detectors (NCDs). The advantages were to increase the efficiency for the detection of the NC reaction, as compared to pure D2O, and to allow event-by-event particle identification.
2 The hep Neutrinos
The Sun produces neutrinos through many reactions, and their respective energy spectra are shown in Figure 3. The hep reaction extends to the highest energy, but is rare compared to the 8B signal which overwhelms the hep signal until near 15 MeV. The hep neutrinos are produced at a larger radius than other solar neutrinos, as shown in Figure 3, and can therefore test different parameters of the solar model.

3 The hep Analysis
The SNO experiment was designed to search for solar neutrinos mainly from the 8B reaction. This has been done in each of the three phases as discussed is Section 1. The hep reaction has never been detected and falls in SNOs accessible energy region, so a search should be conducted. SNO has previously searched using only the first phase of data, and sets the best limit on the hep neutrino flux [11]. The first SNO hep search was conducted using a box analysis which was a simple counting experiment in a predefined energy region with no spectral information used. Our analysis will be a spectral analysis.
The hep neutrino analysis must be able to use the high energy tail from the hep energy spectrum to distinguish hep neutrinos from 8B neutrinos. It must also be able to permit for a signal extraction when one or more of the signals have very few events. We will use Markov Chain Monte Carlo (MCMC) with a Metropolis-Hastings algorithm [12] to extract the number of hep neutrinos. This will be done using all three phases of the SNO data set, totaling about 1082 days of livetime.
The MCMC method will be applied in a Bayesian analysis, so a prior, , needs to be applied. We chose the prior shown in Equation 4
| (4) |
where is any signal in the fit. This prior returns a posterior distribution that represents the likelihood. In other words, the MCMC will map out the likelihood space. This has the advantage of producing a parameter that cannot be negative and allows us to easily set a 90% confidence limit. Equation 5 shows how we will define the confidence limit[13]:
| (5) |
where is for a 90% confidence limit, is the posterior distribution as determined by the MCMC method and is the number of events at the desired confidence limit. Figure 4 shows this integration and was created by running the signal extraction over a data set made up of Monte Carlo events.
4 Conclusion
Our analysis has an improvement of more than a factor of three in statistics, meaning more than a factor of in our expected sensitivity. Our analysis also takes into account the shape of the energy spectrum which was lost in the box technique. This will be the best limit on the hep flux for SNO.
References
- [1] Boger J et al. 2000 Nuclear Instruments and Methods in Physics Research Section A: Accelerators, Spectrometers, Detectors and Associated Equipment 449 172 – 207 ISSN 0168-9002
- [2] Bahcall J N 1989 Neutrino Astrophysics (Cambridge University Press)
- [3] Davis Jr R 1964 Phys. Rev. Lett. 12
- [4] Anselmann P et al. (GALLEX) 1992 Phys. Lett. B285 376–389
- [5] Abazov A I et al. 1991 Phys. Rev. Lett. 67 3332–3335
- [6] Hirata K S et al. 1989 Phys. Rev. Lett. 63 16–19
- [7] Ahmad Q R et al. (SNO) 2001 Phys. Rev. Lett. 87 071301 (Preprint nucl-ex/0106015)
- [8] Aharmim B et al. (SNO) 2005 Phys. Rev. C72 055502 (Preprint nucl-ex/0502021)
- [9] Aharmim B et al. (SNO) 2008 Phys. Rev. Lett. 101 111301 (Preprint 0806.0989)
- [10] Bahcall J N, Serenelli A M and Basu S 2005 Astrophys. J. 621 L85–L88 (Preprint astro-ph/0412440)
- [11] Aharmim B et al. (SNO) 2006 Astrophys. J. 653 1545–1551 (Preprint hep-ex/0607010)
- [12] Hastings W K 1970 Biometrika
- [13] Cowan G 1998 Statistcal Data Analysis (Oxford Science Publications)