FROM JADE EVENT SHAPES
Event shape data from annihilation into hadrons collected by the JADE experiment between and 44 GeV are used to determine the strong coupling . QCD predictions complete to next-to-next-to-leading order (NLLO), alternatively combined with next-to-leading-log-approximation (NLLA) are used. The stability of the NNLO and NNLO+NLLA results with respect to variations of the renormalisation scale is improved compared to previous results obtained with next-to-leading-order (NLO) or NLO+NLLA predictions. The energy dependence of agrees with the QCD prediction of asymptotic freedom and excludes absence of running with 99% confidence level.
1 Introduction
The determination of the strong coupling in Quantumchromo Dynamics (QCD) is an important test of the theory [1, 2, 3]. The analysis of hadron production in annihilation with observables based on jet production and event shape definitions plays a major role, because in the environment there is no interference between intial and final state and one generally has a clean experimental environment with small background rates and neglegible pileup. Recently the NNLO corrections for QCD predictions of event shape observable distributions [4, 5] and moments [6] were completed and used for a measurement of using data of the LEP experiment ALEPH [7]. It is therefore of high interest to measure with JADE data and the same improved QCD predictions [8]. We also include matching of existing NLLA QCD calculations with the new NNLO calculations [9].
The JADE experiment operated at the PETRA collider at DESY from 1979 to 1986 at centre-of-mass (cms) energies to 44 GeV. Significant data samples were recorded at and 43.8 GeV. The JADE detector is described in [10]. The JADE experiment combines tracking of charged particles in a solenoidal magnetic field and electromagnetic calorimeters over a large solid angle. This allows to select hadronic final states with high efficiency while demanding that the events are fully contained in the detector. The JADE reconstruction, simulation and analysis software was ported to current computers [11] and is used in our work.
At the JADE energies background processes relevant for hadron production are with subsequent hadronic decays and two-photon interactions with hadronic final states. Initial state radiation (ISR) of photons from the beam particles also occurs with a significant rate leading the production of hadronic final states at reduced cms energy. After application of suitable event selection cuts based on 4-momentum balance and particle multiplicity the background processes can be neglegted. Residual effects of ISR are corrected for.
2 Data Analysis
The distributions of event shape observables are computed from all selected events, and from samples of simulated events at several levels. The final state after termination of the parton shower is called parton-level, the final state after hadronisation and decays of particles with lifetimes shorter than 300 ps is called hadron-level, and after passing the events through the JADE detector simulation, recontruction and analysis procedures the result is called detector-level. We use the programs PYTHIA, HERWIG and ARIADNE tuned by the OPAL collaboration for this purpose, see [8] for details.
The contribution of events is subtracted from the distributions using simulated events at detector-level. The results are multiplied by the ratio of simulated hadron- and detector-level distributions to correct for experimental acceptance and resolution. In this way we obtain distributions of event shape observables corrected to the hadron-level. A comparison of observed and corrected event shape distributions with predictions by the Monte Carlo simulations shows satisfactory agreement.
3 Determination of
The hadron-level distributions are compared with the QCD predictions corrected for hadronisation effects by a -method with as a free parameter and the full statistical covariance matrix. The hadronisation corrections for the QCD predictions are found for cumulative theory predictions by dividing cumulative distributions at hadron- and parton-level. In order to justify this procedure we compare simulated distributions at parton-level with the NNLO QCD calculations for and find reasonable agreement as shown in figure 1 (left). The program PYTHIA is used in the standard analysis and HERWIG and ARIADNE are used as alternatives.
 |
 |
Only restricted regions of the distributions are used for the fits, i.e. those where the experimental and hadronisation corrections are stable and where the QCD predictions have LO contributions and don’t have large logarithmically enhanced terms [8]. The resulting fit ranges are the same for all energy points and are shown on figure 1 (right) for .
The experimental uncertainties are found by repeating the analysis with varied selection cuts and procedures. The uncertainties from the hadronisation corrections are determined by comparing fit results obtained with PYTHIA, HERWIG or ARIADNE. The theoretical uncertainties are found by changing the renormalisation scale parameter from its standard value to or 2.0.
Figure 1 (right) shows the NNLO+NLLA QCD predictions using the fit results for superimposed over the hadron-level data for . The agreement between data and theory is excellent for both NNLO and NNLO+NLLA fits. For example, the values for with NNLO fits range from 0.7 (14 GeV) to 2.5 (34.6 GeV). The root-mean-square (RMS) values of results from NNLO+NLLA fits to the six observables are between 0.007 (22 GeV) and 0.003 (44 GeV), consistent with the theory uncertainties of the combined values (see below). This is an important cross check made possible by having six different observables in the analysis.
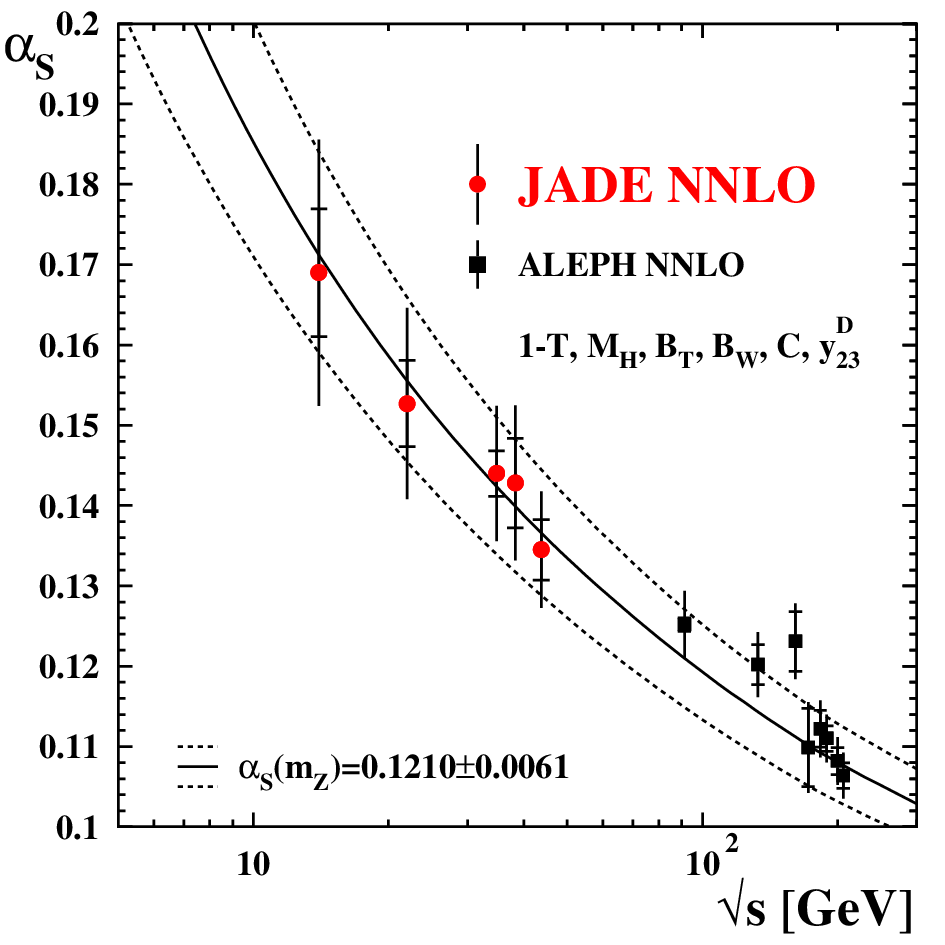
We combine the results from the six observables at each energy point as in [13, 2] and show the results of the NNLO analysis in figure 2 together with the results of [7]. The result of combining the combined values of after evolving to the reference scale is shown as lines in the same figure. The final result using this combination is for NNLO
and for NNLO+NLLA
 |
 |
Our final result from NNLO+NLLA predictions has the smaller uncertainties of 4%. It is consistent with previous determinations of using NNLO theory [7] and with with recent averages of [1, 2, 3]. Repeating the combination of the combined NNLO+NLLA results at each energy point without evolving to a common reference scale results in a probability of assuming partially correlated hadronisation uncertainties and ignoring theory uncertainties. We interpret this as strong evidence for the dependence of the strong coupling on cms energy as predicted by QCD from JADE data alone.
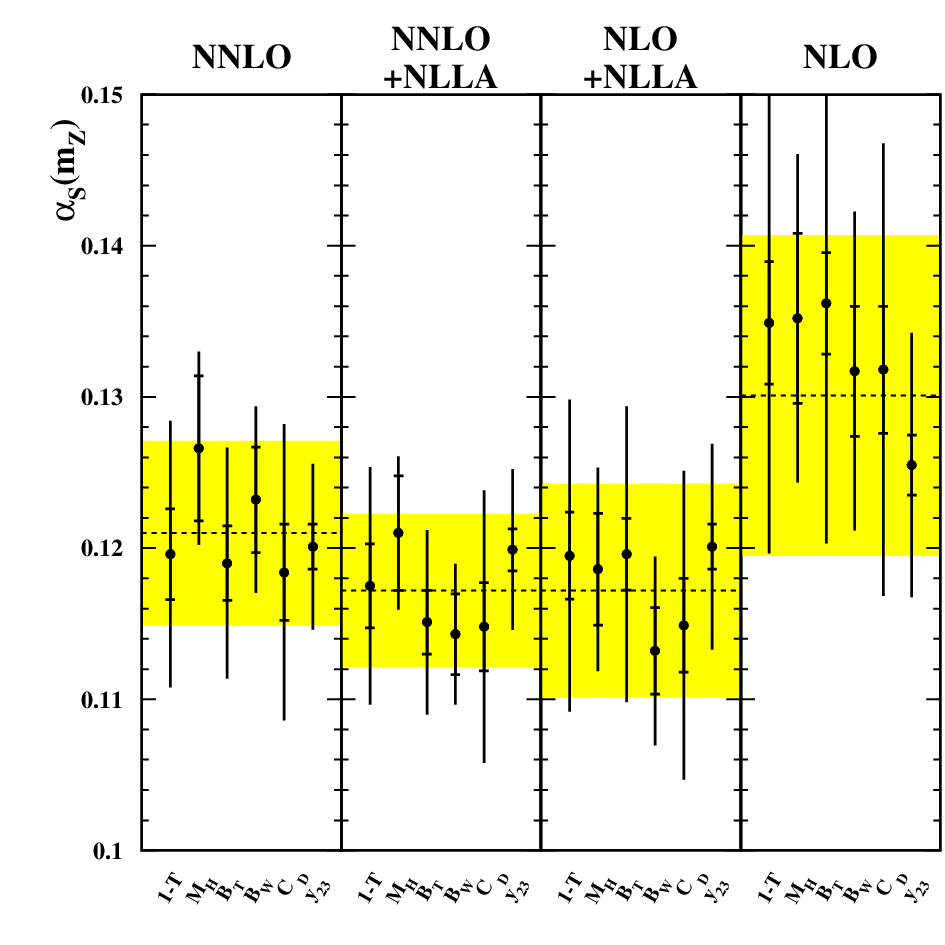
Comparison with NLO and NLO+NLLA fits using the same data, hadronisation corrections and fit ranges gives consistent results. The theory uncertainty of the NLO+NLLA analysis is larger by about 60% compared with our NNLO or NNLO+NLLA results. The theory uncertainty of the NLO analysis with fixed renormalisation scale is larger by a factor of 2.6 compared with the NNLO analysis. Figure 2 (right) shows a summary of the different analyses. The smaller theory uncertainties of the NNLO or NNLO+NLLA analyses compared with NLO or NLO+NLLA analyses follow from the weaker dependence of the NNLO calculations on the renormalisation scale parameter [8].
4 Summary
We have shown a determination of the strong coupling constant with NNLO and NNLO+NLLA QCD calculations using JADE data. The final result has a competetive uncertainty of 4% and is consistent with other measurements. Our data confirm the running of as predicted by QCD.
References
- [1] S. Bethke, Prog. Part. Nucl. Phys. 58, 351 (2007)
- [2] S. Kluth, Rept. Prog. Phys. 69, 1771 (2006)
- [3] Particle Data Group Coll., C. Amsler et al., Phys. Lett. B 667, 1 (2008)
- [4] A. Gehrmann-De Ridder, T. Gehrmann, E.W.N. Glover, G. Heinrich, J. High Energy Phys. 12, 094 (2007)
- [5] S. Weinzierl, MZ-TH-08-22 (2008), arXiv:0807.3241
- [6] A. Gehrmann-De Ridder, T. Gehrmann, E.W.N. Glover, G. Heinrich, ZU-TH-04-09, IPPP-09-15 (2009), arXiv:0903.4658
- [7] G. Dissertori et al., J. High Energy Phys. 02, 040 (2008)
- [8] JADE Coll., S. Bethke, S. Kluth, C. Pahl, J. Schieck, MPP-2008-131 (2008), arXiv:0810.1389, Sub. to Eur. Phys. J. C
- [9] T. Gehrmann, G. Luisoni, H. Stenzel, ZU-TH-04-08 (2008), arXiv:0803.0695, Acc. by Phys. Lett. B
- [10] B. Naroska, Phys. Rep. 148, 67 (1987)
- [11] P.A. Movilla Fernández. Ph.D. thesis, RWTH Aachen, 2003, PITHA 03/01
- [12] M. Dasgupta, G.P. Salam, J. Phys. G 30, R143 (2004)
- [13] OPAL Coll., G. Abbiendi et al., Eur. Phys. J. C 40, 287 (2005)