Determining Star Formation Timescale and Pattern Speed in Nearby Spiral Galaxies
Abstract
We present a revised method for simultaneous determination of the pattern speed () and star formation timescale () of spiral galaxies, which is originally proposed in our previous work. As this method utilizes offsets between molecular and young-stellar arms, we refer to it as the “Offset Method”. Details of the method, its application, and results for CO and H images of 13 nearby spiral galaxies are described here. CO data are from our observations with the Nobeyama Millimeter Array for 2 galaxies, and from the BIMA SONG for the rest. Out of 13 galaxies, we were able to derive and for 5 galaxies. We categorize them as “C” galaxies as their offsets are clear. Our findings from these galaxies are as follows. (1) The corotation radius calculated by the derived is close to the edge of the CO data, and is about half of the optical radius for 3 galaxies. (2) The derived is roughly consistent with the free-fall time of typical molecular clouds, which indicates that the gravitational instability is the dominant mechanism triggering star formation in spiral arms. (3) The is found to be almost independent of surface density of molecular gas, metallicity, or spiral arm strengths. The number of “C” galaxies and the quality of CO data, however, are not enough to confirm these relationships. We also find that 2 other galaxies show no offsets between CO and H, although their arms are clearly traced, and categorize them as “N” galaxies. The presence of a bar could account for this feature, since these 2 galaxies are both barred. With one galaxy excluded from our analysis due to its poor rotation curve, offsets of the remaining 5 galaxies are found to be ambiguous. Either their dependence on the rotational frequency cannot be explained by our picture, or the number or quality of data is not sufficient for the analysis. We categorize them as “A” galaxies. The possible reasons for this ambiguity are (1) the density wave is weaker, and/or (2) observational resolution and sensitivity are not enough to detect the spiral arms and their offsets clearly. The former is supported by our finding that the arm strengths of “A” galaxies are slightly weaker than that of “C” galaxies.
Keywords:
galaxies: fundamental parameters — galaxies: individual (NGC 0628, NGC 3184, NGC 3938, NGC 4254, NGC 4303, NGC 4321, NGC 4535, NGC 4736, NGC 5194, NGC 5248, NGC 5457, NGC 6181, NGC 6946) — galaxies: spiral — ISM: Hii regions — ISM: moleculesI Introduction
I.1 Pattern Speed
Ever since the spiral density wave theory was proposed by Lin & Shu [53] to solve the winding problem of spiral arms, it has been known as the most successful theory to explain observational features of spiral galaxies. The pattern speed (), defined as the angular rotational velocity of a spiral pattern or underlying gravitational potential, is one of fundamental parameters in the density wave theory, since it determines the existence and location of kinematical resonances.
The one that has been extensively discussed is the “Corotation Resonance” (CR), described as
| (1) |
where is the angular rotational velocity of materials. This equation means that at the CR, the rotational speed of materials and the pattern are the same. The radius , which satisfies this equation, is called the “Corotation Radius”. As the rotation speed of gas in the pattern-rest frame becomes small around the CR, a galactic shock [29, 66] would not occur. Since galactic-scale star formation is thought to be enhanced by this shock, star formation should be less efficient around the CR. As the relative velocity of materials viewed from the pattern changes its sign at the CR, the direction of streaming motions due to the galactic shock should be different between the inside and outside of the CR. These observable features have been used to locate the CR as described later in this section.
Another important resonance is the “Lindblad Resonance” (LR), which is defined by
| (2) |
where is any integer but a frequency of the strongest modes or the number of arms is mostly used, and is the epicyclic frequency, which is expressed as
| (3) |
With an assumption that spiral arms are tightly winding, the dispersion relation for the stellar disk is different from that of a gaseous disk [6], so that gases and stars are theoretically predicted to show different behaviors at the resonances.
As described above, the pattern speed not only locates the resonances, but also influences the star formation activities. Therefore, its determination is very important to the study of galaxies. It cannot be determined directly from observations, however, since the pattern structure is not a material structure but a density wave.
Several methods have been proposed for its determination. The earlier and common technique is to locate specific resonances on radii where some properties of arms change. Roberts et al. [67] adopted for 24 galaxies so that the corotation radius is nearly coincident with the radius where arms of Hii regions disappear, or the radial extent of the “easily visible” disk. Elmegreen et al. [24] used -band images to locate 5 resonances for 18 galaxies. Such techniques are, however, subject to uncertainties regarding the sensitivity and/or resolution of the imaging observations. In addition, the tracers used must be carefully considered, since stars and gases can behave differently at resonances and their distributions are not identical.
Cepa & Beckman [10] derived the star formation efficiency (SFE) in the arm and interarm region for NGC 628 and NGC 3992 from H and Hi data. The arm-to-interarm ratio of the SFE is expected to be larger than 1 as the star formation is thought to be enhanced in arm regions, but they found that its value drops to almost unity at a certain radius. Since star formation at spiral arms are thought to be less efficient around the CR, they concluded that this radius is the corotation radius. It is difficult to derive the SFE values in interarm regions, however, since there are fewer stars and gases than in arm regions, and thus sensitive observations are required.
For our Galaxy, a time periodicity of the star formation history of about 0.5 Gyr has been found at the solar neighborhood [35, 17]. Assuming that this periodicity is due to the passage of a spiral potential and that the potential has a two-armed pattern as suggested by Drimmel [20], the pattern speed can be calculated as km s-1 kpc-1. A consistent result from numerical simulations of the stellar and gaseous response to the spiral potential are presented by Martos et al. [57]. These results for the Galaxy also indicate a strong relationship between the star formation and the spiral potential.
Canzian [7] showed that the residual velocity field, obtained by subtracting the axisymmetric component from the observed velocity field, should be different inside and outside the corotation radius, and thus a change in direction of the non-axisymmetric component of the velocity field could be used to locate the CR. Sempere et al. [70] and Canzian & Allen [8] applied this method to Hi and H data of NGC 4321, respectively, and they obtained a comparable location of the CR. Since this method requires precise kinematical information over the entire disk, a velocity field covering the whole galaxy with high velocity and spatial resolution is essential.
Tremaine & Weinberg [78] presented a method which did not use any morphological locations of resonances, but used the continuity equation for a surface brightness of galaxies. This method is called the “Tremaine-Weinberg method” (hereafter TW method). As it is based on the continuity equation, it has been applied mostly to early type galaxies [59, 31, 16, e.g.,], whose star formation is less active than that of late type galaxies. In recent studies, however, Hi and CO data have come to be used for the application to gas-dominated, late type galaxies [88, 94, e.g.,]. Meanwhile, Debattista [15] showed by -body simulations that the results of the TW method is sensitive to the uncertainty in adopted position angle (P.A.) of outer disk. Rand & Wallin [64] applied the TW method to CO data of nearby galaxies with varying P.A.s and confirmed that the uncertainty in P.A. made the error of the resultant larger. They also showed that the best-fitted only to the inner bar was larger than that of the remaining disk, even though the galaxy in interest was not classified as SB galaxy. Meidt et al. [58] used a modified method which explicitly allowed a radial variation of , and found multiple spiral patterns for the nearby spiral galaxy M 51 (NGC 5194) with outwardly decreasing . The dependence on P.A.s, however, was found to be still large.
The results of numerical simulations also show a large dependence of on kinematics and spiral structure [84, e.g.,], so that they can be used to derive the best value of by comparison with observations. Oey et al. [63] adopted an evolutional model of the Hii luminosity function to draw isochrones of massive stars, and fitted these isochrones to an observed distribution of Hii regions to derive . These approaches, of course, depend on their modelings, and often have difficulty estimating the accuracy of the derived values and the effect of other parameters on the results.
I.2 Star Formation Timescale
Since all the physical processes from molecular clouds to young stars are not yet clearly understood, especially for massive objects, it has been difficult to derive a timescale for star formation from a theoretical point of view. A number of numerical simulations regarding the GMC formation and successive star formation have been performed [82, 85, e.g.,] and have inferred on the timescale, but the full processes are not traced since the dynamic range of the size scale and the number of processes are too large to be included in calculations. Instead, it is common to estimate ages of Hii regions from equivalent widths of emission lines from ionized gas, such as H and H, on the basis of population synthesis models, which do not require any information about the parental molecular clouds.
Leitherer et al. [52] compiled physical processes and parameters for star formation such as the initial mass function, star formation history, and metallicity, to provide the package Starburst99 to calculate observable properties such as colors, spectra, equivalent widths, and luminosity. Bastian et al. [5] estimated the equivalent width of H emissions and derived ages of star cluster complexes in NGC 5194 as 5–8 Myr using this package assuming solar metallicity. Even if twice the solar metallicity is assumed, the derived ages do not change largely. They also applied the GALEV SSP models [2] to optical colors of individual star clusters and found the ages of the majority of the clusters to be 4–10 Myr. With spectroscopic observations of the Br line, Grosbøl et al. [32] derived ages of -band knots, presumably sites for massive star formation, to be about 7–10 Myr for the nearby spiral galaxy, NGC 2997. They also found that these knots were located slightly upstream from the smooth peak of -band flux, regarded as the potential minimum of the spiral arm.
We should note that ages derived from models depend on parameters used in the model, and that the exact age is often difficult to determine due to degeneracies between internal extinction, mass, and metallicity. In addition, this age only represents the timescale from a newly formed star, and thus has no information about the molecular cloud collapse in contrast with the timescale we take into account in this paper.
As described above, it is in principle difficult to determine the pattern speed and star formation timescale from observations, although they are both important parameters for understanding kinematics and star formation activities in spiral galaxies. In this paper, we propose a method to determine both parameters simultaneously. We refer to this method as the “Offset Method” as it uses offsets between CO and H arms. This method is a revised version of what we have presented in a previous paper [21]. To apply this method, we have obtained CO, H, and rotation curve data from our observations and the literature.
We describe the basic idea and characteristics of the method in §II, and processes of the application in §III, followed by results in §IV, which includes a categorization of the sample, discussions for individual galaxies, and properties of each category. We discuss derived parameters and the validity of the offset method in §V, and conclude this paper by giving a summary in §VI.
II Offset Method
This “Offset Method” is proposed for simultaneous determination of the pattern speed and star formation timescale by the use of offsets observed in spiral galaxies. As the basics of this method have been presented by our previous paper [21], we repeat important concepts and explain several modifications here.
II.1 Basic Idea and Formulation
For simplicity, we assume that the spiral pattern is rigid, and that materials in the disk rotate in pure circular orbits. The former assumption means that the spiral structure is sustained by the density wave, and that the pattern speed () is constant. The velocity fields of most disk galaxies show a spider diagram pattern, which is a velocity field that results from pure circular rotations. The streaming motion and the velocity dispersion generates some non-circular motions, but they are typically about 10–50 km s-1 [1, 13, 50, e.g.,], which is small compared to the circular rotational velocity of around 200 km s-1. These observational results support the latter assumption. We should note that we do not consider nor include any bar structures in our analysis, since the pattern speed of the bar would be different from that of spiral [84, e.g.,] and particles within the bar potential move in elliptical orbits with higher eccentricity.
We define the star formation timescale, , as the average time for the massive star formation from molecular clouds in spiral arms, which are agglomerated or compressed by the spiral structure. If the physical processes of star formation at spiral arms do not vary extremely with radius, this timescale can be regarded as a constant parameter representing a typical value of the entire disk. We should note again that this timescale would be different from ages of Hii regions mentioned in §I.2, since includes the time needed for clouds to be collapsed.
Figure 1 illustrates our concept regarding the relationship between the spiral structure and star formation processes inside the CR, where . If we observe a face-on spiral galaxy at (the left panel), at the same galaxy will be observed as in the right panel and the offset distance between the arm of young stars and molecular clouds, , can be written as
| (4) |
where is the velocity of materials, and is the velocity of the pattern. If the outside of the CR is taken into account, massive stellar arms will be seen on the concave side of molecular arms, and will be negative.
Dividing both sides of equation (4) by radius [kpc], we obtain
| (5) |
where , , and is the azimuthal offset. This equation shows the relation between two observables, and , and we can rewrite it as
| (6) |
Assuming to be constant over the spiral disk, is a linear function of , since is also assumed to be constant. Therefore, by plotting against and fitting them with a line, both and can be simultaneously determined as a horizontal-axis intercept and gradient of the fitted line, respectively.
The fitting is performed by the least method and each data point is weighted by errors in both axes, and . The inclusion of the uncertainty in and the use of the least method for the fitting are major methodological revisions from what we presented in the previous paper.
II.2 Uniqueness and Merits
One major advantage of the offset method is its independency from the tight-winding approximation for spiral structure and any models for cloud collapse and population synthesis. The results thus will provide constraints or parameters to theories and models of both galactic dynamics and star formation on the basis of observational data.
Another uniqueness is that it gives and simultaneously, as described in the previous section. Measuring offsets in a wide range of radii makes this possible. In addition, statistical uncertainties of both and are determinable by the fitting. We should emphasize that this is the first method proposed that derives observationally with quantitative estimates of statistical errors.
II.3 Requirements for Application
Application of the offset method, requires tracing both molecular and young-stellar arms at a wide range of radii. Nearby galaxies with small inclination angle satisfy this requirement, while distant and highly-inclined galaxies do not. Grand-design galaxies are usually preferable to see spiral structures. We do not pay attention to whether a galaxy has a bar in its center or not, since we put importance on spiral structures only and exclude bar regions from the analysis, if any. Images used in the analysis should have sufficient quality to detect and resolve spiral arms. For our application, CO and H images are used to trace molecular gas and young stars, respectively.
In addition to the image maps, we need information about the rotational velocity. As the line-of-sight velocities of an almost face-on galaxy do not give velocities parallel to the disk, the inclination angle must not be close to zero. The velocity data are available from spectroscopic observations in the optical and radio wavelengths.
In short, we need nearby spiral galaxies which are moderately inclined and show clear CO and H spiral structures. To satisfy these requirements, we observed two nearby spiral galaxies, NGC 4254 and NGC 6181, in the 12CO(1–0) line with the Nobeyama Millimeter Array (NMA). For NGC 4254, we have combined the single dish data from Kuno et al. [51] with the NMA data to recover the missing flux. Details of the observations and data reduction will be presented in another paper. In addition to our data, we selected 11 galaxies from BIMA SONG [34]. The whole sample of 13 nearby spiral galaxies is described in §III.1.
III Data Analysis
III.1 Property of Sample Galaxies
In order to apply the offset method, we selected 13 nearby spiral galaxies. The selection criteria are that the galaxy shows a molecular spiral structure in CO data, and that its inclination angle is small but not zero. As we pay attention to spiral structures of molecular gas and Hii regions in the analysis, we do not take into account the bar type nor arm class (AC) from Elmegreen & Elmegreen [22] for the selection. For these sample galaxies, we obtained H images and rotation curve data from the literature. Most of the images were obtained via the NASA/IPAC Extragalactic Database (NED).
The general properties of our sample are listed in Table 1. Out of the 13 galaxies, 6 are classified as SA (no bar), another 6 are classified as SAB (weakly barred), and 1 is classified as SB (strongly barred). Regarding the AC, 12 are grand-design galaxies (AC=9 or 12), and 1 is a flocculent galaxy (NGC 4736, AC=3).
We show CO contours overlaid on an H image for the sample galaxies in Figure 2. Properties of the data are listed in Table 2. The spatial resolution of CO data is about –, and typically 500 pc at the galaxy’s distance. As it is comparable to the typical value of offsets and arm widths, the CO data quality should be sufficient to resolve offsets for most of the sample galaxies. The H image seeing is typically about , which is smaller than that of CO.
III.2 Rotation Curve
In general, rotation curves (RCs) are obtained from spectroscopy, such as optical slit observations and radio mapping observations. With the CO data cube, we made velocity field maps and applied the task GAL in the AIPS software in order to derive the RCs.
This task fits the tilted-ring model to the velocity field, we simultaneously derive the kinematical center, systemic velocity, position angle of major axis (P.A.) and inclination of galactic disk (), in addition to the rotational velocity (). Initial guesses for the fitting are the observing center for kinematical center, values from BIMA SONG, Sofue et al. [73], or RC3 [19] for P.A., , and systemic velocity. For the BIMA data, however, inclination angles were derived to be about 90 degree for almost all galaxies, although the sample was selected to be nearly face-on. This discrepancy is presumably due to the clumpiness of CO distributions, and we use values of from the literatures (BIMA SONG, Sofue et al. [73], or Daigle et al. [14]). Derived parameters from this procedure are listed in Table 3, with adopted values for P.A. and .
Fixing all the parameters except for , the rotation curve with statistical errors can be calculated from the velocity field. We could not derive meaningful kinematical parameters for 3 galaxies (NGC 3184, NGC 4535, and NGC 4736) out of 13 galaxies, however. For NGC 3184 and NGC 4736, the kinematical center could not be determined. For NGC 4535, the kinematical center and the systemic velocity could be determined, but the rotational velocities were not properly derived at some radii. This failure could be attributed to that CO data for NGC 4736 are rather noisy and those for the other 2 galaxies do not contain single-dish data, so that the flux from extended components are resolved out. For the remaining 10 galaxies we derive rotational velocities, but some of them are limited in the range of radii or have larger errors in the outer regions.
Given that RCs from CO are not sufficient for all the galaxies, we searched the literature for RCs with a wider range of radii. Sofue et al. [73] compiled data from optical (H and [Nii] line) and radio (CO and Hi line) observations to present central-to-outer rotation curves for nearby spiral galaxies. Daigle et al. [14] observed a part of the SINGS galaxies in the H line via Fabry-Perot spectrometry and obtained kinematical information and rotation curves in the same way as in this study.
In Figure 3, available rotational velocities multiplied by the sine of the assumed inclination angle () are plotted against radius. In the central regions, rotational velocities from Sofue et al. [73] are larger than those from the others, while in outer regions Sofue et al. [73] and Daigle et al. [14] give almost consistent results. This difference is principally due to that Sofue et al. [73] traces terminal velocities in a position-velocity diagram, while Daigle et al. [14] and this study trace intensity-weighted velocities, and that these two velocities are known to be often substantially different in the inner regions. RCs from CO data generally follow those from Daigle et al. [14] but drop around the outer edge of the CO map.
From these available RCs, we selected which to use considering errors and radial coverage, in the following analysis. In principle, we try to avoid the use of CO data, since they are not reliable in the outer regions. Although not all the data are consistent each other, most of them are in good agreement where we measure the offsets. For some galaxies, however, a poor RC makes the application of offset method difficult, indicating the uncertainty of the results could be underestimated. We could not obtain a satisfactory RC for NGC 4535, so we decide to exclude this galaxy from the following analysis. Available RC data and the choice of RC are summarized in Table 2.
III.3 Phase Diagram and Offsets
The image analysis was started by checking the coordinates of CO and H data. If the coordinates of H images are incorrect or not available, foreground stars seen in the -band image with the same field of view as H were used to derive the coordinates. The Aladin Sky Atlas was used to obtain the coordinates of foreground stars and the task ccmap of IRAF was used to calculate and register the image coordinates.
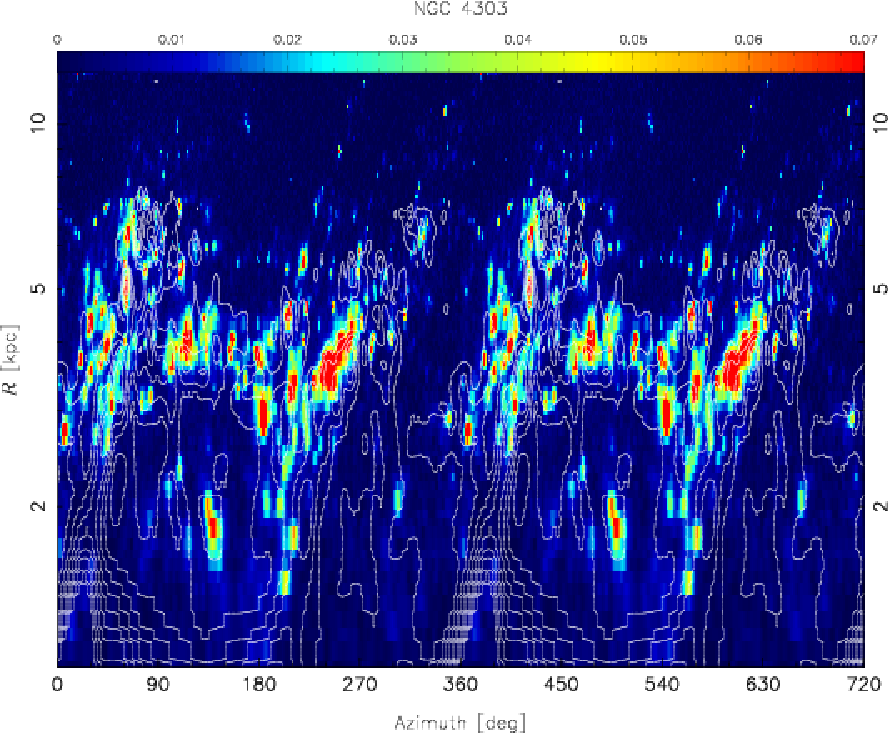
Projected images of galaxies in the (RA, Dec) coordinate were transformed into deprojected images in the polar coordinate (radius , azimuth ), by the use of the task pgeom of AIPS with the dynamical center derived above and adopted values of P.A. and listed in Table 3. For NGC 3184 and NGC 4736, whose dynamical centers could not be derived, the center of the CO map, which is almost the same as the NED position, was adopted. In Figure 4, we show CO contours on an H image in the (, ) coordinates for 12 galaxies whose RC are available. Images in this coordinate, called the phase diagram, are used to recognize spiral arms, since spiral arms are often expressed as , where is the pitch angle of arms, and appear as a line in this diagram.
To measure the offset, we first derived the average flux density in for each azimuthal angle. The step in radius was set to a value ranging from one-third to half of the CO beamsize. Then, peaks of CO and H flux belonging to a spiral arm were searched, and the offset was measured as the azimuthal separation of CO and H peaks.
III.4 The Plot and Fitting
The measured offsets () were plotted against in Figure 5. The error bar in corresponds to the spatial resolution of CO data, which is the largest factor of uncertainty in . The uncertainty in is calculated from errors of the RCs. Since errors of RCs from Sofue et al. [73] were not available, we assumed an error of km s-1. The least method was used to fit the plot and to derive and with errors. The inclusion of the uncertainty in and the use of the least method for the fitting are major revisions from what we have presented in the previous paper. Results from the fitting procedure are presented in §IV.
IV Result
As described in the previous section, we show a plot of against for 12 sample galaxies in Figure 5. For several galaxies with a substantial number (about 20 or more) of offsets, offset distributions for each arm are shown by different symbols. We found that the distribution varies with galaxies, and that for some galaxies, can even show a negative dependence on , which is not explained by our picture or Figure 1. From these plots and the CO and H images, we categorized the sample galaxies into 3 types as
- C:
-
galaxies with clear offsets, which show clear spiral structures in CO and H, and the fit to their plot results in and ,
- N:
-
galaxies with no offsets, which show clear spiral structures, but their offsets in arm regions are almost zero,
- A:
-
galaxies with ambiguous offsets, which cannot be categorized into the above two, mostly because their plot show a negative correlation or large dispersion (i.e., or ).
For our sample of 12 galaxies, we have 5 in C, 2 in N, and 5 in A. For the 5 galaxies in category C, we derived meaningful values of and by the fitting. Results of the fitting and the offset category are listed in Table 4.
Results and discussions for each galaxy are presented in §IV.1, and characteristics and differences in physical and observational parameters of the 3 categories are discussed in §IV.2. Discussions on the derived and are presented in §V.1 and V.2, respectively.
IV.1 Description for individual galaxies
IV.1.1 Galaxies with Clear Offsets
Here, we describe our results for “C” galaxies. The plot with the fitted line is shown in Figure 6. In Figure 7, we plot and as a function of radius to locate the kinetic resonances. We could derive the lower and upper limit of for 4 out of 5 “C” galaxies, while only the lower limit was derived for the remaining 1 galaxy, NGC 4303, whose uncertainty in is as large as itself. On the other hand, the insufficient quality of RC for some galaxies or at some radii hampers reliable derivation of , which makes it difficult to derive the Lindblad resonances. We could thus locate the ILR for NGC 5194 only.
Comparison with previous studies is also presented in this section. Values of and from this and other studies are listed in Table 5.
NGC 0628 (M 74)
We were able to measure 33 offsets between CO and H at kpc (), while was calculated from the RC of Daigle et al. [14] with a correction for the adopted inclination angle of 24 degree. We should note that even though the plot shows a large dispersion, the fitted line has a positive gradient since the outlying data with large errorbars have lower weights in the -fitting. Removing such data points with did not substantially change the fitted result. As offset distributions for the 2 arms appear to be consistent, we derive only one value for and .
From the derived value of and the RC, the corotation radius is calculated to be kpc, corresponding to . With kpc or located by Cepa & Beckman [10] from the arm/interarm ratio of SFE, Fathi et al. [26] derived km s-1 kpc-1 with the same RC which we used. We should mention that the discrepancy in is due to the difference in the assumed distance and inclination angle, and that the location of the corotation resonance is consistent within errors. However, Elmegreen et al. [24] examined the -band morphology of this galaxy and derived , which is larger than our result.
NGC 4254 (M 99)
For this 3-armed spiral galaxy, we were able to measure 18 offsets between CO and H for the arm1, extending from east to south, and arm2, extending from west to north, at kpc (). The difference in the distribution for the 2 arms is not clear, since the number of offsets is small for arm2 (see Figure 5). We could not measure any offsets for arm3, originating from the same position as the arm1 but with much smaller pitch angle extending to north, since the Hii regions were not well aligned where the CO emission delineates the arm.
This galaxy has an asymmetric structure, as one spiral arm (arm1) is much prominent than the other two, which could be explained by a ram pressure effect from intra-cluster matter in the Virgo cluster [36, 75]. In addition, a faint but large Hi structure, VIRGOHI 21, which might be interacting with this galaxy, has recently been found [33, 60] and is also thought to be responsible for the asymmetry. This global asymmetry could explain why only a few offsets could be measured in arm2, and none in arm3.
From the derived value of and the RC, the corotation radius was calculated to be kpc, corresponding to –. Our result is consistent with Kranz et al. [48], who used results from hydrodynamic simulations to locate the .
In our previous work, and were derived to be km s-1 kpc-1 and Myr, respectively, while this work gives km s-1 kpc-1 and Myr. The difference between the previous and current work is the fitting scheme, CO data (both in map and RC), and the adopted inclination angle. We have included the uncertainty in in the fitting procedure, and furthermore, the number of data and the radial range of RC have been increased by our new CO observations with 3 pointings with NMA. These two aspects should have improved the reliability of results. The assumed inclination angle is changed from to . However, since , this is not enough to explain the discrepancy in and (See §V.3). This implies that the uncertainties from the fitting could be underestimated.
NGC 4303 (M 61)
We were able to measure only 8 offsets between CO and H at kpc (), so that the uncertainty in is too large to derive for this galaxy. We only give the lower limit of kpc or .
As NGC 4303 has a double bar and an active nuclei, studies of this galaxy have concentrated on the dynamics and morphology in the central region. Colina & Wada [12] performed multiphase hydrodynamical simulations and derived Myr km s-1 kpc-1 for the nuclear bar. They locate the CR at the end of the nuclear bar, which is about in radius. On the other hand, Rautiainen et al. [65] derived for the outer bar with the size of . Although their gives close to our mean value of 24 km s-1 kpc-1, it is still unclear whether the bar and spiral arms have the same pattern speed. Koda & Sofue [45] calculated orbits in the bar from CO data, taken as a part of the Virgo High-Resolution CO Survey [74], and estimated ages of young clusters apparent in H to be Myr, which is consistent to our result of Myr.
NGC 5194 (M 51)
We were able to measure 41 offsets between CO and H at kpc (), and found that their dependence on is different for the 2 spiral arms. The offsets of arm2, directly connected to the companion galaxy NGC 5195, showed negative dependence on . We have therefore derived and by the -fitting to the offsets of arm1 only. The difference in the distribution for the 2 arms, may be attributed to the tidal interaction with the companion. This is because the interaction can cause asymmetry in the disk, and the outer part of the spiral arm connected to the companion could be a material arm.
From the derived and the RC, we calculate kpc, or , and the ILR to be at kpc, which is slightly outside of the inner edge of spiral arms. The derived values of in Table 5 span a range more than a factor of 2, indicating the difficulty of its determination. Zimmer et al. [94] derived to be about 40 km s-1 kpc-1, from the TW method using the 45m CO data [62], while Meidt et al. [58] applied the radial TW method to other CO data [72] and derived two pattern speeds of about 90 and 50 km s-1 kpc-1 for kpc and kpc, respectively, with a possible third pattern of km s-1 kpc-1 for kpc. As the results from Zimmer et al. [94] and this work are both between 50 and 20, derived by Meidt et al. [58], these three works are in good agreement. On the other hand, Knapen et al. [40] calculated the arm/interarm ratio of SFE along the two arms, and showed that positions of ILR, CR (at or 6 kpc), and OLR from Elmegreen et al. [23] were in good agreement with the minimum of this ratio. They also found that the pattern of this ratio along the position in arms is quite similar for the two arms, and claimed that some global triggering mechanisms for star formation should be at work. This pattern they found is not consistent with our result showing different offset distributions for the two arms, as well as the location of the CR.
Bastian et al. [5] estimated ages of Hii regions in this galaxy as Myr based on population synthesis models, and the derived value of is consistent to their ages. Recently published extinction-corrected distribution of star forming regions [39] and the latest CO observations with the 45m and CARMA [46] of this galaxy will be able to improve the current results in terms of reliability of location of Hii regions, the spatial resolution of CO map, and the quality of the rotation curve.
NGC 5457 (M 101)
We measured 10 offsets at kpc (). Although the data range in is rather narrow, we were able to derive and . We should note that the region where we measured offsets is only the central part of the whole disk, whose is .
Cedrés & Cepa [9] derived the H equivalent width from observations with narrow band filters, and estimated a mean age of Hii regions at to be about 1.6–4 Myr, supporting our result of Myr.
The fitted of km s-1 kpc-1 locates the corotation at kpc, or arcmin. Waller et al. [86] derived km s-1 kpc-1 using offsets between CO and FUV at , assuming the timescale from CO to FUV to be 3 Myr, locating . Elmegreen et al. [24] also located the corotation at from the optical appearance. This discrepancy implies a radial variance of the pattern speed or the inclination angle, which could be caused by interactions with companions, NGC 5474 and NGC 5477. If the inner disk where we measured offsets, is more inclined than the adopted inclination angle of , the resultant would be smaller or closer to other results mentioned above than the value presented here. In terms of the inclination, the adopted value for this galaxy is one of the smallest in our sample, implying a difficulty in deriving RC, which could be also inferred by the poor consistency in available RCs (see Figure 3). The uncertainties derived by the fitting, thus, could be underestimated.
IV.1.2 Galaxies with No Offsets
Here, we describe our findings for “N” galaxies in comparison with previous researches, and discuss why they do not show offsets. Values for from the literature are listed in Table 6.
NGC 4321 (M 100)
We measured 34 offsets at kpc (), and found that the offsets in the arm region ( kpc) are almost zero, while offsets close to the bar region ( kpc) are about 10 degrees, which had already been found by Sheth et al. [71]. There are several possible reasons for no offsets found in the arms: (1) material arms, (2) corotation at where offsets were measured, and (3) elliptical orbits nearly parallel to the spiral arms. Since there are offsets close to the bar region, where orbits should have higher ellipticity than in the arm region, (3) seems to be less plausible at least for this galaxy.
Rand & Wallin [64] derived the pattern speed of this galaxy to be km s-1 kpc-1 with the TW method applied to the CO data. With the rotation curve from Sofue et al. [73], this value locates the CR at about 10 kpc () in radius. Previous studies listed in Table 6 also suggest . These measurements are well beyond where we measured offsets, so cannot explain the lack of offsets.
The northern arm is weaker than the southern arm both in CO and H. This asymmetry is thought to be due to the existence of the companion galaxy NGC 4322, the ram pressure from intragalactic matter in the Virgo cluster, or the central bar. Knapen et al. [42] investigated the arm/interarm ratio of the SFE, and found no symmetric patterns though this ratio was larger than unity for most part of the two arms. They concluded that this was because their observed region did not include any resonances, although star formation on arms was actually enhanced and it might be triggered by spiral density waves. Thus, we deduce that the spiral density wave might be rather unstable or localized at least in the region we see, and that (1) would be the most plausible among the three. If this grand-design galaxy is confirmed to be without density waves, it will give a new picture of spiral galaxy formation.
NGC 5248
We were able to measure 13 offsets at kpc (), which were found to be almost zero, while 2 spiral arms were clearly traced. Three possible reasons for no observed offsets in NGC 4321 are also applicable to this galaxy.
In addition to a small bar with size of , Jogee et al. [37] found a large-scale stellar bar with a semimajor axis of , indicating that the spiral structure seen in CO and H could be inside the bar. They also estimated from the assumed ratio of the corotation radius to the bar semimajor axis (1.2), while Elmegreen et al. [24] derived a comparable value. Following the concept of the larger bar, Yuan & Yang [92] developed a nonlinear model for the spiral density waves excited by a bar potential, and succeeded in explaining the observational features of this galaxy. Their orbits show strong inward streaming motions along the spiral arm at , or 5.8 kpc using our distance. As we found that offsets of up to in radius were almost zero, this non-circular orbit can partially explain this feature.
IV.1.3 Galaxies with Ambiguous Offsets
In this section, we describe our findings for “A” galaxies in comparison with previous studies, and discuss possible reasons for their ambiguity. These reasons are not the same for all the galaxies, and we expect that if data with higher quality become available, some of them will be recategorized as C.
NGC 3184
We measured 19 offsets at kpc (), and found a negative correlation between and , with large dispersion.
Since CO data from BIMA SONG do not include data from single-dish observations, they are subject to the missing flux problem. In order to quantify how much flux is missed in the BIMA observations, we compared its spectra to those from the 45m observations [51] in Figure 8. While about 90% of the total flux was detected in the central 21′′ region, about 70% was missed if the flux was averaged at .
We do not, however, attribute the ambiguity in the offset to the missing flux, since spiral arms are thought to be comprised of smaller molecular clouds, which should be selectively detected in the interferometric observations. Since the spatial resolution of the CO data ( pc) is small enough to resolve typical molecular arms and offsets, the field of view and/or sensitivity should be insufficient. As spiral arms can be traced in the H to larger radii, we expect that the distribution will become clearer with smaller dispersion, if CO data with a larger field of view and higher sensitivity become available.
NGC 3938
We measured 9 offsets at kpc (), and found a negative correlation between and , with a large dispersion. This large dispersion is partly because of the large errors and unreliability of the CO rotation curve, which was used to calculate . The reason we did not use the RC from Daigle et al. [14] is that it is systematically different from ours, suggesting that the inclination angle mentioned in their paper is not correct. In addition, the CO image and resolution around 500 pc indicates that molecular arms are not sufficiently resolved and detected, while spiral arms are clear in the H image. Thus we need further CO observations to discuss the spiral structure of this galaxy based on the distribution.
NGC 4736 (M 94)
Though we were able to measure 8 offsets at kpc (), which are clear in the CO and H images, they show a negative dependence on . We derived the rotational velocity from CO data, but it was not consistent with the RC from Sofue et al. [73] where we measured offsets. Given that the RC from Sofue et al. [73] is flat, which is typical of spiral galaxies, we use this to calculate . However, even if we used the RC from CO data, the dependence of offsets on would still be negative.
NGC 4736 is the only galaxy in our sample to be classified as flocculent (AC=3). A star forming ring or short spiral arms are apparent at kpc in the H image, while molecular arms are longer and apparent at kpc. This difference in morphology between CO and H, which has been also noted by Wong & Blitz [90], could be responsible for the negative correlation between and . Therefore, we deduce that there are other triggers of star formation than the spiral density wave in this galaxy.
One possible trigger is an expanding poststarburst ring, proposed by van der Kruit [81] and Sanders & Bania [69]. They explained that the ring resulted from a central starburst which occurred about 10 Myr ago, from spectroscopic observations and hydrodynamical calculations. Maoz et al. [55] found two compact UV sources separated by in the nucleus with diffuse emission centered on the one source, presumably corresponding to the optical nucleus. They interpreted their results to be the final stage of a merger, which is consistent with the poststarburst scenario. Muñoz-Tuñón et al. [61] adopted another possibility of this ring to be located at the OLR of the central bar as well as the ILR of the outer disk. The pattern speed for each structure should be 85 and 27 km s-1 kpc-1, respectively, and the latter could explain the location of outer faint ring at . They also noted that the FUV ring is located slightly outward from the H ring, implying an inward-propagating star formation, which is totally opposite with the poststarburst scenario.
Rand & Wallin [64] applied the TW method to BIMA CO data, and derived km s-1 kpc-1, corrected for our distance. This value is much larger than that derived by Muñoz-Tuñón et al. [61], and locates the corotation at , which is almost same as where we measure the offsets.
NGC 6181
We were able to measure 27 offsets for 2 spiral arms at kpc (). While the offsets of arm1 show a negative dependence on , those of arm2 show a positive dependence (Figure 5). We thus fit the plot for arm2 only, but the uncertainties of the resultant values for and are too large to give a quantitative conclusion. As the large uncertainty is mainly due to large errors in the RC we used, further observations will be able to give more reliable results at least for arm2.
NGC 6946
At the region where CO emission was detected, the spiral structure is not clear, so we were able to measure only 7 offsets at kpc (). This small number of data resulted in the large uncertainty of , so we categorized this galaxy as A. The positive slope in the plot, however, gives the fitted value of Myr. This is slightly smaller than that for C galaxies, but still has the same order of magnitude.
Zimmer et al. [94] applied the TW method to the IRAM 30m CO data [87], and derived km s-1 kpc-1, consistent with our mean value of 38 km s-1 kpc-1. Fathi et al. [27] also applied the TW method using H data from Daigle et al. [14], whose spatial resolution was higher than that of CO data, and obtained two pattern speeds: km s-1 kpc-1 for the inner structure () and km s-1 kpc-1 for the outer structure (). They also claimed that spatially smoothed H data gave a comparable value to from Zimmer et al. [94]. As we measured offsets around the border of the inner and outer structure, our , which is in between the two values, is not inconsistent to their results despite the large uncertainty.
Since the spiral structure is more conspicuous and stronger CO emission is detected in the outer regions [87], further CO observations pointed to such regions will give understanding of the property of the spiral arms and star formation in this galaxy. We anticipate that this galaxy will be recategorized as C if we can measure a larger number of offsets and thus derive with smaller uncertainty.
IV.2 Property of Galaxies in Each Category
In order to understand relationships between spiral structures and other physical parameters, we have examined several properties of galaxies according to their category. Similar analyses are performed for all “C” galaxies, and their results are shown in §V.2.
IV.2.1 Molecular Gas Property
As we found that the missing flux in CO data of NGC 3184 data could be as large as about 70%, we excluded this galaxy from the following quantitative analysis of molecular gas. NGC 6181, whose CO data are also from interferometric observations only, is included in the analysis, since we find almost no flux is missed in the data by comparison with spectra from Young et al. [91].
First, we reassess the quality of CO data, which can cause biases to the categorization. We list the beamsizes (bmaj) and the noise levels (rms) of the CO images together with the offset category in Table 7, and show a plot of rms against bmaj in Figure 9. From this figure, we find no systematic differences or biases to the category.
Next, we examine global properties for each category. We calculate the mean H2 surface density using a conversion factor of cm-2 (K km s-1)-1 at the radial region where we measured offsets. In addition, we derive only for the arm regions, centered on CO peaks, which were used to derive offsets, with a width of 500 pc. From Figure 10, where disk-averaged and arm-only are plotted for each category, we find no clear dependence of both values on the offset category. This indicates that larger ( pc) scale properties of gas are not closely relevant to the spiral structure.
IV.2.2 Morphological Property
In order to quantify the morphological properties of the underlying gravitational potential of the spiral disk, we used the arm/interarm ratio in -band images as an indicator of the strength of the galactic shock or spiral arms, since the luminosity in is less sensitive to extinction and thought to be proportional to the total mass of low-mass stars, which dominate total stellar mass, assuming a constant mass-to-luminosity ratio. The -band images are taken from Knapen et al. [43] and 2MASS, and shown in Figure 11. We defined the arm region as a region with 500 pc width centered on the H peak which was measured in order to derive offsets, while the interarm region was set to the same width centered at the midpoint of the two arm regions, or 90 degrees away from an arm region if only one arm region was defined at that radius. The arm/interarm flux ratio was calculated at each radius where H peaks (i.e., offsets) were measured and averaged over the disk. In Figure 12, the averaged ratio is plotted for each offset category. Although there is no strong correlation, “A” galaxies tend to have a smaller ratio.
As an alternative way of estimating the arm strength, we performed an one dimensional discrete Fourier transformation,
| (7) |
where is the -band flux at the polar coordinate , in order to know which mode is dominant within a galaxy and obtain the typical strength of asymmetric components. We calculate the relative amplitude for , and the mean of these components is shown against the offset category in Figure 13. The component is the strongest for most of the galaxies, regardless of category. We find no clear dependence of the amplitude on the category, similar to that in the flux ratio. The smallest amplitudes, however, belong to “A” galaxies.
This tendency between the arm strengths and the offset category implies that stronger stellar arms or a deeper potential generates clearer offsets. As the potential depth should be tightly correlated with the strength of spiral density waves, the ambiguity in offsets for “A” galaxies at least partially results from weaker density waves.
V Discussion
For 5 galaxies in the “C” category, we were able to derive their and by the -fitting. In this section, we discuss the dependency of the derived values on other physical parameters. As we have only 5 galaxies, the statements here are still tentative and require a larger sample to confirm them statistically.
V.1 Pattern Speed
In Figure 14, we plot ellipses on CO and H maps to show the location of the derived corotation, except for NGC 4303, whose uncertainty in is too large to derive a reliable . We find that is nearly consistent with the edge of CO data, while H arms are more extended. This is a natural result from the fact that we did not find large negative offsets, but we cannot exclude the possibility that the small CO field of view has caused a bias to this result. For a more robust determination, larger CO maps are needed. In Table 9, the radius of the optical disk from Nearby Galaxies Catalog [80] and the derived are listed. From the ratio , we find that the corotation radius is about half of , except for NGC 5457. We should note that this result is fully independent of the assumed distance, and less sensitive to the assumed inclination angle.
V.2 Star Formation Timescale
As the derived values of are about Myr and the free-fall time () of a typical molecular cloud ( cm-3) is about 6 Myr, we deduce that the gravitational instability should be a dominant trigger for star formation in the spiral arms. Here, we examine how the gravitational instability and other factors affect the star formation timescale. Similar analyses are performed for each offset category and their results are shown in §IV.2.
We should bare in mind that is linearly dependent on the assumed distance, and also dependent on the assumed inclination, where its error is substantial for galaxies with low inclination angles. Its dependency is discussed in §V.3.
V.2.1 Gravitational Instability
In Figure 15, the mean H2 surface density derived from CO data is plotted against . Values in the left panel are derived by averaging the data azimuthally, while those in the right panel are derived only from arm regions. As we obtained consistent with the gravitational collapse timescale, we expect larger density with smaller . However, there is no clear correlation between and , suggesting that molecular properties at scale pc (adopted width of arm regions) are not directly relevant to star formation activities. Since the typical size of a GMC is about 50 pc, which is much smaller than the spatial resolution of CO data we used, we need CO data with higher resolution as well as larger sample of spiral galaxies for further study.
V.2.2 Metallicity
We plot the heavy element abundance in the form of from Zaritsky et al. [93] against in Figure 16. Each galaxy has 2 metallicity values measured at and , where is the scale length. We measured offsets around with the exception of NGC 5457, for which we used the region of while . Since heavy elements can help the cooling and collapse of molecular clouds by their transitional lines, we expect smaller with higher metallicity. Such a correlation is, however, not apparent here, implying that these effects by heavy elements are not critical to star formation processes.
V.2.3 Spiral Strength
In Figure 17 and 18, we plot the arm/interarm ratio and the Fourier amplitudes for from -band images against . Neither plots show strong dependence on . If we can confirm that the spiral arm strength has no correlation with , the spiral shock or potential should have no direct effect on star formation and its role could be just to agglomerate small pre-existing molecular clouds to form massive molecular clouds, in which star formation eventually occurs, as suggested by Koda & Sofue [45]. This is important for understanding the relationship between galactic dynamics and star formation activities, and we need a larger sample of galaxies for further study.
V.3 Validity of Offset Method
Out of 12 nearby spiral galaxies, we have succeeded in deriving and for 5 galaxies, which are referred as “C” galaxies. The rest of the sample, comprised of 7 galaxies, are categorized as “N” or “A” according to their offset distributions.
We have examined the surface mass density of the molecular disk, and strength of spiral arms in §IV.2, to find any differences in physical properties between the categories. While no clear difference is found in the molecular properties, there is an indication that galaxies which show ambiguous offsets tend to have a smaller stellar density contrast between arm and interarm regions. Thus, the -band morphology can be used as an additional selection criterion, when a larger sample is needed for further study.
The validity of the assumptions we have used in the offset method (i.e., circular rotation, constant and ) can be estimated from the plot. Several features found in this work, such as the lack of offsets and different distributions for individual arms, indicate that these assumptions or even the density wave theory are not applicable to all the spiral galaxies. A presence of a central bar [4, 68, e.g.,] and an interaction with companion galaxies [77, e.g.,] can drive material or short-lived spiral structures or enhance pre-existing density waves. Possible explanations for individual galaxies are mentioned in §IV.1, but a full consideration of these effects is beyond the scope of this paper.
Here we consider the effects of the adopted parameters on the results. The parameter we must care most is the inclination angle , as it changes both and . Since is derived as , larger and smaller will be derived, if larger is adopted. In addition, different can change the shape of spiral arms, since for the minor axis direction. This change is difficult to quantify, because it does not change anything regarding the major axis direction. These effects are especially significant for the most face-on (small ) galaxies. For example, if is adopted for NGC 0628, which is half of our value, the resultant and will be changed by a factor of 2 from our result, since . While this can directly change the result on , the location of the corotation is almost independent of , since is also inversely dependent on as well as .
Another parameter we must keep in mind is the distance . As is proportional to , is inversely proportional to . Though affects and in the same way as , its uncertainty is about 20%, so that the effect is not as large as for small . We should note that the location of corotation is fully independent on .
In addition, the poor determination of the RC for some galaxies and the discrepancy between this work and previous work for NGC 4254, both indicate that the uncertainty of the fitted and could be underestimated. The latter and several other works also suggest a radial variation of . In order to solve these problems, an extensive CO survey of nearby spiral galaxies with both interferometers and single dishes is critical.
VI Conclusion
We have presented a revised method to determine both the pattern speed () and star formation timescale () of spiral galaxies simultaneously, proposed by Egusa et al. [21]. This method utilizes offsets between molecular and young-stellar arms, and we refer to it as the “Offset Method”.
We applied the offset method to CO and H data of 13 nearby galaxies, and derived and for 5 galaxies. Since their offsets are clear, we categorize them as “C” galaxies. From the results of these 5 galaxies, we find the followings.
- •
The corotation radius calculated by the derived is near the edge of CO data, and is about half of the optical radius for 3 galaxies.
- •
The derived is roughly consistent with the typical free-fall timescale of molecular clouds, which indicates that gravitational instability is a dominant mechanism triggering star formations in spiral arms.
- •
The surface density of molecular gas calculated from CO data, heavy elements abundance, and spiral arm strengths evaluated from -band images do not show clear dependence on .
We also find that 2 out of the remaining 8 galaxies show no offsets between CO and H and categorized them as “N” galaxies. As their arms are clearly traced, the spiral density wave is usually thought to be at work in these galaxies. There are several possible reasons to explain the lack of offset in these galaxies: (1) material arms, (2) corotation where arms are seen, and (3) elliptical orbits nearly parallel to spiral arms. Although the current data are not sufficient to confirm which case is at work, we have gained an insight that a central bar could account for this feature, since these 2 galaxies are both barred.
With 1 galaxy excluded from our analysis due to its poor rotation curve, the remaining 5 galaxies have ambiguous offsets, whose dependence on the rotational frequency is not clear or different from expectation. We categorize them as “A” galaxies. The major reasons for this ambiguity are (1) the density wave is weaker, and/or (2) observational resolution and sensitivity are not sufficient to detect arms and their offsets clearly. The former is supported by our finding that the arm strengths of “A” galaxies are slightly weaker than those of “C” galaxies.
In addition to the results for individual galaxies, properties of molecular gas and morphology were examined according to the category. We list the results in the following.
- •
The disk-averaged and arm-only value of molecular surface density do not appear to correlate with the category, indicating that larger ( pc) scale properties of gas do not vary according to a spiral structure.
- •
Analyses of the -band images show that the amplitude of stellar spiral arms is slightly smaller for “A” galaxies.
From the results for individual galaxies and offset categories as mentioned above, we summarize our findings as
- 1.
Star formation in spiral arms is dominantly triggered by gravitational instability of molecular clouds.
- 2.
Stellar spiral arms could affect the appearance of offsets between molecular gas and young stars.
| NGC | R.A. (J2000) | Dec. (J2000) | Velocity | Distance | Morphology | T† | AC‡ |
|---|---|---|---|---|---|---|---|
| (h m s) | (d m s) | (km s-1) | (Mpc) | ||||
| 0628 | 01 36 41.77 | +15 47 00.5 | 657aaInclination is calculated from the ratio of major axis to minor axis, from de Vaucouleurs et al. [18]. | 7.3aaInclination is calculated from the ratio of major axis to minor axis, from de Vaucouleurs et al. [18]. | SA(s)c | 5 | 9 |
| 3184 | 10 18 16.98 | +41 25 27.8 | 592aaInclination is calculated from the ratio of major axis to minor axis, from de Vaucouleurs et al. [18]. | 8.7aaInclination is calculated from the ratio of major axis to minor axis, from de Vaucouleurs et al. [18]. | SAB(rs)cd | 6 | 9 |
| 3938 | 11 52 49.45 | +44 07 14.6 | 809aaInclination is calculated from the ratio of major axis to minor axis, from de Vaucouleurs et al. [18]. | 17aaInclination is calculated from the ratio of major axis to minor axis, from de Vaucouleurs et al. [18]. | SA(s)c | 5 | 9 |
| 4254 | 12 18 49.63 | +14 24 59.4 | 2407ccfootnotemark: | 16.1ccfootnotemark: | SA(s)c | 5 | 9 |
| 4303 | 12 21 54.90 | +04 28 25.1 | 1566aaInclination is calculated from the ratio of major axis to minor axis, from de Vaucouleurs et al. [18]. | 16.1ccfootnotemark: | SAB(rs)bc | 4 | 9 |
| 4321 | 12 22 54.90 | +15 49 20.6 | 1571aaInclination is calculated from the ratio of major axis to minor axis, from de Vaucouleurs et al. [18]. | 16.1ccfootnotemark: | SAB(s)bc | 4 | 12 |
| 4535 | 12 34 20.31 | +08 11 51.9 | 1961aaInclination is calculated from the ratio of major axis to minor axis, from de Vaucouleurs et al. [18]. | 16.1ccfootnotemark: | SAB(s)c | 5 | 9 |
| 4736 | 12 50 53.06 | +41 07 13.7 | 308aaInclination is calculated from the ratio of major axis to minor axis, from de Vaucouleurs et al. [18]. | 5.1bb is from Cepa & Beckman [10] but is derived from their new rotation curve. | SA(r)ab | 2 | 3 |
| 5194 | 13 29 52.71 | +47 11 42.6 | 463aaInclination is calculated from the ratio of major axis to minor axis, from de Vaucouleurs et al. [18]. | 9.6bb is from Cepa & Beckman [10] but is derived from their new rotation curve. | SA(s)bc | 4 | 12 |
| 5248 | 13 37 32.07 | +08 53 06.2 | 1153aaInclination is calculated from the ratio of major axis to minor axis, from de Vaucouleurs et al. [18]. | 22.7aaInclination is calculated from the ratio of major axis to minor axis, from de Vaucouleurs et al. [18]. | SB(rs)bc | 4 | 12 |
| 5457 | 14 03 12.59 | +54 20 56.7 | 241aaInclination is calculated from the ratio of major axis to minor axis, from de Vaucouleurs et al. [18]. | 7.2bb is from Cepa & Beckman [10] but is derived from their new rotation curve. | SAB(rs)cd | 6 | 9 |
| 6181 | 16 32 20.96 | +19 49 35.6 | 2375ddfootnotemark: | 36.7ddfootnotemark: | SA(rs)c | 5 | 12 |
| 6946 | 20 34 52.34 | +60 09 14.2 | 48aaInclination is calculated from the ratio of major axis to minor axis, from de Vaucouleurs et al. [18]. | 5.5bb is from Cepa & Beckman [10] but is derived from their new rotation curve. | SAB(rs)cd | 6 | 9 |
Note. — (RA, Dec) and morphology are from NED. : T is a numeric index corresponding to the morphology, and is called the Hubble T type. : AC is the arm class from Elmegreen & Elmegreen [22]
References. — (a) Helfer et al. [34], (b) Sofue et al. [73], (c) Sofue et al. [74], (d) Tully [80]
| NGC | CO | H | RC∗ | ||||||
|---|---|---|---|---|---|---|---|---|---|
| bmaj | bmin | rms† | tel. | seeing | tel. | ref | |||
| (′′) | (′′) | (mJy beam-1) | (′′) | ||||||
| 0628 | 7.2 | 5.3 | 51 | BIMA+12m | 0.43 | CTIO | 1 | 6, CO | |
| 3184 | 5.9 | 5.4 | 50 | BIMA | 1.7 | JKT | 2 | 6, CO | |
| 3938 | 5.9 | 5.4 | 59 | BIMA+12m | 0.3 | KP2 | 1 | 6, CO | |
| 4254 | 4.8 | 3.6 | 15 | NMA+45m | 2.1 | KP9 | 3 | CO | |
| 4303 | 7.3 | 5.5 | 47 | BIMA+12m | 1.4 | JKT | 2 | 7, CO | |
| 4321 | 7.2 | 4.9 | 50 | BIMA+12m | S90 | 4 | 6, 7, CO | ||
| 4535 | 7.3 | 5.7 | 63 | BIMA | 1.9 | JKT | 2 | CO | |
| 4736 | 6.9 | 5.0 | 64 | BIMA+12m | 1.4 | JKT | 2 | 7, CO | |
| 5194 | 5.8 | 5.1 | 61 | BIMA+12m | BS | 4 | 6, 7, CO | ||
| 5248 | 6.9 | 5.8 | 38 | BIMA+12m | 1.4 | JKT | 2 | CO | |
| 5457 | 5.7 | 5.4 | 45 | BIMA+12m | 2.4 | INT | 2 | 7, CO | |
| 6181 | 3.4 | 2.8 | 11.5 | NMA | 4.7 | P60 | 5 | CO | |
| 6946 | 6.0 | 5.0 | 61 | BIMA+12m | 1.4 | JKT | 2 | 6, 7, CO | |
Note. — : The rms of CO data was calculated for a velocity width of 10 km s-1. : “CO” means a rotation curve from the velocity field of CO data, and data in bold font were used for the application. (See §III.2 for detail.)
Abbreviations for telescopes: BIMA (Berkeley-Illinois-Maryland Association), 12m (NRAO 12m telescope), NMA (Nobeyama Millimeter Array), 45m (Nobeyama 45m Telescope), CTIO (Cerro Tololo Inter-American Observatory 1.5m), JKT (1m Jacobus Kapteyn Telescope), KP2 (Kitt Peak 2.1m), KP9 (Kitt Peak 0.9m), S90 (Steward 90inch), BS (Kitt Peak Burrell-Schmidt), INT (2.5m Isaac Newton Telescope), P60 (Palomar 60inch)
References. — (1) Kennicutt et al. [38], (2) Knapen et al. [44], (3) Koopmann, Kenney, & Young [47], (4) Martin & Kennicutt [56], (5) Koopmann et al., private communication, (6) Daigle et al. [14], (7) Sofue et al. [73]
| Dynamical Center | Adopted Value | |||||||
|---|---|---|---|---|---|---|---|---|
| NGC | R.A. (J2000) | Dec. (J2000) | error | Velocity | P.A.† | P.A. | ||
| (h m s) | (d m s) | (km s-1) | (∘) | (∘) | (∘) | (∘) | ||
| 0628 | 01 36 41.589 | +15 47 01.30 | 3.3′′ | 11.8 | 24aaInclination is calculated from the ratio of major axis to minor axis, from de Vaucouleurs et al. [18]. | |||
| 3184 | 176.4ccfootnotemark: | 16.7ccfootnotemark: | ||||||
| 3938 | 11 52 49.502 | +44 07 20.50 | 9.0′′ | 202.2 | 24aaInclination is calculated from the ratio of major axis to minor axis, from de Vaucouleurs et al. [18]. | |||
| 4254 | 12 18 49.799 | +14 25 03.90 | 3.2′′ | 70.9 | 52.4 | |||
| 4303 | 12 21 54.929 | +04 28 21.60 | 6.1′′ | 318bb is from Cepa & Beckman [10] but is derived from their new rotation curve. | 27bb is from Cepa & Beckman [10] but is derived from their new rotation curve. | |||
| 4321 | 12 22 55.192 | +15 49 20.10 | 5.7′′ | 146bb is from Cepa & Beckman [10] but is derived from their new rotation curve. | 27bb is from Cepa & Beckman [10] but is derived from their new rotation curve. | |||
| 4535 | 12 34 20.427 | +08 11 54.10 | 3.2′′ | |||||
| 4736 | 108bb is from Cepa & Beckman [10] but is derived from their new rotation curve. | 35bb is from Cepa & Beckman [10] but is derived from their new rotation curve. | ||||||
| 5194 | 13 29 52.565 | +47 11 42.20 | 4.2′′ | 22bb is from Cepa & Beckman [10] but is derived from their new rotation curve. | 20bb is from Cepa & Beckman [10] but is derived from their new rotation curve. | |||
| 5248 | 13 37 32.140 | +08 53 03.90 | 7.1′′ | 109.6 | 43aaInclination is calculated from the ratio of major axis to minor axis, from de Vaucouleurs et al. [18]. | |||
| 5457 | 14 03 12.330 | +54 20 56.99 | 4.3′′ | 38bb is from Cepa & Beckman [10] but is derived from their new rotation curve. | 18bb is from Cepa & Beckman [10] but is derived from their new rotation curve. | |||
| 6181 | 16 32 20.916 | +19 49 35.23 | 0.6′′ | 332.8 | 66.8 | |||
| 6946 | 20 34 52.703 | +60 09 13.39 | 4.3′′ | 64bb is from Cepa & Beckman [10] but is derived from their new rotation curve. | 30bb is from Cepa & Beckman [10] but is derived from their new rotation curve. | |||
Note. — : P.A. is the position angle of the disk major axis, which is defined as at north and increases counterclockwise. : is the inclination angle of the disk, which is defined as when the disk is face-on, and when edge-on. Data fields shown as “ ” indicate that meaningful values are not derived by the analysis described in §III.2
References. — (a) Helfer et al. [34], (b) Sofue et al. [73], (c) Daigle et al. [14]
| NGC | (Myr) | (km s-1 kpc-1) | # of data | Category† | |
|---|---|---|---|---|---|
| 0628 | 33 | 91.78 | C | ||
| 3184 | 19 | 26.93 | A | ||
| 3938 | 9 | 5.2 | A | ||
| 4254 | 18 | 29.51 | C | ||
| 4303 | 8 | 7.09 | C | ||
| 4321 | 34 | 86.80 | N | ||
| 4736 | 8 | 15.67 | A | ||
| 5194 | 41 | 811.54 | C | ||
| (arm1 | 24 | 157.32 | C) | ||
| 5248 | 13 | 4.16 | N | ||
| 5457 | 10 | 16.09 | C | ||
| 6181 | 27 | 31.4 | A | ||
| (arm2 | 14 | 19.52 | A) | ||
| 6946 | 7 | 38.07 | A |
Note. — : “C” galaxies are categorized if their and can be determined by the plot. “N” galaxies show no offsets between CO and H arms. “A” galaxies are those which do not fall into the above two categories. See §IV for details.
| NGC | Authority | P.A. | Method | Data | ||||
|---|---|---|---|---|---|---|---|---|
| (Mpc) | (∘) | (∘) | (km s-1 kpc-1) | (arcmin) | ||||
| 0628 | Elmegreen et al. [24] | 21aaInclination is calculated from the ratio of major axis to minor axis, from de Vaucouleurs et al. [18]. | morphology | |||||
| Fathi et al. [26] | 9.7 | 25 | 6.5 | 1.8bb is from Cepa & Beckman [10] but is derived from their new rotation curve. | SFE | Hi, H | ||
| This work (2009) | 7.3 | 11.8 | 24 | – | offset | CO, H | ||
| 4254 | Elmegreen et al. [24] | 27aaInclination is calculated from the ratio of major axis to minor axis, from de Vaucouleurs et al. [18]. | 1.5 | morphology | ||||
| Kranz et al. [48] | 20 | 67.5 | 41.2 | 20 | simulation | , H | ||
| This work (2009) | 16.1 | 70.9 | 52.4 | – | offset | CO, H | ||
| 4303 | Colina & Wada [12] | 16.1 | 40 | 500 | simulation | |||
| Rautiainen et al. [65] | 1.5 | simulation | ||||||
| This work (2009) | 16.1 | 318 | 27 | offset | CO, H | |||
| 5194 | Tully [79] | 4 | -10 | 20 | 90 | 2.2 | morphology | H |
| Elmegreen et al. [24] | 45aaInclination is calculated from the ratio of major axis to minor axis, from de Vaucouleurs et al. [18]. | 2.2 | morphology | |||||
| García-Burillo et al. [30] | 9.6 | 170 | 20 | 27 | 2.7 | simulation | CO | |
| Vogel et al. [83] | -10 | 20 | 2.1 | streaming motion | H | |||
| Kuno et al. [49] | 9.6 | -10 | 20 | 14 | 5.0 | morphology | optical | |
| Oey et al. [63] | 9.6 | 5.0 | isochrones | H | ||||
| Zimmer et al. [94] | 9.5 | -10 | 20 | TW | CO | |||
| This work (2009) | 9.6 | 22 | 20 | offset | CO, H | |||
| 5457 | Elmegreen et al. [24] | 12aaInclination is calculated from the ratio of major axis to minor axis, from de Vaucouleurs et al. [18]. | morphology | |||||
| Waller et al. [86] | 7.4 | 39 | 18 | offset | CO, FUV | |||
| This work (2009) | 7.2 | 38 | 18 | offset | CO, H |
| NGC | Authority | P.A. | Method | Data | ||||
|---|---|---|---|---|---|---|---|---|
| (Mpc) | (∘) | (∘) | (km s-1 kpc-1) | (arcmin) | ||||
| 4321 | Elmegreen et al. [24] | 27aaInclination is calculated from the ratio of major axis to minor axis from de Vaucouleurs et al. [18]. | 2.0 | morphology | ||||
| Sempere et al. [70] | 20 | 155 | 32 | 1.8 | Canzian, simulation | Hi | ||
| Canzian & Allen [8] | 17.1 | 153 | 28 | 31 | Canzian | H | ||
| Wada et al. [84] | 17.1 | 155 | 30 | 65 (bar) | (bar) | simulation | CO | |
| Oey et al. [63] | 16.1 | 2.6 | isochrones | H | ||||
| Rand & Wallin [64] | 16.1 | 153 | 27 | TW | CO | |||
| 5248 | Elmegreen et al. [24] | 41aaInclination is calculated from the ratio of major axis to minor axis from de Vaucouleurs et al. [18]. | 1.7 | morphology | ||||
| Jogee et al. [37] | 15 | 135 | 1.9 | bar length |
| NGC | bmaj††Major axis of the synthesized beam from the CO data. (pc) | rms‡‡Sensitivity of CO channel maps (10 km s-1 per channel) measured as the root mean square of emission-free regions. ( pc-2) | Category |
|---|---|---|---|
| 0628 | 250 | 52 | C |
| 3938 | 490 | 73 | A |
| 4254 | 370 | 34 | C |
| 4303 | 570 | 45 | C |
| 4321 | 560 | 55 | N |
| 4736 | 170 | 72 | A |
| 5194 | 270 | 80 | C |
| 5248 | 760 | 37 | N |
| 5457 | 200 | 57 | C |
| 6181 | 600 | 47 | A |
| 6946 | 160 | 80 | A |
| C | N | A | total | |
|---|---|---|---|---|
| SA | 3 | 0 | 3 | 6 |
| SAB | 2 | 1 | 2 | 5 |
| SB | 0 | 1 | 0 | 1 |
| total | 5 | 2 | 5 | 12 |
| NGC | (arcmin) | (arcmin) | |
|---|---|---|---|
| 0628 | 3.5 | ||
| 4254 | 2.5 | ||
| 5194 | 6.8 | ||
| 5457 | 11.9 |


![[Uncaptioned image]](0904.3121v1/f2g.png)
![[Uncaptioned image]](0904.3121v1/f2h.png)
![[Uncaptioned image]](0904.3121v1/f2i.png)
![[Uncaptioned image]](0904.3121v1/f2j.png)
![[Uncaptioned image]](0904.3121v1/f2k.png)
![[Uncaptioned image]](0904.3121v1/f2l.png)
![[Uncaptioned image]](0904.3121v1/f2m.png)



![[Uncaptioned image]](0904.3121v1/f4g.png)
![[Uncaptioned image]](0904.3121v1/f4h.png)
![[Uncaptioned image]](0904.3121v1/f4i.png)
![[Uncaptioned image]](0904.3121v1/f4j.png)
![[Uncaptioned image]](0904.3121v1/f4k.png)
![[Uncaptioned image]](0904.3121v1/f4l.png)


![[Uncaptioned image]](0904.3121v1/f14e.png)
![[Uncaptioned image]](0904.3121v1/f14f.png)
![[Uncaptioned image]](0904.3121v1/f14g.png)
![[Uncaptioned image]](0904.3121v1/f14h.png)


References
- [1] Adler, D. S., & Westpfahl, D. J. 1996, AJ, 111, 735
- [2] Anders, P., & Fritze-v. Alvensleben, U. 2003, A&A, 401, 1063
- [3] Arimoto, N., Sofue, Y., and Tsujimoto, T. 1996, PASJ, 48, 275
- [4] Athanassoula, E. 1980, A&A, 88, 184
- [5] Bastian, N., Gieles, M., Lamers, H. J. G. L. M., Scheepmaker, R. A., & de Grijs, R. 2005, A&A, 431, 905
- [6] Binney, J., & Tremaine, S. 1987, Galactic Dynamics (Princeton: Princeton University Press)
- [7] Canzian, B. 1993, ApJ, 414, 487
- [8] Canzian, B., & Allen, R. J. 1997, ApJ, 479, 723
- [9] Cedrés, B., & Cepa, J. 2002, A&A, 391, 809
- [10] Cepa, J., & Beckman, J. E. 1990, ApJ, 349, 497
- [11] Cepa, J., Beckman, J. E., Knapen, J. H., Nakai, N., & Kuno, N. 1992, AJ, 103, 429
- [12] Colina, L., & Wada, K. 2000, ApJ, 529, 845
- [13] Combes, F., & Becquaert, J.-F. 1997, A&A, 326, 554
- [14] Daigle, O., Carignan, C., Amram, P., Hernandez, O., Chemin, L., Balkowski, C., & Kennicutt, R. 2006, MNRAS, 367, 469
- [15] Debattista, V. P. 2003, MNRAS, 342, 1194
- [16] Debattista, V. P., & Williams, T. B. 2004, ApJ, 605, 714
- [17] de la Fuente Marcos, R., & de la Fuente Marcos, C. 2004, New Astronomy, 9, 475
- [18] de Vaucouleurs, G., de Vaucouleurs, A., & Corwin, J. R. 1976, Second reference catalogue of bright galaxies, 1976, Austin: University of Texas Press., 0
- [19] de Vaucouleurs, G., de Vaucouleurs, A., Corwin, H.G., Buta, R.J., Paturel, G., and Fouque, P. 1991, Third Reference Catalogue of Bright Galaxies (New York: Springer)
- [20] Drimmel, R. 2000, A&A, 358, L13
- [21] Egusa, F., Sofue, Y., & Nakanishi, H., 2004, PASJ, 56, L45
- [22] Elmegreen, D. M., & Elmegreen, B. G. 1987, ApJ, 314, 3
- [23] Elmegreen, B. G., Seiden, P. E., & Elmegreen, D. M. 1989, ApJ, 343, 602
- [24] Elmegreen, B. G., Elmegreen, D. M., & Montenegro, L. 1992, ApJS, 79, 37
- [25] Elmegreen, B. G. 1994, Physics of the Gaseous and Stellar Disks of the Galaxy, 66, 61
- [26] Fathi, K., Beckman, J. E., Zurita, A., Relaño, M., Knapen, J. H., Daigle, O., Hernandez, O., & Carignan, C. 2007a, A&A, 466, 905
- [27] Fathi, K., Toonen, S., Falcón-Barroso, J., Beckman, J. E., Hernandez, O., Daigle, O., Carignan, C., & de Zeeuw, T. 2007b, ApJ, 667, L137
- [28] Ferrarese, L., Freedman, W. L., Hill, Robert J. et al. 1996 ApJ, 464, 568
- [29] Fujimoto, M. 1968, in Non-stable phenomena in galaxies, IAU Symp., 29, 453
- [30] García-Burillo, S., Combes, F., & Gerin, M. 1993, A&A, 274, 148
- [31] Gerssen, J., Kuijken, K., & Merrifield, M. R. 1999, MNRAS, 306, 926
- [32] Grosbøl, P., Dottori, H., & Gredel, R. 2006, A&A, 453, L25
- [33] Haynes, M. P., Giovanelli, R., & Kent, B. R. 2007, ApJ, 665, L19
- [34] Helfer, T. T., Thornley, M. D., Regan, M. W., Wong, T., Sheth, K., Vogel, S. N., Blitz, L., & Bock, D. C.-J. 2003, ApJS, 145, 259
- [35] Hernandez, X., Valls-Gabaud, D., & Gilmore, G. 2000, MNRAS, 316, 605
- [36] Hidaka, M., & Sofue, Y. 2002, PASJ, 54, 33
- [37] Jogee, S., Knapen, J. H., Laine, S., Shlosman, I., Scoville, N. Z., & Englmaier, P. 2002, ApJ, 570, L55
- [38] Kennicutt, R. C., Jr., et al. 2003, PASP, 115, 928
- [39] Kennicutt, R. C., Jr., et al. 2007, ApJ, 671, 333
- [40] Knapen, J. H., Beckman, J. E., Cepa, J., van der Hulst, T., & Rand, R. J. 1992, ApJ, 385, L37
- [41] Knapen, J. H., Cepa, J., Beckman, J. E., Soledad del Rio, M., & Pedlar, A. 1993, ApJ, 416, 563
- [42] Knapen, J. H., Beckman, J. E., Cepa, J., & Nakai, N. 1996, A&A, 308, 27
- [43] Knapen, J. H., de Jong, R. S., Stedman, S., & Bramich, D. M. 2003, MNRAS, 344, 527
- [44] Knapen, J. H., Stedman, S., Bramich, D. M., Folkes, S. L., & Bradley, T. R. 2004, A&A, 426, 1135
- [45] Koda, J., & Sofue, Y. 2006, PASJ, 58, 299
- [46] Koda, J., Scoville, N. Z., Sawada, T. et al. 2009, submitted
- [47] Koopmann, R. A., Kenney, J. D. P., & Young, J. 2001, ApJS, 135, 125
- [48] Kranz, T., Slyz, A., & Rix, H.-W. 2001, ApJ, 562, 164
- [49] Kuno, N., Nakai, N., Handa, T., & Sofue, Y. 1995, PASJ, 47, 745
- [50] Kuno, N., & Nakai, N. 1997, PASJ, 49, 279
- [51] Kuno, N., et al. 2007, PASJ, 59, 117
- [52] Leitherer, C., et al. 1999, ApJS, 123, 3
- [53] Lin, C. C., & Shu, F. H. 1964, ApJ, 140, 646
- [54] Lundgren, A. A., Olofsson, H., Wiklind, T., & Rydbeck, G. 2004, A&A, 422, 865
- [55] Maoz, D., Filippenko, A. V., Ho, L. C., Rix, H.-W., Bahcall, J. N., Schneider, D. P., & Macchetto, F. D. 1995, ApJ, 440, 91
- [56] Martin, C. L., & Kennicutt, R. C. 2001, ApJ, 555, 301
- [57] Martos, M., Hernandez, X., Yáñez, M., Moreno, E., & Pichardo, B. 2004, MNRAS, 350, L47
- [58] Meidt, S. E., Rand, R. J., Merrifield, M. R., Shetty, R., & Vogel, S. N. 2008, ApJ, 688, 224
- [59] Merrifield, M. R. & Kuijken, K. 1995, MNRAS, 274, 933
- [60] Minchin, R., et al. 2007, ApJ, 670, 1056
- [61] Muñoz-Tuñón, C., Caon, N., & Aguerri, J. A. L. 2004, AJ, 127, 58
- [62] Nakai, N., Kuno, N., Handa, T., & Sofue, Y. 1994, PASJ, 46, 527
- [63] Oey, M. S., Parker, J. S., Mikles, V. J., & Zhang, X. 2003, AJ, 126, 2317
- [64] Rand, R. J., & Wallin, J. F. 2004, ApJ, 614, 142
- [65] Rautiainen, P., Salo, H., & Laurikainen, E. 2005, ApJ, 631, L129
- [66] Roberts, W. W. 1969, ApJ, 158, 123
- [67] Roberts, W. W., Roberts, M. S., & Shu, F. H. 1975, ApJ, 196, 381
- [68] Romero-Gómez, M., Athanassoula, E., Masdemont, J. J., & García-Gómez, C. 2007, A&A, 472, 63
- [69] Sanders, R. H., & Bania, T. M. 1976, ApJ, 204, 341
- [70] Sempere, M. J., García-Burillo, S., Combes, F., & Knapen, J. H. 1995, A&A, 296, 45
- [71] Sheth, K., Vogel, S. N., Regan, M. W., Teuben, P. J., Harris, A. I., & Thornley, M. D. 2002, AJ, 124, 2581
- [72] Shetty, R., Vogel, S. N., Ostriker, E. C., & Teuben, P. J. 2007, ApJ, 665, 1138
- [73] Sofue, Y., Tutui, Y., Honma, M., Tomita, A., Takamiya, T., Koda, J., & Takeda, Y. 1999, ApJ, 523, 136
- [74] Sofue, Y., Koda, J., Nakanishi, H., Onodera, S., Kohno, K., Tomita, A., & Okumura, S. K. 2003a, PASJ, 55, 17
- [75] Sofue, Y., Koda, J., Nakanishi, H., & Hidaka, M. 2003b, PASJ, 55, 75
- [76] Spitzer, L. 1978, Physical Processes in the Interstellar Medium, New York Wiley-Interscience, 1978. 333 p.,
- [77] Toomre, A., & Toomre, J. 1972, ApJ, 178, 623
- [78] Tremaine, S., & Weinberg, M. D. 1984, ApJ, 282, L5
- [79] Tully, R. B. 1974, ApJS, 27, 449
- [80] Tully, R. B. 1988, Nearby Galaxies Catalogue, Cambridge and New York, Cambridge University Press, 1988, 221 p.,
- [81] van der Kruit, P. C. 1974, ApJ, 188, 3
- [82] Vázquez-Semadeni, E., Gómez, G. C., Jappsen, A. K., Ballesteros-Paredes, J., González, R. F., & Klessen, R. S. 2007, ApJ, 657, 870
- [83] Vogel, S. N., Rand, R. J., Gruendl, R. A., & Teuben, P. J. 1993, PASP, 105, 666
- [84] Wada, K., Sakamoto, K., & Minezaki, T. 1998, ApJ, 494, 236
- [85] Wada, K. 2008, ApJ, 675, 188
- [86] Waller, W. H., et al. 1997, ApJ, 481, 169
- [87] Walsh, W., Beck, R., Thuma, G., Weiss, A., Wielebinski, R., & Dumke, M. 2002, A&A, 388, 7
- [88] Westpfahl, D. J. 1998, ApJS, 115, 203
- [89] Williams, J. P., de Geus, E. J., & Blitz, L. 1994, ApJ, 428, 693
- [90] Wong, T., & Blitz, L. 2000, ApJ, 540, 771
- [91] Young, J. S., et al. 1995, ApJS, 98, 219
- [92] Yuan, C., & Yang, C.-C. 2006, ApJ, 644, 180
- [93] Zaritsky, D., Kennicutt, R. C., Jr., & Huchra, J. P. 1994, ApJ, 420, 87
- [94] Zimmer, P., Rand, R. J., & McGraw, J. T. 2004, ApJ, 607, 285