Properties of Heavy Hadrons
Abstract
We review recent measurements of heavy hadron states including masses and lifetimes of the meson as well as excited states (, ). We discuss properties of the meson such as lifetime, lifetime difference and violation in decays. We also summarize new measurements of the masses and lifetimes of bottom baryons including the baryon, the baryon states as well as the and baryons.
I INTRODUCTION
Hadrons containing bottom quarks can be classified according to their quantum numbers. There are the ground state mesons such as the neutral meson with quark content , the charged ( ), the ( ) and the meson which contains a bottom and charm quark ( ). In addition, there are excited vector states with spin-1 such as the states , , , the states , and the states , . Also, there exist bound mesons such as the states , , and the resonance which is the source of mesons at the KEKB and PEP-II factories with the Belle and BABAR experiments. The state , recently discovered at BABAR [1], is discussed in detail in Ref. [2] contributed to this conference.
In addition to mesons states, there exist baryons containing quarks. The lowest baryon state is the with quark content . Other bottom baryons with are the ( ) as well as the ( ) and the ( ) plus their excited states ( ) and ( ). In this paper, a heavy hadron is defined as all states outlined above except for the and mesons. Since the properties of states are covered by other presentations at this conference [2, 3], we shall focus on , mesons and excited states (generically called , ) as well as bottom baryons including the baryon, the baryon states plus the and .
After defining “heavy hadron”, we explain what is meant by “properties” of hadrons. Under properties we understand masses, lifetimes and decay properties of heavy hadrons. This brings us to the question of “why study hadron states”? A physicist typically first comes into contact with the discussion of states while studying the hydrogen atom in quantum mechanics. The spectroscopy of the H-atom is explained as transitions between the various energy levels of the hydrogen atom. This prime example of quantum mechanics allows us to draw parallels to the study and spectroscopy of hadrons. The hydrogen atom consists of a heavy nucleus in the form of the proton which is surrounded by a light electron. The spectrum of the hydrogen atom is sensitive to the interaction between proton and electron, which is based on the electromagnetic Coulomb interaction and described by Quantum Electrodynamics in its ultimate form. In analogy, a hadron consists of a heavy bottom quark surrounded either by a light anti-quark, to form a meson or a di-quark pair, to form a bottom baryon. The interaction between the quark and the other quark(s) in a hadron is based on the strong interaction or Quantum Chromodynamics (QCD). It is often stated that heavy quark hadrons are the hydrogen atom of QCD. The study of hadron states is thus the study of (non-perturbative) QCD, providing sensitive tests of potential models, heavy quark effective theory (HQET) and all aspects of QCD, including lattice gauge calculations.
I.1 Hadron Lifetimes
In the spectator model of hadron decay, the quark decays like a free particle. The other (anti-)quark(s) in the hadron act as pure spectators without influencing the quark decay. In such a simple weak decay picture, the lifetimes of all hadrons would be equal. In reality, the strong force in the form of gluons, coupling to the quarks, as well as final state interactions, influence the pure weak decay. Measurements of hadron lifetimes thus study the interplay between the strong and weak interaction. Predictions of hadron lifetimes are provided in the heavy quark expansion (HQE) which in turn allows us to expand the inclusive decay width in powers of the bottom quark mass
| (1) |
In HQE short distance effects contained in the Wilson coefficients , evaluated in perturbation theory, are separated from long distance physics represented by the matrix element to be computed through non-perturbative QCD sum rules, operator product expansion methods or lattice QCD calculations. In HQE the order distinguishes meson versus baryon decays while spectator effects of order differentiate between the lifetimes of , and mesons. These calculations allow for precise predictions of hadron lifetimes where many can be found in the literature. Reference [4] only quotes a few of them. Most of these predictions can be summarized in form of the following estimates for hadron lifetime ratios
| (2) |
Measurements of hadron lifetimes thus test the validity of HQE, a technique which is also used to supply input for the extraction of elements of the Cabibbo-Kobayashi-Maskawa (CKM) quark mixing matrix.
Since history always provides guidance, Figure 1 shows the history of measurements of the average hadron lifetime which starts with the first measurement of the average lifetime of bottom hadrons [5] in 1983. The Mark II detector measured ps which is within large errors in agreement with the current average hadron lifetime as determined by the Particle Data Group (PDG) [6]. However, Figure 1 indicates that all early measurements of bottom hadron lifetimes appear to obtain low central values compared to the current world average until the availability of precision measurements pined down the current world average. Such an effect seems to repeat itself in other hadron lifetime measurements as we shall see later.

II Experimental Environment
The producers of hadrons containing quarks are currently the KEKB and PEP-II colliders together with the Belle and BABAR experiments, as well as the Fermilab Tevatron where the CDF and D0 experiments are operating. At the Fermilab Tevatron all hadrons are produced. Besides the and meson, which are the only bottom hadrons produced at the factories operating at the resonance, the Tevatron is a source for and mesons as well as baryons containing quarks such as the , or . It has been common believe that the study of properties is the domain of the CDF and D0 experiments operating at the Tevatron.
However, it has recently become possible to produce events in sufficiently large numbers in collisions at the resonance which can decay into pairs of , or . The KEKB collider operating at the resonance at a center-of-mass energy of GeV has delivered a dataset to the Belle detector in 2005 and 2006 totaling an integrated luminosity of fb-1. From a study [7] of reconstructed decays , Belle has reported the measurement of the branching fraction , where the largest systematic error, which is due to the uncertainty in the production fraction , is quoted separately. The obtained branching fraction is compatible with the CDF result [6, 8] and is slightly higher than by . In addition, Belle observes signal events from decays and measures the branching ratio with a significance of .
After a successful 1992-1996 Run I data taking period of the Fermilab Tevatron (for a review of physics results from e.g. CDF in Run I see Ref. [9]), the Tevatron operates in Run II at a centre-of-mass energy of 1.96 TeV with a bunch crossing time of 396 ns generated by bunches. The initial Tevatron luminosity steadily increased from 2002 to 2008 with a peak luminosity of cm-2s-1 reached in 2008. The total integrated luminosity delivered by the Tevatron to CDF and D0 at the time of this conference is fb-1 with about fb-1 recorded to tape by each collider experiment. However, most results presented in this review use about 1-3 fb-1 of data. The features of the CDF and D0 detectors are described elsewhere in References [10] and [11], respectively. For the remainder of this paper, we will focus on results from the Tevatron experiments CDF and D0.
III PROPERTIES OF MESONS
In the neutral system there exist two flavour eigenstates, the and . The time evolution of these states is governed by the Schrödinger equation
| (3) |
where M is the mass matrix and is the decay matrix. The mass eigenstates and are admixtures of the flavour eigenstates and :
| (4) |
The fact that the mass eigenstates are not the same as the flavour states gives rise to oscillations between the and states with a frequency proportional to the mass difference of the mass eigenstates, . In the standard model (SM) particle-antiparticle oscillations are explained in terms of second-order weak processes involving virtual massive particles that provide a transition amplitude between the and states. The decay width difference between the mass eigenstates is related to the phase . Assuming no violation in the system, which is justified in the standard model where the phase is expected to be small ( [12]), the mass eigenstates are also eigenstates where is the width of the even state corresponding to the short lived state in analogy to the kaon system where the short-lived state () is even. is the width of the odd state corresponding to the long lived state.
Thus the experimental observables describing the system are the masses and of the mass eigenstates accessible through a measurement of the mass difference in - oscillations. Other experimental quantities are the width difference , the total decay width , which is related to the mean lifetime , as well as the phase .
III.1 Measurements of the Meson Lifetime
In the light of a substantial width difference , the system contains short- and long-lived components similar to the kaon system and various decay channels will have different proportions of the and eigenstates. Lifetime measurements of different final states have therefore different meaning and can be broken down into several categories. First, there are flavour specific decays, such as semileptonic or decays, which have equal fractions of and at proper time zero from where both components will evolve with their specific lifetimes and . Fitting a single exponential to such a decay distribution measures the flavour specific lifetime
| (5) |
Second, there is the specific lifetime measured in decays that are assumed to be either even or odd. For example, the exclusive decay is expected to be even within 5% and measures the lifetime of the light mass eigenstate . In 2006, CDF reported a preliminary measurement of ps from . Finally, there are decays into a mixed final state where it is possible to disentangle the final state components. For example, an angular analysis can be used to decompose the components in the exclusive decay which is expected to be dominated by the even state and its lifetime.
III.1.1 Flavour Specific Lifetime


CDF presented a new measurement of the flavour specific lifetime at this conference. In a data sample of fb-1 of collisions, CDF reconstructs candidates through its decay followed by with . This sample yields more than 1100 fully reconstructed candidates as shown in Fig. 2(a). In addition, this sample also includes about 2000 partially reconstructed candidates that contribute to the fit of the lifetime distribution shown in Fig. 2(b). CDF obtains the flavour specific lifetime ps. The ratio of this result and the world average lifetime [6] yields in good agreement with theoretical predictions. Note, using the 2008 PDG mean lifetime [6] results in . A compilation of all flavour specific lifetime measurements to date is given in Fig. 2(c) and the world averaged flavour specific lifetime including the new CDF result is determined to be ps [13].
III.1.2 Lifetime from and Measurement of
The decay is the transition of the spin-0 pseudo-scalar into two spin-1 vector particles. The orbital angular momenta of the vector mesons, and , can be used to distinguish the even -wave () and -wave () final states from the odd -wave () final state. Typically the set of decay angles defined in the transversity basis (see e.g. Ref. [14]) is used to disentangle the mixture of the final state. Such an angular decomposition reveals that the decay is dominated by the even state.
The experimental situation with respect to measurements of the mean lifetime from assuming no violation is as follows: The D0 collaboration has published [15] a result based on 2.8 fb-1 of data, while the CDF collaboration updated their published result [14] based on 1.35 fb-1 for this conference with a preliminary result using 2.8 fb-1 of data. The D0 analysis identifies signal events [15] as shown in Figure 3(a) while CDF finds signal events in 2.8 fb-1 of data. With these events D0 measures a mean lifetime ps and quotes ps-1 assuming no violation in the decay. The corresponding numbers from the preliminary CDF analysis are ps and ps-1. As can be seen in the lifetime distributions of Fig. 3(b), the lifetime distribution is mainly even while the odd component is much smaller. A compilation of various measurement of is shown in Figure 3(c). The preliminary CDF result mentioned above is not yet included in the world average of ps-1 [13]. When these direct measurements of are combined with the flavour specific lifetime measurements discussed in Sec. III.1.1, a constrained result of ps-1 is obtained [13].


III.2 Violation in
In analogy to measurements of the time dependent asymmetry in neutral decays into e.g. accessing the violating phase which arises through the interference between decay and mixing, the application of flavour tagging to events measures the corresponding phase in decays. This phase, which is responsible for violation in in the standard model, is in analogy to the phase called and is defined as . In the context of the standard model, this phase is expected to be small and global fits of experimental data constrain it to [12, 13]. Measuring such a small value of is currently beyond the experimental reach at the Tevatron. However, new physics may contribute significantly larger values to the violating phase in decays [12, 16, 17]. In this case, the observed phase would be modified by a phase due to new physics processes, and can be expressed as . If , we expect . We can then make the approximation for the observed quantities . The current interest in measuring violation in is therefore a search for enhanced violation through new physics processes.
At the 2008 winter conferences both Tevatron experiments presented tagged, time dependent angular analyses of decays. Due to the non-parabolic behaviour of the log-likelihood function, no meaningful point estimates for can be quoted and both experiments construct their results as confidence level regions in the plane of versus . The D0 result [15] based on 2.8 fb-1 of data is shown in Figure 4(a) while the CDF result from 1.35 fb-1 of data [18] is displayed in Figure 4(b). Both experiments observe a mild inconsistency with the SM prediction . Interestingly, the CDF and D0 inconsistencies with the standard model both point in the same direction. Assuming the SM prediction, CDF quotes a probability of 15% to observe a likelihood ratio equal or higher than the one observed in data which corresponds to about . Using constraints on the strong phases, D0 finds a -value of 6.6% corresponding to a inconsistency with the SM hypothesis [15].


There are two new results on violation in presented at this conference. First, D0 released their data without a constraint on the strong phases allowing for a combination of the CDF and D0 likelihoods obtained in their flavour-tagged time-dependent analyses. The combined result is shown in Figure 5(a) and restricts to the interval at 90% confidence level (CL). The consistency of the combined result gives a -value of 3.1% corresponding to a discrepancy with the SM prediction. Second, CDF released an update of their published analysis [18] using 2.8 fb-1 of data. The new result again shown as a confidence region in the plane of versus , as displayed in Figure 5(b), confirms the trend of the published result. CDF finds that the -value at the SM expectation is 7% corresponding to a discrepancy with the standard model. Furthermore, CDF determines that the projected one-dimensional range for is confined to the interval at 68% CL.


The updated CDF analysis was obtained with a suboptimal dataset which did not allow for the use of particle identification for the entire data selection and restricted the application of same side kaon flavour tagging to the first half of the data. To estimate the future reach of this analysis, CDF’s expected sensitivity of measuring a value of for various integrated luminosities ranging from 1.35 fb-1 up to 10 fb-1 of data is shown in Figure 5(c). With about 5 fb-1 of data, the probability to measure an assumed value of is about 50% which puts some excitement on awaiting further updates of the measurement of in from the Tevatron.
IV PROPERTIES OF OTHER HEAVY MESONS
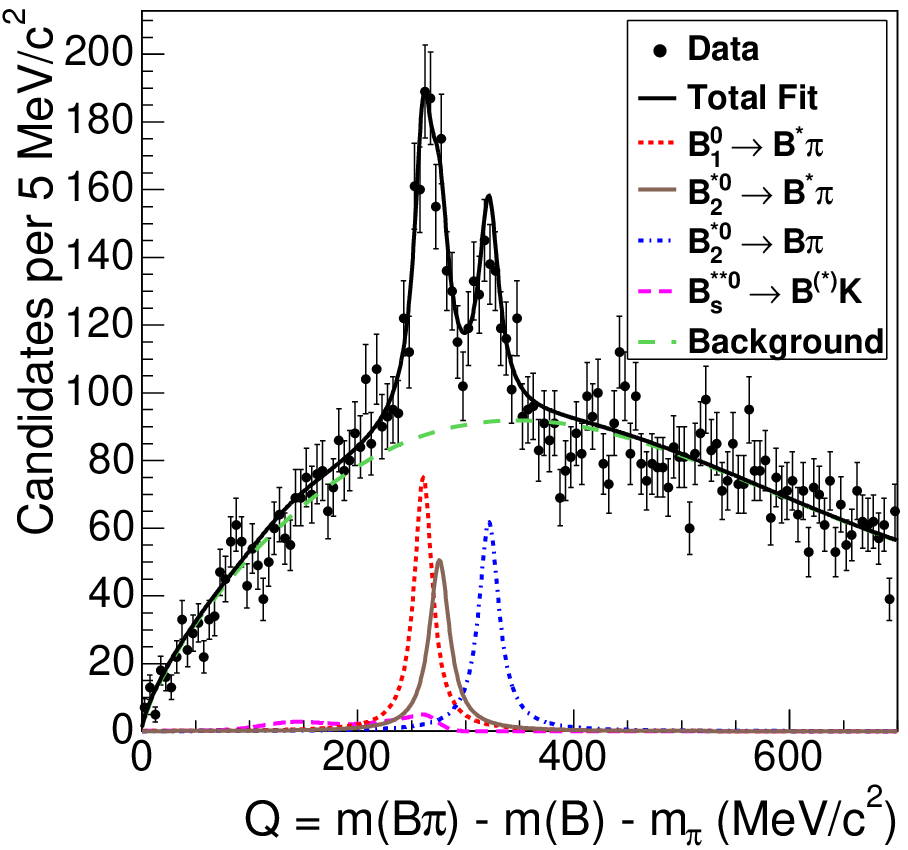
IV.1 Orbitally Excited Mesons
Until a couple of years ago, excited meson states containing quarks had not been studied well. Only the stable ground states , and and the excited state had been firmly established. Quark models predict the existence of two wide ( and ) and two narrow ( and ) bound -states [19]. The wide states decay via an -wave and therefore have a large width of a couple of hundred MeV, which makes it difficult to distinguish such states from combinatoric background. The narrow states decay via a -wave transition () and thus should have a small width of [20, 21]. Almost all previous observations [22, 23] of the narrow states and have been made indirectly using inclusive or semi-exclusive decays which prevented the separation of both states and a precise measurement of their properties. In contrast, the masses, widths and decay branching fractions of these states are predicted with good precision by theoretical models [20, 21].
and candidates are reconstructed in the following decay modes: with and with as well as . In both cases the soft photon from the decay is not observed resulting in a shift of about 46 MeV in the mass spectrum. D0 reconstructs candidates in the fully reconstructed mode with , while CDF selects mesons in addition through the and mode with . The CDF analysis [24] is based on 1.7 fb-1 of data resulting in a signal of events as well as and 11 000 candidates in the and channels, respectively. The D0 measurement [25] employs 1.3 fb-1 of Run II data and finds a signal peak of events attributed to the decay .
D0 presents their measured mass distribution as as shown in Figure 6(a), while CDF plots as displayed in Fig. 6(b). Clear signals for the narrow excited states are observed: CDF reconstructs a total of about 1250 candidates while D0 observes a total of candidates for the narrow states. The measured masses are reported as MeV and MeV from D0, while CDF quotes MeV and MeV. Both results are in modest agreement.

IV.2 Orbitally Excited Strange Mesons
The properties of excited meson states, referred to as , and the comparison with the properties of excited states in the and systems provides good tests of various models of quark bound states [19, 20, 26]. These models predict the existence of two wide resonances ( and ) and two narrow ( and ) bound -states. The wide states decay through an -wave and thus have a large width of order hundred MeV. This makes it difficult to distinguish such states from combinatoric background. The narrow states decay through a -wave () and therefore should have a small width of order 1 MeV [21] varying with predicted mass. If the mass of the orbitally excited is large enough, then the main decay channel should be through as the decay mode is not allowed by isospin conservation. Previous observations [22] of the narrow -states have been made indirectly preventing the separation of both states.
and candidates are reconstructed in the following decay modes: with and with as well as . In both cases the soft photon from the decay is not reconstructed resulting in a shift in the mass spectrum. D0 selects candidates in the fully reconstructed mode with , while CDF reconstructs mesons in addition through the mode with . The CDF and D0 measurements are based on 1.0 and 1.3 fb-1 of Run II data, respectively. The CDF analysis [27] finds events and candidates in the channel. The D0 measurement [28] uses a signal of events from the decay . Both experiments present their mass distributions in the quantity as displayed in Figure 7(a) and (b).


A clear signal at MeV is observed by CDF and D0 (see Fig. 7), which is interpreted as the state. CDF reconstructs events in the peak at while D0 reports events at . In addition, CDF observes events in a peak at which is the first observation of this state interpreted as . A similar structure in the Q value distribution from D0 has a statistical significance of less than . The measured masses are reported as from D0, while CDF quotes and , where the statistical and systematic errors are added in quadrature. The results from CDF and D0 are in good agreement.
IV.3 Meson Properties
The meson with a quark content is a unique particle as it contains two heavy quarks that can each decay via the weak interaction. This means transitions of the or quark contribute to the decay width of this meson. The decay can occur via the quark in a transition with a in the final state (hadronic or semileptonic which is the mode in which the meson was discovered by CDF in Run I [29]) or via the quark in a transition with a in the final state (hadronic or semileptonic ). In addition, the quark pair can annihilate into a boson with a lepton or quark pair coupling to the for a or transition. The decays of both heavy quarks suggest copious decay modes and an expected lifetime much shorter than that of other mesons. The lifetime of the meson is thus predicted from theory to be around 0.5 ps [30], while a measurement of the mass tests potential model predictions as well as lattice QCD calculations.
IV.3.1 Mass of the Meson
The mass of the meson has been predicted using a variety of theoretical techniques. Non-relativistic potential models [31] have been used to predict a mass of the in the range 6247-6286 MeV, and a slightly higher value is found for a perturbative QCD calculation [32]. Recent lattice QCD determinations provide a mass prediction of [33]. Precision measurements of the properties of the meson are thus needed to test these predictions.
CDF and D0 both use fully reconstructed decays for a precise measurement of the mass. CDF first published their analysis [34], based on 2.4 fb-1 of data, where the selection is optimized on the signal yield of and the obtained selection criteria are directly transferred to the data for an unbiased selection. A signal of events with a significance greater than is observed. The mass of the meson is measured to be . To test the background reduction process, the D0 analysis [35], based on 1.3 fb-1 of data, uses a well-understood signal sample of data. After the final selection the invariant mass distribution of candidates from D0 is obtained as shown in Figure 8(a). An unbinned likelihood fit yields a signal of events corresponding to a significance of . The extracted mass value is reported as . Combining both results yields a world average mass of . In comparison to theoretical predictions [31, 32, 33], the experimental measurements, especially the CDF result with small uncertainties, start to challenge the predictions of theoretical models and lattice QCD calculations.


IV.3.2 Lifetime of the Meson
As discussed above, the decay of a meson can occur via a transition, a transition or a quark pair annihilation into a boson leading to an expected lifetime of order ps [30], only one third that of other mesons. Due to the large branching fraction, CDF and D0 both use the semileptonic decay with for their measurement of the lifetime. The main issue in using a semileptonic decay is to control the backgrounds since no mass peak can be reconstructed. Since the event signature is two muons forming the meson plus a third lepton, the background sources are fake ’s, fake leptons, or uncorrelated real ’s and leptons from events where the is from one quark while the lepton is from the other quark jet. In the channel, which is only used by CDF, there is an additional background of electrons from residual photon conversions within the detector material. CDF and D0 estimate the backgrounds with Monte Carlo or based on data depending on the analysis approach. The D0 analysis [36], using 1.3 fb-1 of data, identifies signal candidates and measures the lifetime as ps.
In a preliminary analysis, based on 1 fb-1 of data, CDF analyzes both the and final state in the invariant mass range between 4-6 GeV, in which the signal is expected to lie. The CDF lifetime distribution with the various background sources indicated is shown in Figure 8(b) for the mode. Combining the electron and muon channel, CDF measures ps. A compilation of both measurements together with an older CDF Run I result is displayed in Figure 8(c) and a world average lifetime of ps is determined in good agreement with theoretical predictions.
V PROPERTIES OF BOTTOM BARYONS
The QCD treatment of quark-quark interactions significantly simplifies if one of the participating quarks is much heavier than the QCD confinement scale . In the limit of , where is the mass of the heavy quark, the angular momentum and flavour of the light quark become good quantum numbers. This approach, known as heavy quark effective theory, thus views a baryon made out of one heavy quark and two light quarks as consisting of a heavy static color field surrounded by a cloud corresponding to the light di-quark system. The two quarks form either a or di-quark under SU(3), according to the decomposition , leading to a generic scheme of baryon classification. Di-quark states containing quarks in an antisymmetric flavour configuration, , are called -type whereas states with di-quarks containing quarks in a flavour symmetric state, , are called -type. For baryons with a bottom quark, this classification gives the ground state baryon with quark content and the baryons with quark content and . If one of the light quarks is a strange quark, we classify the bottom baryon as a cascade baryon and the double strange bottom baryon is the with quark content .
V.1 The Lifetime Story
The mass of the ground state bottom baryon, the , has been established for quite some time with the current mass value [6]. However, the lifetime of the baryon has been puzzling the community for a long time. The situation of lifetime measurements as of 2006 is summarized in Figure 9(a). A world average lifetime of ps is quoted by the PDG in 2006 based on several LEP measurements, one CDF Run I measurement and the first Run II measurement with 0.25 fb-1 from D0 [37] using the decay mode . The 2006 world average lifetime translates into a lifetime ratio . This number is on the low side of theoretical predictions which are in the range of . This introduces the long-standing puzzle that the lifetime is measured smaller than theoretical predictions.


Then in 2007, the D0 experiment updated its measurement of the lifetime from with 1.2 fb-1 of data [38] measuring ps resulting in a lifetime ratio . In the same year D0 released another measurement [39] of the lifetime using semileptonic decays . In 1.2 fb-1 of collision data, D0 identifies signal candidates and measures ps. Both D0 results are in good agreement with the 2006 world average lifetime. In the same year in 2007, CDF published a measurement of the lifetime in the exclusive decay using 1.2 fb-1 of data [40]. The resulting ps was the single most precise measurement of but is higher than the 2006 world average. This surprising fact is also evident when forming a ratio with the world average lifetime yielding larger than one! This result was a big surprise and further measurements were needed to resolve the situation.
New in 2008 is a preliminary CDF measurement of the lifetime using fully reconstructed decays with . With a dataset of 1.2 fb-1, CDF obtains a clean sample of about 3000 fully reconstructed signal events. From the lifetime distribution shown in Figure 9(b), CDF measures ps and reports a lifetime ratio in good agreement with theoretical predictions. This measurement is as precise as and in good agreement with the current world average of the lifetime ps determined for the PDG 2008 edition [6] without including the new preliminary CDF result. The situation of lifetime measurements is summarized in Figure 9(c) where it can be seen that the new CDF result is also in agreement within one standard deviation with the 2007 measurement of from CDF. It appears that the longstanding puzzle surrounding the lifetime has been resolved.
V.2 and Baryons
Until recently only one bottom baryon, the , has been directly observed. The baryon has quark content and . In the -type ground state, the light di-quark system has isospin and . Together with the heavy quark, this leads to a doublet of baryons with () and (). The ground state -type baryons decay strongly to -type baryons by emitting pions. In the limit , the spin doublet would be exactly degenerate since an infinitely heavy quark does not have a spin interaction with a light di-quark system. As the heavy quark is not infinitely massive, there will be a small mass splitting between the doublet states resulting in an additional isospin splitting between the and states [41]. There exist a number of predictions for the masses and isospin splittings of these states using HQET, non-relativistic and relativistic potential models, expansion, sum rules and lattice QCD calculations [41, 42].
The CDF collaboration has accumulated a large data sample of baryons using the CDF displaced track trigger. Using a 1.1 fb-1 data set of fully reconstructed candidates, CDF searches for the decay . The CDF analysis [43] reconstructs a yield of approximately 2800 candidates in the signal region . To separate out the resolution on the mass of each candidate, CDF searches for narrow resonances in the mass difference distribution of . Unless explicitly stated, refers to both the () and () states while the analysis distinguishes between and . There is no transverse momentum cut applied to the pion from the decay, since these tracks are expected to be very soft. The result of the search in the and subsamples is displayed in Figure 10(a). The top plot shows the subsample, which contains , while the bottom plot shows the subsample, which contains . The insets show the expected background plotted on the data for [0, 500] , while the signal fit is shown on a reduced range of [0, 200] MeV. The final fit results for the measurement are summarized in Table 1. The absolute mass values are calculated using a CDF measurement of the mass [44], which contributes to the systematic uncertainty. The mass splitting between and has been set in the fit to be the same for and .


| State | Yield | or [] | Mass [] |
|---|---|---|---|
V.3 Observation of the Baryon
The baryons with a quark content of and decay weakly through the decay of the quark and are expected to have a lifetime similar to the typical hadron lifetime of about 1.5 ps. Possible decay modes of the include or . Both decays involve the reconstruction of neutral pions which is difficult to achieve at CDF and D0. However, the can decay through followed by with and . This is the decay mode in which CDF and D0 search for the baryon.
A schematics of the decay topology is shown in Figure 10(b) from where the challenges in the reconstruction become apparent. The baryon travels an average distance of m and then decays into a and which has a cm traversing parts of the silicon detector. Furthermore, the decays into a which has a cm often decaying in the inner layers of the main tracker. This brings significant challenges for the reconstruction of the decay products and their track reconstruction. The D0 analysis [45] based on 1.3 fb-1 of data runs a special re-processing of the dimuon datasets to improve the efficiency of reconstructing high impact parameter tracks in the track pattern recognition algorithm. The event selection is based on wrong-sign data and guided by Monte Carlo events. On the other hand, CDF develops a dedicated silicon-only tracking algorithm to reconstruct the charged tracks in its silicon tracker. The CDF event selection [46] based on 1.9 fb-1 of data uses a control sample where the selection criteria are developed. The is then replaced in the data analysis by the for an unbiased event selection.
Both experiments observe significant signals as can be seen in the invariant mass distribution in Figure 10(c). D0 finds signal event with a Gaussian significance of and reports a mass of [45]. CDF observes signal event with a Gaussian significance of and measures a mass of [46]. In addition, D0 verifies that the lifetime of the candidates is compatible with a hadron like lifetime.
Soon after this conference, the D0 collaboration announced the observation of another heavy bottom baryon [47], the double strange baryon with quark content . With the same dataset as used for the observation based on 1.3 fb-1 of collisions, D0 reconstructs followed by and obtains a mass measurement of based on an signal of events. The significance of the observed signal is corresponding to a probability of of it arising from background fluctuation.
VI CONCLUSION
We have reviewed recent result on heavy hadron properties focusing on Run II measurements from the Fermilab Tevatron which offers a rich heavy flavour program. A wealth of new results on properties of heavy hadron states from CDF and D0 has been available. These include measurements of the lifetime and decay width difference in meson decays, updates on violation in decays which continue to show an intriguing discrepancy with the standard model prediction. In addition, the Belle collaboration used mesons produced at the resonance to obtain competitive branching ratio measurements for decays. We also reviewed recent results on the mass and lifetime of the meson. With respect to bottom baryons, the puzzle of the lifetime measurements being lower than theoretical predictions appears to be solved. New heavy bottom baryons have been established, the states as well as the and baryon. We expect more results from the Tevatron which will accumulate more data until the end of Run II currently scheduled to conclude in 2010. With the onset of the Large Hadron Collider in 2009, more exciting result on heavy hadron properties are expected, especially from the LHCb experiment.
Acknowledgements.
This paper is dedicated to the memory of Michael P. Schmidt, Randy Pausch and all whose lives are lost to cancer. There is hope. Our personal hope includes Holcombe Grier and his outstanding team at DFCI as well as the staff and all the wonderful volunteers at Camp Sunshine. I would like to thank the organizers of this stimulating meeting, especially Joe Kroll, Nigel Lockyer and Stew Smith, for the opportunity to present these results as well as an outstanding conference organization. I am grateful to my colleagues from the BABAR, Belle, CDF and D0 collaborations for their help in preparing this talk. This work was supported in part by the U.S. Department of Energy under Grant No. DE-FG02-91ER40682.References
- [1] B. Aubert et al. [BABAR Collaboration], Phys. Rev. Lett. 101, 071801 (2008) [Erratum-ibid. 102, 029901 (2009)] [arXiv:0807.1086 [hep-ex]].
- [2] P. Grenier [BABAR Collaboration], arXiv:0809.1672 [hep-ex].
- [3] G. V. Pakhlova, arXiv:0810.4114 [hep-ex].
- [4] I. I. Y. Bigi, N. G. Uraltsev and A. I. Vainshtein, Phys. Lett. B 293, 430 (1992) [Erratum-ibid. B 297, 477 (1993)] [arXiv:hep-ph/9207214]. N. G. Uraltsev, Phys. Lett. B 376, 303 (1996) [arXiv:hep-ph/9602324]. M. Beneke, G. Buchalla, C. Greub, A. Lenz and U. Nierste, Nucl. Phys. B 639, 389 (2002) [arXiv:hep-ph/0202106]. C. Tarantino, Eur. Phys. J. C 33, S895 (2004) [arXiv:hep-ph/0310241]. F. Gabbiani, A. I. Onishchenko and A. A. Petrov, Phys. Rev. D 70, 094031 (2004) [arXiv:hep-ph/0407004].
- [5] N. Lockyer et al., Phys. Rev. Lett. 51, 1316 (1983).
- [6] C. Amsler et al. [Particle Data Group], Phys. Lett. B 667, 1 (2008).
- [7] R. Louvot et al. [Belle Collaboration], Phys. Rev. Lett. 102, 021801 (2009) [arXiv:0809.2526 [hep-ex]].
- [8] A. Abulencia et al. [CDF Collaboration], Phys. Rev. Lett. 98, 061802 (2007) [arXiv:hep-ex/0610045].
- [9] M. Paulini, Int. J. Mod. Phys. A 14, 2791 (1999) [arXiv:hep-ex/9903002].
- [10] D. E. Acosta et al. [CDF Collaboration], Phys. Rev. D 71, 032001 (2005) [arXiv:hep-ex/0412071].
- [11] V. M. Abazov et al. [D0 Collaboration], Nucl. Instrum. Meth. A 565, 463 (2006) [arXiv:physics/0507191].
- [12] A. Lenz and U. Nierste, JHEP 0706, 072 (2007) [arXiv:hep-ph/0612167].
- [13] E. Barberio et al. [Heavy Flavor Averaging Group], arXiv:0808.1297 [hep-ex].
- [14] T. Aaltonen et al. [CDF collaboration], Phys. Rev. Lett. 100, 121803 (2008) [arXiv:0712.2348 [hep-ex]].
- [15] V. M. Abazov et al. [D0 Collaboration], Phys. Rev. Lett. 101, 241801 (2008) [arXiv:0802.2255 [hep-ex]].
- [16] Z. Ligeti, M. Papucci and G. Perez, Phys. Rev. Lett. 97, 101801 (2006) [arXiv:hep-ph/0604112].
- [17] W. S. Hou, M. Nagashima and A. Soddu, Phys. Rev. D 76, 016004 (2007) [arXiv:hep-ph/0610385].
- [18] T. Aaltonen et al. [CDF Collaboration], Phys. Rev. Lett. 100, 161802 (2008) [arXiv:0712.2397 [hep-ex]].
- [19] E. J. Eichten, C. T. Hill and C. Quigg, Phys. Rev. Lett. 71 (1993) 4116 [arXiv:hep-ph/9308337].
- [20] D. Ebert, V. O. Galkin and R. N. Faustov, Phys. Rev. D 57, 5663 (1998) [Erratum-ibid. D 59, 019902 (1999)] [arXiv:hep-ph/9712318].
- [21] N. Isgur, Phys. Rev. D 57 (1998) 4041. M. Di Pierro and E. Eichten, Phys. Rev. D 64 (2001) 114004 [arXiv:hep-ph/0104208].
- [22] R. Akers et al. [OPAL Collaboration], Z. Phys. C 66 (1995) 19.
- [23] P. Abreu et al. [DELPHI Collaboration], Phys. Lett. B 345 (1995) 598. D. Buskulic et al. [ALEPH Collaboration], Z. Phys. C 69 (1996) 393. R. Barate et al. [ALEPH Collaboration], Phys. Lett. B 425 (1998) 215. A. A. Affolder et al. [CDF Collaboration], Phys. Rev. D 64 (2001) 072002.
- [24] T. Aaltonen et al. [CDF Collaboration], Phys. Rev. Lett. 102, 102003 (2009) [arXiv:0809.5007 [hep-ex]].
- [25] V. M. Abazov et al. [D0 Collaboration], Phys. Rev. Lett. 99, 172001 (2007) [arXiv:0705.3229 [hep-ex]].
- [26] A. F. Falk and T. Mehen, Phys. Rev. D 53 (1996) 231 [arXiv:hep-ph/9507311].
- [27] T. Aaltonen et al. [CDF Collaboration], Phys. Rev. Lett. 100, 082001 (2008) [arXiv:0710.4199 [hep-ex]].
- [28] V. M. Abazov et al. [D0 Collaboration], Phys. Rev. Lett. 100, 082002 (2008) [arXiv:0711.0319 [hep-ex]].
- [29] F. Abe et al. [CDF Collaboration], Phys. Rev. Lett. 81, 2432 (1998) [arXiv:hep-ex/9805034].
- [30] V. V. Kiselev, A. E. Kovalsky and A. K. Likhoded, Nucl. Phys. B 585, 353 (2000) [arXiv:hep-ph/0002127]. V. V. Kiselev, arXiv:hep-ph/0308214.
- [31] W. K. Kwong and J. L. Rosner, Phys. Rev. D 44, 212 (1991). E. J. Eichten and C. Quigg, Phys. Rev. D 49, 5845 (1994) [arXiv:hep-ph/9402210]. S. Godfrey, Phys. Rev. D 70, 054017 (2004) [arXiv:hep-ph/0406228].
- [32] N. Brambilla, Y. Sumino and A. Vairo, Phys. Rev. D 65, 034001 (2002) [arXiv:hep-ph/0108084].
- [33] I. F. Allison et al. [HPQCD Collaboration and Fermilab Lattice Collaboration and UKQCD Collaboration], Phys. Rev. Lett. 94, 172001 (2005) [arXiv:hep-lat/0411027].
- [34] T. Aaltonen et al. [CDF Collaboration], Phys. Rev. Lett. 100, 182002 (2008) [arXiv:0712.1506 [hep-ex]].
- [35] V. M. Abazov et al. [D0 Collaboration], Phys. Rev. Lett. 101, 012001 (2008) [arXiv:0802.4258 [hep-ex]].
- [36] V. M. Abazov et al. [D0 Collaboration], Phys. Rev. Lett. 102, 092001 (2009) [arXiv:0805.2614 [hep-ex]].
- [37] V. M. Abazov et al. [D0 Collaboration], Phys. Rev. Lett. 94, 102001 (2005) [arXiv:hep-ex/0410054].
- [38] V. M. Abazov et al. [D0 Collaboration], Phys. Rev. Lett. 99, 142001 (2007) [arXiv:0704.3909 [hep-ex]].
- [39] V. M. Abazov et al. [D0 Collaboration], Phys. Rev. Lett. 99, 182001 (2007) [arXiv:0706.2358 [hep-ex]].
- [40] A. Abulencia et al. [CDF Collaboration], Phys. Rev. Lett. 98, 122001 (2007) [arXiv:hep-ex/0609021].
- [41] J. L. Rosner, Phys. Rev. D 57, 4310 (1998) [arXiv:hep-ph/9707473]. J. L. Rosner, Phys. Rev. D 75, 013009 (2007) [arXiv:hep-ph/0611207].
- [42] D. P. Stanley and D. Robson, Phys. Rev. Lett. 45, 235 (1980).
- [43] T. Aaltonen et al. [CDF Collaboration], Phys. Rev. Lett. 99, 202001 (2007) [arXiv:0706.3868 [hep-ex]].
- [44] D. Acosta et al. (CDF Collaboration), Phys. Rev. Lett. 96, 202001 (2006). [arXiv:hep-ex/0508022].
- [45] V. M. Abazov et al. [D0 Collaboration], Phys. Rev. Lett. 99, 052001 (2007) [arXiv:0706.1690 [hep-ex]].
- [46] T. Aaltonen et al. [CDF Collaboration], Phys. Rev. Lett. 99, 052002 (2007) [arXiv:0707.0589 [hep-ex]].
- [47] V. M. Abazov et al. [D0 Collaboration], Phys. Rev. Lett. 101, 232002 (2008) [arXiv:0808.4142 [hep-ex]].