A census of X-ray nuclear activity in nearby galaxiesNote: Submitted to ApJ
Abstract
We have studied the X-ray nuclear activity of 187 nearby (distance Mpc) galaxies observed with Chandra/ACIS. We found that 86 of them have a point-like X-ray core, consistent with an accreting BH. We argue that the majority of them are nuclear BHs, rather than X-ray binaries. The fraction of galaxies with an X-ray detected nuclear BH is higher ( per cent) for ellipticals and early-type spirals (E to Sb), and lower ( per cent) for late-type spirals (Sc to Sm). There is no preferential association of X-ray cores with the presence of a large-scale bar; in fact, strongly barred galaxies appear to have slighly lower detection fraction and luminosity for their nuclear X-ray sources, compared with non-barred or weakly barred galaxies of similar Hubble types. The cumulative luminosiy distribution of the nuclear sources in the – keV band is a power-law with slope , from erg s-1 to erg s-1. The Eddington ratio is lower for ellipticals () and higher for late-type spirals (up to ), but in all cases, the accretion rate is low enough to be in the radiatively-inefficient regime. The intrinsic absorbing column density is generally low, especially for the less luminous sources: there appear to be no Type-2 nuclear BHs at luminosities erg s-1. The lack of a dusty torus or of other sources of intrinsic absorption (e.g., an optically-thick disk wind) may be directly related to the lack of a standard accretion disk around those faint nuclear BHs. The fraction of obscured sources increases with the nuclear BH luminosity: two thirds of the sources with erg s-1 have a fitted column density cm-2. This is contrary to the declining trend of the obscured fraction with increasing luminosities, observed in more luminous AGN and quasars.
Keywords:
X-rays: galaxies—galaxies: nuclei—galaxies: statistics—galaxies: activeI INTRODUCTION
Supermassive black holes (BHs) are now believed to exist in all massive galaxies with a spheroidal component [76, 81, 70]. Low-mass galaxies tend to harbour a nuclear star cluster, whose mass is also related to the mass of the spheroidal component [24]. But in some low-mass galaxies, nuclear BHs have also been identified [109, 26, 68, 40, 41, 14, 42]. Thus, it is still a topic of active investigation whether there is a mass threshold between spiral galaxies containing a nuclear BH or a nuclear star cluster, to what extent they coexist, and what the mass relation is between the two nuclear systems when they are both present. It is also still debated whether there is a Hubble-type threshold for the presence of a nuclear BH, that is whether late-type spiral galaxies without a spheroidal component can have nuclear BHs, and if so, whether the BH formation mechanisms and growth processes are different from those of nuclear BHs in massive spheroidals [109, 126].
The main difficulty in resolving these questions is determining which galaxies host nuclear BHs. In particular, kinematic mass determinations require prohibitively high spatial resolution at the low-mass end. When a kinematic mass determination of the central dark mass is not available (i.e., in all but a few cases), the strongest evidence of the presence of a nuclear BH comes from its accretion-powered activity [104, 75]. AGN activity can be identified either from an emission-line optical/UV spectrum from the nuclear region, or from a point-like X-ray nuclear source, or from a flat-spectrum radio core; surveys in different bands lead to different selection biases. Statistical studies of the AGN population provide direct information on what fraction and what types of galaxies contain a nuclear BH, and indirect constraints on their masses and accretion rates.
Optical spectroscopic studies such as the Palomar Survey [55, 56] and the Sloan Digital Sky Survey [48] suggest [54] that % of nearby galaxies are Seyferts, % are “pure” Low-Ionization Nuclear Emission-line Regions (LINERs), and another % are “transition objects” whose spectra are intermediate between those of pure LINERs and HII regions [51]. This means that overall, at least 4/10 of nearby galaxies contain a currently active nuclear BH. This is only a lower limit to the population of currently active nuclear BHs: another % of galaxies have an emission-line nucleus (HII nucleus). HII nuclei are powered by a compact star-forming region, but in some cases they may also harbour a weakly accreting BH. Optical surveys also show that Seyferts, LINERs and transition objects are mostly found in early-type galaxies: % of E to Sb galaxies have such nuclear signatures; conversely, almost all late-type disk galaxies are dominated by HII nuclei, and % of them have evidence of an accreting nuclear BH [54]. Thus, it is more difficult to obtain reliable BH demographics in late-type galaxies (containing smaller BHs) using optical spectroscopy, due to confusion from star formation. Spitzer’s mid-infrared spectroscopic studies [108] have recently proved more effective at finding nuclear BHs in late-type galaxies, with an AGN detection rate possibly 4 times larger than suggested by optical spectroscopic observations.
Radio-band surveys are not yet as complete or as sensitive as the Palomar or Sloan optical surveys. Nonetheless, arcsec-resolution VLA surveys at 5 GHz [129], 8.4 GHz [85] and 15 GHz [25] have confirmed the presence of AGN signatures (non-thermal radio cores) in –% of early-type galaxies, mostly Seyferts and LINERs. The radio emission in LINERs is mainly confined to a compact core or the base of a jet (sub-arcsec size); Seyferts are more often accompanied by extended (arcsec-size) jet-like features [85]. Somewhat in contrast with the optical classification, radio detections of compact cores in transition objects are much rarer; this suggests that perhaps % of transition objects are not AGN.
X-ray surveys are an under-utilized and very promising tool to further our understanding of low-level nuclear activity in the local Universe. X-ray emission probes regions much closer to the accreting BH than, for example, optical emission lines. And a direct study of the nuclear X-ray source allows better constraints on its mass accretion rate and output power, stripped of the often messy or ambiguous optical-line phenomenology of the host galaxy. Sub-arcsec spatial resolution and astrometric accuracy are required for the study of low-luminosity AGN, for at least two reasons: to confirm that an X-ray source is point-like and coincident with the optical/radio nucleus; and to separate the point-like, nuclear X-ray source from the surrounding unresolved emission (mostly from diffuse hot gas and faint X-ray binaries), which is often present in galactic cores. Only Chandra can provide such resolution and astrometric accuracy. There are still no complete, unbiased Chandra X-ray surveys of galaxies in the local universe, mostly because time-allocation constraints lead to an implicit bias towards X-ray luminous targets. However, a number of Chandra studies have targeted a sizeable fraction of nearby LINERs (about half of the LINERs in the Palomar survey; Ho [54]). They have confirmed that most LINERs and transition objects contain an X-ray luminous, accreting BH [107, 17, 93, 106, 27, 38]. More specifically, % of LINERs have an X-ray nucleus, and this fraction goes to % for the subsample of LINERs that also have a detected radio core (Ho [54] and references therein). In such Chandra studies, the typical detection limit for point-like nuclear X-ray sources is erg s-1. This is directly comparable to the detection limit of nuclear H emission in the Palomar survey, erg s-1, because, in typical Seyferts, [54]. For such low-luminosity AGN, radio and X-ray studies are in principle less affected by contamination from possible surrounding star-forming regions than studies based on photoionized H emission. It is still not known whether or what fraction of HII nuclei in late-type spirals also have an X-ray active nuclear BH, and whether there is any correlation with the presence and strength of a large-scale bar. Pioneering studies [35, 11] suggest that a few nearby late-type spirals with an optically-classified HII nucleus may harbour a low-luminosity AGN with a few erg s-1. The drawback of X-ray studies is that at such low luminosities, it becomes extremely difficult to determine for any individual galaxy whether the nuclear source is the accreting supermassive BH or an unrelated X-ray binary in the dense nuclear region or in a nuclear star cluster.
X-ray surveys, in combination with other bands, can do more than just refine our statistical census of active nuclei across the Hubble sequence: they can be used to obtain a physical understanding of the process of accretion across the whole range of mass accretion rates. A fundamental issue that deserves investigation is whether there is a continuous distribution of nuclear X-ray activity from the most luminous quasars () to run-of-the-mill Seyferts (–), LINERs (–) transition objects (–) all the way down to “quiescent” galactic nuclei such as the BH in the Milky Way or in nearby elliptical galaxies (); or, instead, whether there is a series of clear thresholds along this sequence, corresponding to fundamental changes in the accretion mode and inflow structure. Such transitions may or may not coincide with the “canonical” accretion states found in stellar-mass BHs. Moreover, thresholds in the X-ray properties may or may not coincide with optically-classified classes of AGN.
One such physical transition may be between accreting BHs with and without an optically-thick accretion disk. The presence or absence of disk signatures such as Compton reflection and a broad Fe line in the X-ray spectra can provide strong constraints, in parallel with the presence or absence of a UV bump in the spectral energy distribution. It was suggested [54] that the disappearance of the inner disk marks the transition between Seyferts and LINERs. A related issue yet to be properly understood in low-luminosity AGN is the redistribution of the accretion power between a radiative component (UV/X-rays), a mechanical component (radio jets) and an advected component; AGN become radio louder at lower accretion rates, in agreement with the trend seen in Galactic BHs [23, 79]. Order-of-magnitude estimates of the accretion rate based on the mass-loss rate from evolved stars and the gravitational capture rate of hot gas from the interstellar medium typically lead to large overestimates of the nuclear BH luminosity, especially in LINERs and transition objects [54]. Therefore, such objects are an ideal test for radiatively inefficient accretion models such as Advection-Dominated Accretion Flows (ADAF) or Radiatively Inefficient Accretion Flows (RIAF) [89, 100, 86, 132]. X-ray studies also allow quantitative comparisons between the amount of gas that is used for star formation in the nuclear region of late-type spirals, and that used for fuelling a possible accreting BH (or an upper limit to that accretion rate), and how this ratio depends on Hubble type and bar structure.
Another physical problem that can be addressed with X-ray surveys is the validity of the unified model [1] at low accretion rates and low luminosities (– erg s-1). The standard unified model is based on the presence of a geometrically and optically thick parsec-scale structure (“dusty torus”) that blocks our direct view of the innermost disk in high-inclination sources (Type-2 AGN). The nature and physical structure of the obscuring material is still controversial. In alternative to the parsec-scale torus scenario, it was suggested that the absorption could instead be due to an optically-thick disk wind, launched from a few 100 Schwarzschild radii [18, 19, 84, 83]. X-ray spectral surveys of low-luminosity AGN are crucial to determine whether the thick absorber disappears along with the disk signatures (which would point to an intimate connection between the two components), and at what luminosities. We already know that there are no dusty tori around extremely faint BHs such as the one in our Galaxy. Chandra and XMM-Newton studies show low absorbing column densities and weak or undetected narrow Fe K emission in a large fraction of nearby LINERs, which suggests a direct, unobstructed view of the nucleus [54]. In contrast, strong Fe K emission [6] and a nearly continuous distribution of absorbing columns [92] suggest that Seyferts are more gas-rich than LINERs.
To address those issues, we have collected and analyzed the archival Chandra data available for nearby galaxies (see Section 2 for the selection criteria of our sample). In this paper, we present preliminary results of our X-ray population study, focussing in particular on the luminosity distribution and on the dependence of the absorbing column density on the nuclear luminosity.

II SAMPLE SELECTION
In general, we have two choices when selecting a sample of nearby galaxies for X-ray population studies of their nuclei. We can select all targets observed by Chandra within a certain distance or flux detection limit; this sample will probably be biased in favour of X-ray luminous galaxies (or galaxies with starbursts, or with some other X-ray peculiarities), which are more likely to be selected as targets. Alternatively, we may select a limited sub-sample of such targets, which may be regarded as complete (or at least unbiased) according to some optical criteria.
For our work, we have started from an optically/IR selected sample previously used by Swartz et al. [116] and Swartz et al. (2009, in prep.) for a statistical X-ray study of ultraluminous X-ray sources (ULXs) population. This sample is defined as a volume-limited set of galaxies within Mpc that are both contained in the Uppsala Galaxy Catalog (UGC; Nilson [90]) with photographic magnitude mag, and in the Infrared Astronomical Satellite (IRAS) catalogs [30, 82] with a flux erg cm-2 s-1, where erg cm-2 s-1 [102]. Here, and are the total flux densities, expressed in Jy, at 60 and 100 m respectively. The IRAS catalogs are complete to approximately 1.5 Jy for point-like sources. The UGC contains all galaxies north of B1950 . This combined selection criteria favor nearby, predominantly optically-bright galaxies with at least a modest amount of recent star formation. The sample is known to exclude smaller dwarf galaxies in the neighborhood [116]. Most ellipticals would be included by the selection criteria; however, there are not many Northern-hemisphere nearby ellipticals (this bias is further discussed in Swartz et al. 2009, in prep.). There are 140 galaxies in this complete sample. However, only 116 have been observed with Chandra; the rest only have XMM-Newton and ROSAT data, which are less suitable for our study due to their larger point-spread-functions. Nonetheless, we estimate that the bias introduced by the lack of Chandra coverage for those 24 galaxies out of 140 is minimal. Henceforth, we will refer to this subsample of 116 galaxies as the optical/IR sample, for simplicity. The morphological classification of those 116 galaxies is: 3% ellipticals; 44% early-type spirals (S0 through Sb); 42% late-type spirals (Sc through Sm); 11% dwarfs/irregulars. The optical line classification is: 9% Seyfert; 11% LINERs; 11% transition objects; 29% HII nuclei; 40% unknown.
We have then used a larger sample, defined by Liu (2009, in prep.): it includes all Chandra/ACIS targets within Mpc, contained in the Third Reference Catalog of Galaxies [10, RC3;], which is complete for nearby galaxies having apparent diameters at the D25 isophotal level and total B-band magnitudes mag, in both the Northern and Southern sky. We have taken all the Chandra/ACIS targets within this sample (as of the end of 2007); the exposure times range from 500 s to 120 ks. This selection adds another 71 galaxies to those already contained in the optical/IR sample. The Liu sample is slightly biased in favour of the brighter and larger galaxies, as expected; it is essentially an X-ray selected sample, because only per cent of the RC3 galaxies have been Chandra targets. From the morphological point of view, the Liu sample has an overabundance of early-type spirals, which somewhat compensates the bias of the optical/IR sample in favour of late-type galaxies; moreover, it includes a few Southern-hemisphere ellipticals, lacking from the optical/IR sample.
In summary, there are altogether 187 nearby galaxies with publicly-available Chandra observations (as of December 2007) included either in the optically/IR-selected sample or in the X-ray-selected sample, within 15 Mpc (full list in Table 1)11 1 We excluded M 31-Andromeda from the sample. Its nuclear BH has a – keV luminosity erg s-1 [31]; this would be below the detection limit for all other galaxies in our sample.. More than half (104/187) of those galaxies are also included in the optical Palomar sample. The morphological classification of those 187 galaxies is: 8% ellipticals; 43% early-type spirals (S0 through Sb); 36% late-type spirals (Sc through Sm); 13% dwarfs/irregulars. The optical line classification is: 8% Seyfert; 11% LINERs; 10% transition objects; 40% HII nuclei; 31% unknown. For simplicity, we will call this sample of 187 galaxies the “extended sample”.
III DATA ANALYSIS AND RESULTS
For each of the 187 Chandra target galaxies in our extended sample, we searched for a point-like X-ray source at or close to the nuclear position. For the nuclear coordinates, we generally referred to the positions listed in the NASA/IPAC Extragalactic Database (NED22 2 http://nedwww.ipac.caltech.edu/). In most cases, they come from the Two Micron All Sky Survey (2MASS) catalog [110]; the semi-major axes of the 95% confidence ellipse vary between and . In a few cases, the NED positions come from the Sloan Digital Sky Survey Data Release 633 3 http://www.sdss.org/dr6 (semi-major axes ), or from VLA radio observations (for example in the case of NGC 4203, with semi-major axes ).
We used the Chandra Interactive Analysis of Observations software (CIAO) V4.1 for filtering and analyzing the event files. For each Chandra observation, we checked and screened out exposure intervals corresponding to background flares. We used the standard task wavdetect to identify sources in the nuclear region of each galaxy. The morphologies of the nuclear regions in the Chandra images can be loosely grouped into four classes (Figure 1): (I) a dominant nuclear source; (II) a nuclear source embedded in extended, unresolved emission; (III) unresolved emission in the nuclear region but no point-like source; (IV) no nuclear source at all44 4 This classification is reminiscent of, but not identical to the X-ray morphological classification in Ho et al. [59].. Eighty-six of the 187 galaxies in our sample belong to class I and II, that is have a point-like X-ray source within of the independently-identified nuclear position (details in Section 3.1). For all the nuclear sources, we extracted spectra (in the – keV band) from circular regions of radius (which include % of the counts), and corresponding background and response files using the CIAO task psextract. We used XSPEC Version 12.1 [2] for spectral modelling. We used the Cash statistics [7] for sources with counts, and the statistics (with suitably binned data) in the other cases. In addition, some galaxies have been the target of detailed Chandra studies in the literature: in those cases, we have used their spectral results to complement our analysis.
III.1 Census of nuclear X-ray sources
For the optical/IR sample, per cent (27 out of 53) of early-type galaxies (Hubble types E to Sb) have a point-like nuclear X-ray core (Table 2). By contrast, this proportion drops to per cent (20 out of 63) for later Hubble types (Sc to Sm and Irr). Most Seyferts (7 out of 9) and LINERs (12 out of 13) have a detected X-ray nucleus; this proportion drops to less than half for transition objects (5 out of 12) and HII nuclei (16 out of 46).
For the extended sample, per cent (57 out of 94) of early type galaxies have an X-ray nucleus, but only per cent (29 out of 93) of later Hubble types. More than per cent (33 out of 36) of Seyferts and LINERs are X-ray detected, while an X-ray core is found in per cent of transition objects (12 out of 20) and per cent of HII nuclei (18 out of 54). Thus, the optical/IR sample and the extended sample are consistent with each other.
The numbers above are roughly consistent with the AGN fraction inferred from optical spectroscopic studies [54] in early-type (– per cent) and late-type ( per cent) galaxies respectively. There is a slight overabundance of X-ray core detections in late-type spirals compared with the optical AGN fraction in the Palomar sample, and with the estimates of Hao et al. [49] from the Sloan Digital Sky Survey (based on H and [OIII] emission lines). This might be due to contamination from high-mass X-ray binaries, but we do not think this is a very significant effect (see Section 3.3). It is more likely due to the negligible effect, through heating and photo-ionization, that a faint X-ray core ( erg s-1) would have on the optical/UV nuclear spectrum; as a result, it may not appear as an active nucleus in the Palomar sample. See also Hopkins et al. [60] for a discussion of how optical surveys may miss low-luminosity AGN, or erroneously classify them as optically-obscured, because of dilution effects. Another reason why nuclear activity is more often detected in the X-ray band is that optical emission lines from the nuclear BH may be more severely obscured by dust in the surrounding star-forming environment.
We then searched for possible correlations between the presence of a nuclear X-ray source and of a large-scale bar. In the optical/IR sample, X-ray cores are found in per cent of non-barred (SA) galaxies (21 out of 34) and weakly barred (SAB) galaxies (16 out of 27), and in per cent of strongly barred (SB) galaxies (6 out of 26). For the extended sample, nuclear sources are detected in per cent (30 out of 48) of SA, per cent (24 out of 41) of SAB and per cent (16 out of 42) of SB galaxies. Part of this effect is due to the larger presence of early-type spirals among the SA and SAB classes. To remove this bias, we compared the effect of a bar separately within the early-type and late-type spiral subsamples (Table 3). We still find a slightly higher fraction of active nuclei in the SA/SAB classes compared with the SB class. In early-type spirals, per cent of non-barred/weakly-barred galaxies have an active nucleus, compared with about half for strongly-barred galaxies; in late-type spirals, about half of non-barred/weakly-barred galaxies have an X-ray core, but only about 1/4 of strongly-barred galaxies. This confirms that bar structures have no positive influence on nuclear BH feeding [58, 103]. If anything, there may be a slight anticorrelation (see also Section 4), but it may be still be attributed to small number statistics.

III.2 Spectral modelling and luminosity distribution
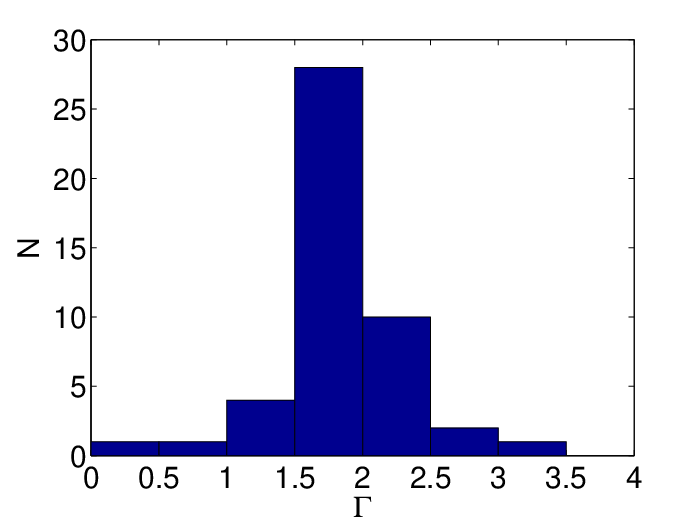
There are about 15 sources with – net counts: these are significant detections because the expected positions are independently known, the background level is very low, and there are no other point-like sources nearby. We used the Bayesian method of Kraft et al. [72] to confirm the significance of those detections. For sources with such a low number of counts, we fitted their spectra with a simple power-law model with fixed galactic absorption (no intrinsic absorption). For other sources with more counts, we used an absorbed power-law model with free intrinsic column density . A power-law with cold absorption generally provides a good fit for most of the sources. However, about 20 nuclear sources clearly require an additional ionized absorber and/or an optically-thin thermal-plasma emission component, which we have included in our spectral fits. Figure 2 shows the distribution of the fitted photon indices for the optical/IR sample and the extended sample. Most of the nuclear sources have a photon index –, which is the typical range for AGN. Figure 3 shows the distribution of the intrinsic for the two samples (which are once again consistent with each other). It is clear that most nuclear sources are not heavily obscured: very few of them can be classified as Type-2, in the unified scheme (see Section 3.4).
We then used the fitted values of photon index and absorption to estimate the intrinsic – keV isotropic luminosities of all 86 nuclear sources in the extended sample (Table 4 and Figure 4). The cumulative luminosity distribution is consistent with a power-law with a slope of above ergs s-1, which we estimate as the completeness limit, based on the exposure times and detection thresholds for the shortest observations in our sample. Because of the different exposure times and distances of our galaxies, in addition to non-constant background levels in the nuclear regions, it is not meaningful to give a detection threshold for the whole sample.


III.3 Physical identification of the nuclear X-ray source population
The main problem affecting X-ray surveys of low-luminosity ( erg s-1) nuclear BH activity is the possibility of confusion with X-ray binaries, in the overlapping range of luminosities. A typical example is the nuclear X-ray source in M 33 [33, 16]. Detailed investigations of individual galactic nuclei [35] have highlighted the difficulties and ambiguities of any such identifications. On a statistical basis, the slope and normalization of the cumulative luminosity distribution in our extended sample (Figure 4) is also consistent with the luminosity distribution of a population of high-mass X-ray binaries, in a galaxy or ensemble of galaxies with a total star formation rate of yr-1 [46, Eq. 5], for which we would also expect an integrated H luminosity erg s-1. This could be a priori consistent with our sample, if the majority of our 187 galaxies were in the high-luminosity tail of the HII nuclei distribution [57]. However, there are a few arguments in support of a nuclear BH identification for the majority of our 86 nuclear X-ray sources.

Firstly, we limited our sample to X-ray sources located within (typically, – pc for the majority of our galaxies) of the independently known nuclear position. When we considered the annulus between and around the nuclear position (a projected area 24 times larger), we found only sources, identified with the same criteria used for the 86 nuclear sources. Such a concentration of point-like X-ray sources exactly at the nucleus but not in its immediate surroundings is much cuspier than typical projected stellar densities (except when the galaxy has a nuclear star clusters) or densities of star formation rate. And the argument is even stronger if we consider that high-mass X-ray binaries may easily disperse over pc in their lifetime, owing to proper motion: thus, it would be even more unlikely to find most of them exactly at the nuclear position.
Secondly, our cumulative luminosity distribution is consistent with an unbroken power-law up to erg s-1, where we run out of galaxies in our sample (Figure 4). Instead, the luminosity distribution of high-mass X-ray binaries (including ultraluminous X-ray sources) shows a downturn at erg s-1 [46, 115]. A scenario where our nuclear-source population is composed of low-luminosity AGN for erg s-1 and high-mass X-ray binaries for erg s-1, coincidentally with the same normalization, appears highly contrived.
Thirdly, the majority of the nuclear sources (57 out of 86) are detected in the earlier-type galaxies of our sample (E to Sb), that is in galaxies where the nuclear region is part of a massive, old spheroidal component (Section 3.1). If the contamination from high-mass X-ray binaries were significant, we would expect to find more sources in late-type spirals. Ellipticals and massive spheroidals do have a high stellar density in their cores, with old populations, so they may have low-mass X-ray binaries near the nuclear position. But a significant contribution of low-mass X-ray binaries to our source population above erg s-1 is also ruled out, because their cumulative luminosity distribution would be much steeper [36, 115]. In addition, we used the following argument to estimate the possible contribution of low-mass X-ray binaries in the nuclear region of ellipticals and spheroidal bulges. From surface brightness profiles [34, 73], we can estimate the total luminosity and hence the total stellar mass of characteristic galaxy types within, say, (– pc for our distance range), that is, the radius of our source extraction region around each nuclear position. This is of course a function of Hubble type and galaxy history, among other things, but is an order-of-magnitude estimate for massive ellipticals, and a conservative upper limit for spheroidal bulges. From the population studies of Gilfanov [36], we expect sources with X-ray luminosities erg s-1, from an old stellar population with a stellar mass . A similar estimate can be obtained directly from the growth curves plotted in Fig. 3 of Gilfanov [36] for a sample of nearby elliptical galaxies and spheroidal bulges: those plots also suggest the presence of sources above erg s-1 within , scaled to the range of distances of our sample. Since our main statistical results are based on sources above a completeness limit erg s-1, the contamination of at most 2 or 3 X-ray binaries in our whole sample of early-type galaxies is not a significant problem.
Taken together, the previous arguments strongly support our identification of the X-ray source population as active nuclear BHs—without ruling out the possibility of stellar-mass interlopers in some limited cases, such as M 33, where stellar kinematics suggest a BH mass [33]. The distribution of X-ray photon indices – is also in the typical range for AGN, and rules out, for example, thermal emission from compact starburst nuclei.


Another possibility we may consider is that each of our nuclear sources could instead be the integrated emission from many, fainter sources in a very compact star-forming nucleus. After all, many of our sample galaxies are classified as HII nuclei. This scenario is already implausible given the predominant detection of X-ray cores in earlier-type galaxies, as noted earlier. But we can test this possibility more quantitatively by comparing the nuclear X-ray and H luminosities. Fifty-three of the 86 galaxies with an X-ray core in our sample are also included in the optical spectroscopic Palomar survey of Ho et al. [55], which provides nuclear H fluxes. Both the H and the – keV luminosities of a star-forming region are proportional to the current or recent star formation rate (assuming that it has stayed approximately constant over the last Myr): SFR( yr-1) erg s-1 [69], and SFR( yr-1) erg s-1 [46]. Thus, we expect for a starburst-dominated compact nucleus. Instead, we expect – for typical low-luminosity AGN [54, 27]. The results for our sample (Figure 5) are more consistent with the AGN scenario.
III.4 Intrinsic absorption and luminosity
From our spectral fitting of individual sources, we found that the intrinsic column density appears to be correlated with the unabsorbed X-ray luminosity (Figure 6, left panel): more luminous sources tend to be more obscured, while most of the fainter sources are consistent with column densities cm-2, or with only line-of-sight Galactic absorption. There is also a dependence on the viewing angle of the host galaxy (Figure 6, right panel), as expected, but it is less strong than the luminosity dependence. In terms of the unified AGN classification scheme, we found few or no “Type-2” nuclear BHs below an X-ray luminosity erg s-1. Only per cent of the nuclear sources with a few erg s-1 are obscured by a neutral column density cm-2. But obscured sources represent two thirds (10 out of 15) of those with erg s-1. This apparent trend of higher absorption at higher luminosities is opposite to what seems to happens in more luminous AGN, with unabsorbed X-ray luminosities – erg s-1 [50, 37, 125]; see also Hopkins et al. [60] for an alternative explanation of the luminosity dependence.


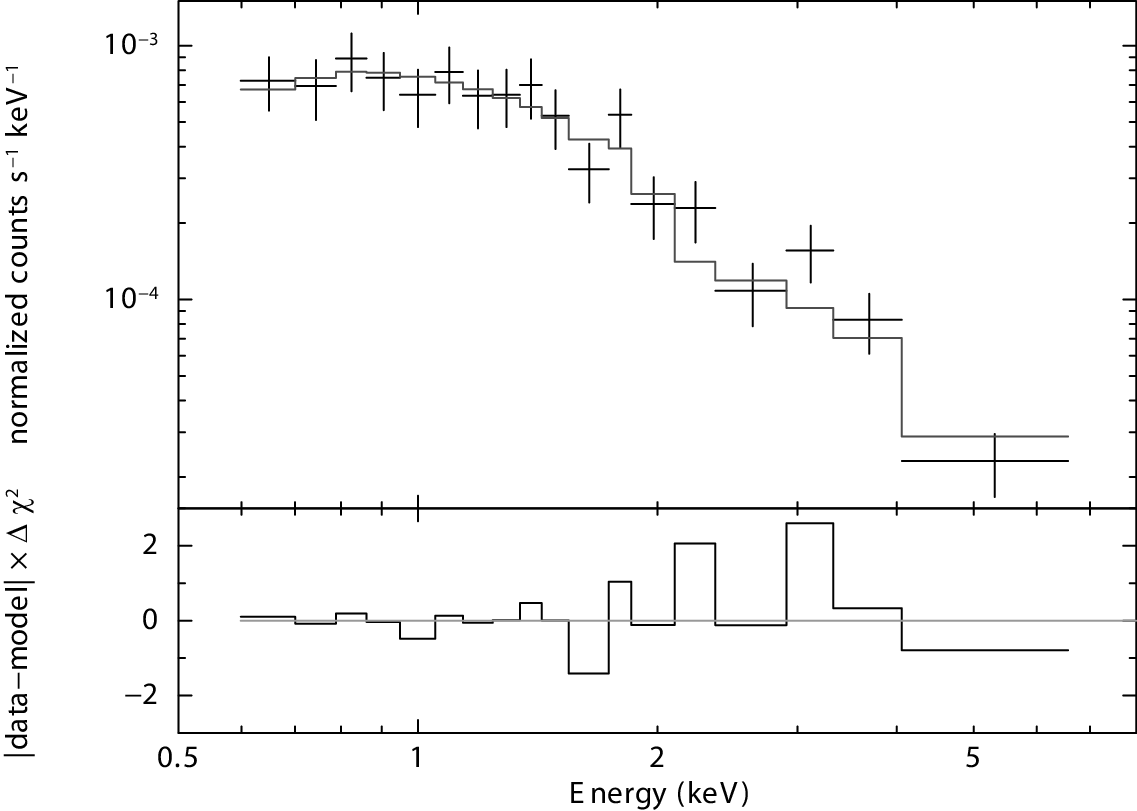
Before attempting a physical explanation for the observed trend, we need to check that it is not the result of observational bias. We have already excluded from the absorption–luminosity plot (Figure 6) all sources detected with counts. One possibility might be that we lose all sources with cm-2 and erg s-1 because they would not have enough counts to be detected. However, using simulated X-ray data and spectral models, we verified that this is not the case: even for cm-2, most sources with a typical photon index and erg s-1 would have enough counts in the – keV band to be detected. An alternative possibility is that most of the fitted values of in faint sources have been underestimated (correspondingly, their photon indices and intrinsic luminosities would also have been underestimated). To test this scenario, we stacked the spectra of all sources with counts; this is roughly equivalent to stacking all spectra of nuclear sources with erg s-1 (most of the galaxies in our sample are at distances – Mpc). We then fitted the co-added spectrum with an absorbed power-law model; we obtain (Figure 7) that the best-fitting , and cm-2, which is only slightly higher than the average Galactic absorption for the sources in the stacked sample. We conclude that the co-added spectrum confirms a very low intrinsic absorption for the least luminous nuclear BHs.
Furthermore, we conducted a MonteCarlo simulation to test whether the apparent absorption–luminosity correlation could have been spuriously introduced during spectral fitting (for example, due to an overestimate of the intrinsic luminosity for sources with higher ). We assumed that the unabsorbed flux for a simulated sample of 100 sources has a uniform distribution (in log scale) from to erg cm-2 s-1 in the – keV band (similar to the range of fluxes typical of our real sample of nuclear sources), and their intrinsic has a uniform distribution (also in log scale) from to cm-2 (Figure 8). In other words, we assumed no intrinsic correlation between luminosity and . We also assumed an absorbed power-law spectrum with for every source. We then fitted the simulated spectra (using the Cash statistics) with absorbed power-law models, leaving and as free parameters, and we estimated the unabsorbed fluxes implied by the best-fitting model for each source. The fitted parameters do not show any correlation between unabsorbed fluxes and , or any significant bias in the inferred fluxes (Figure 8).

We conclude that the absence of Type-2 low-luminosity nuclei, and the positive correlation between intrinsic absorption and luminosity up to erg s-1 are probably real. This is opposite to the negative correlation between absorption and luminosity known to exist at higher luminosities [50, 37, 125]. We also searched for a possible galaxy-morphology dependence of the intrinsic column density; for example, whether late-type spirals have systematically higher absorption than ellipticals. We find that all Hubble types appear dominated by unobscured sources, although the small number of sources in each class does not permit us to draw stronger conclusions (Figure 9). The nuclei of early-type spirals in our X-ray detected sample seem to be the most obscured: 15 of the 42 nuclear sources detected in early-type spirals have cm-2; only 3 of the 20 nuclear sources in late-type spirals, and none of the 6 elliptical nuclei have cm-2. However, this may still be due to small-number statistics in each class. A larger X-ray sample of galaxies will be needed, to study the Hubble-type dependence for a given range of luminosities and BH masses.


III.5 Eddington ratios
Among the 86 galaxies with an X-ray core in our extended sample, 31 already have a measurememnt of their nuclear BH mass in the literature, based on stellar kinematics, gas kinematics, water masers, or reverberation mapping (see detailed references in Table 4). For another 31 galaxies, stellar velocity dispersions of their cores are available from Hyperleda55 5 http://leda.univ-lyon1.fr, with typical uncertainties –%; in those cases, we used the – relation [122] to estimate their BH masses. For 3 other cases, only photometric observations are available: we constrained their BH masses via the –Srsic index relation [39]. Thus, we have 65 nuclear BHs in our sample with a mass estimate, out of 86 candidate X-ray cores (Table 4).


The elliptical galaxies in our sample have larger inferred BH masses () and low X-ray luminosities ( erg s-1), as expected. Late-type spirals also have low X-ray luminosities ( erg s-1) but the lowest BH masses (–). The most luminous nuclear BHs in the local universe (– erg s-1) are found in early-type spirals (Figure 10, top panel). X-ray nuclei of barred galaxies are less luminous than those of non-barred galaxies, for a given range of BH masses (Figure 10, middle panel). This is partly due to the higher fraction of strongly-barred galaxies in late-type spirals, which tend to have weaker nuclear emission. Optically-classified Seyferts have the most luminous X-ray nuclei, as expected (Figure 10, bottom panel). There is only a very weak positive correlation (slope and correlation coefficient ) between BH mass and X-ray luminosity. If the X-ray luminosity scaled with the Bondi accretion rate [61] onto the nuclear BH, we would expect , where and are the gas density and sound speed outside the accretion radius. The higher gas density in the nuclear region of spiral galaxies compensates for their lower BH masses. In contrast, the lower abundance of gas available for accretion in elliptical galaxies is offset by higher BH masses. Because the luminosity is almost independent of BH mass, there is a negative correlation (slope and correlation coefficient ) between BH masses and X-ray Eddington ratios (Figure 11). In local-universe ellipticals, –; in late-type spirals, –. The only outlier is the late-type, barred (SBcd) Seyfert-2 galaxy NGC 4945, perhaps the only “true” AGN in our sample ( erg s-1 ). This is also the galaxy with the highest intrinsic absoprtion ( cm-2); see Done et al. [13], Itoh et al. [65] for detailed X-ray studies of this AGN.
Estimating the mass accretion rate from the observed luminosities requires the assumption of a model for the radiative and total efficiency. In our local-universe sample, even the most luminous nuclei (except for NGC 4945) are likely to be in the low-radiative-efficiency regime, which is thought to set in for , by analogy with stellar-mass BHs [21, 67]. We adopted the ADAF scenario, which includes contributions to the emitted flux from disk-blackbody (truncated outer disk), synchrotron, bremsstrahlung and inverse-Compton [87, 88]. ADAF spectral models scale with the BH mass and the dimensionless accretion parameter , where is the radiative efficiency ( for efficient accretion)66 6 With this definition, the transition between ADAF and standard-disk accretion occurs at , and for . The accretion parameter is sometimes alternatively defined in the literature as , so that for .. Other physical information is included in three (dimensionless) parameters: the ratio of gas to magnetic pressure; the viscosity parameter; and the fraction of viscous heating that goes into the electrons. A useful table of band-limited X-ray luminosities for a grid of ADAF spectral models, as a function of BH mass and accretion parameter (with standard assumptions for the other three parameters), was calculated by Merloni et al. [79]. We used their grid values and interpolations to estimate of our sample nuclei, from their observed X-ray luminosities and indirectly-inferred BH masses. We obtain a range of accretion parameters –, and we have plotted them as a function of BH mass, Hubble type and optical spectroscopic classification (Figure 12).


IV DISCUSSION AND CONCLUSIONS
We studied the X-ray nuclear activity of nearby galaxies (distance Mpc), in a range of luminosities intermediate between low-luminosity AGN and “normal” non-active galaxies. More specifically, we chose a complete sample of optically/IR-selected Northern galaxies, as defined in Swartz et al. [116]; most of the galaxies in this sample were observed by Chandra/ACIS for a ULX survey. We then extended that sample with another galaxies (also at distances Mpc) with publicly-available Chandra/ACIS data; the extended sample contains 187 galaxies. The main results presented in this paper are:
1. We made a census of weakly active nuclei in the local neighbourhood, down to a completeness limit erg s-1 in the – keV band. Eighty-six out of 187 galaxies have a point-like nuclear X-ray source, coincident (within ) with the radio or infrared nuclear position. The presence of an X-ray core depends strongly on Hubble type: per cent of early-type galaxies (E to Sb) contain an X-ray core, but only per cent of later-type galaxies. About 90 per cent of optically-classified Seyfert and LINERs have a nuclear X-ray source with erg s-1; this fraction drops to per cent for transition objects, and per cent for HII nuclei. The AGN demographics from our Chandra survey is consistent with the AGN demographics inferred from optical spectroscopic studies, for example the Palomar survey [54, and references therein]. Our Chandra survey suggests that point-like nuclear X-ray emission is a reliable indicator of BH activity in normal galaxies, especially in cases where optical signatures of BH accretion may be swamped by the surrounding stellar emission.
2. Spiral and elliptical galaxies within 15 Mpc are detected with a continuous range of nuclear luminosities from erg s-1 to erg s-1. There is no gap between low-luminosity AGN and BH activity in normal galaxies. The cumulative luminosity distribution can be fitted by a power-law with a slope of . Because of the relatively small number of galaxies in our sample, we cannot yet accurately determine whether the luminosity distribution of those faint nuclei matches the slope and normalization of the luminosity distribution of fully-fledged AGN ( erg s-1). However, we are currently studying a larger Chandra sample of galaxies (within 40 Mpc) and we will address this issue in a follow-up paper.
3. For each individual X-ray core with luminosities – erg s-1, it is always very difficult to distinguish between a nuclear BH and an unrelated, luminous X-ray binary in the nuclear region. However, on a statistical basis, we have discussed various reasons why we think that the majority of detected sources are nuclear BHs rather than X-ray binaries (Section 3.1). Most of the X-ray sources are exactly coincident with the nuclear position, and there are much fewer sources in the annulus between and from the radio/optical nucleus. Besides, the luminosity distribution has no hint of a break at erg s-1, as we would expect from a population of high-mass X-ray binaries. The ratio between nuclear H luminosity (when available, from the Palomar survey) and X-ray luminosity is more typical of low-luminosity AGN than of star-forming regions with young X-ray binaries.
4. We fitted the spectra of each source, assuming absorbed power-law models with two free parameters: the photon index and the intrinsic absorption. The photon index is consistent with the expected value for AGN (–). The intrinsic column density is positively correlated with the emitted X-ray luminosity: among the population of fainter nuclear BHs, very few or none can be classified as Type-2 (highly obscured). This is the opposite of the trend known for luminous AGN, with erg s-1 [50, 37, 125]. It is still not clear what produces the absorption (a geometrically-thick parsec-scale torus? An optically-thick disk wind?), and hence we cannot determine from the data available what causes the fraction of obscured sources to be highest for sources with – erg s-1, and to decrease at both lower and higher nuclear BH luminosities. At high luminosities, it was suggested that the thick torus gets progressively evaporated or ablated by the radiation flux from the central object [50, 78]. On the other hand, X-ray faint nuclei have less gas available for accretion. They may not be surrounded by a torus at all; or the torus may collapse and become geometrically thin, so that only galaxies seen perfectly edge-on would be classified as Type-2; or, instead, the dramatic decrease in absorption may be caused by the suppression of the optically-thick disk wind. Alternatively, it was suggested [60] that a large fraction of sources with – erg s-1 have been erroneously classified as obscured, because of optical dilution effects, and because of the transition from a standard-disk accretion geometry to a radiatively-inefficient flow. Both effects would make those sources less prominent or invisible in the UV/optical band, and slightly harder in the X-ray band, thus making them appear “obscured” even though they are not. Based on those arguments, it was proposed that the fraction of truly obscured sources can be as low as 20 per cent, independent of luminosity [60]. However, an opposite result was obtained by Reyes et al. [101], based on an optically-selected sample of quasars from the Sloan Digital Sky Survey; they find that at least half of the quasars in the nearby Universe () are truly obscured, particularly in the high-luminosity population. In our sample of sources, the absorbing column densities are estimated directly from the fitted X-ray spectra, and do not rely on hardness ratios or optical/X-ray flux ratios, thus reducing the bias discussed by Hopkins et al. [60]. Thus, we suggest that the high fraction (10 out of 15) of obscured sources at X-ray luminosities erg s-1 (– keV band) may be really due to a higher density of absorbing gas or dust around the nuclear BH (whatever its geometry) in that moderate luminosity range. The fraction of obscured nuclei seems to depend more directly on luminosity rather than Hubble type. In our sample, slightly more nuclei detected in early-type spirals seem to be obscured ( cm-2), compared with the obscured fractions in ellipticals and late-type spirals; however, we do not have enough galaxies to draw strong conclusions. We are planning further work with a larger sample of galaxies to address this issue.
5. Having argued that the apparent luminosity dependence of the obscured fraction of nuclei is truly due to changes in the column density of the absorbing medium, we can still look for a causal link between such changes and the disappearance of the standard disk at low accretion rates (or other transitions in the geometry of the accretion flow). For example, the disk may disappear when it is no longer fed by a large torus; or, vice versa, optically-thick winds may be suppressed when the standard disk turns into an optically-thin ADAF. It was already noted [54] that the decrease or suppression of the intrinsic absorption at low luminosities often coincides with the disappearance of optical signatures of a standard accretion disk. If the apparent or real changes in the obscuration fraction are due to a sharp standard-disk/ADAF transition at , we should not expect a trend in our sample, because all but one of our sources are almost certainly below this threshold, in the radiatively-inefficient regime. Instead, we see changes in the fraction of obscured sources over the X-ray luminosity range – erg s-1 and –. This suggests a more gradual evolution in the amount of absorbing material below the radiatively-inefficient threshold; or perhaps a more gradual disappearance of the outer accretion disk at low accretion rates. It was also recently suggested [133, 127] that a dusty torus (produced during major galaxy mergers, or via secular evolution processes) can provide the main source of fuel in a self-regulated way: when it is completely evaporated by the radiation from the central source, the AGN phase turns off and the supermassive BH becomes inactive; this scenario is among those consistent with our observational findings.
6. We confirm that there is no positive correlation between the presence of a bar and the X-ray luminosity of the nucleus. Large-scale bars are highly effective in delivering gas to the central few hundred parsecs of a spiral galaxy and therefore enhance the probability and rate of star formation in the nuclear region [52]. However, it was observed from optical/IR surveys [58, 62, 74] that the presence of a bar seems to have no impact on either the frequency or strength of AGN activity—with the possible exception of Narrow-Line Seyfert 1 galaxies, which may be preferentially associated with barred spirals [91]. In fact, our results suggest a negative correlation, with strongly barred galaxies having a less active nuclear BH than non-barred/weakly barred galaxies, for a given range of BH masses and Hubble types (we do not have Narrow-Line Seyfert 1s in our sample). This preliminary but intriguing result will have to be tested more strongly on our larger Chandra sample we are currently studying. If confirmed, it may suggest that there is less gas reaching the supermassive BH when there is circumnuclear star formation (i.e., in most strongly-barred galaxies). In this scenario, galaxies may cycle through phases of dominant nuclear star formation (when a bar is present) and phases dominated by nuclear BH accretion. One possible explanation could be that nuclear star formation in spiral galaxies actively disfavours gas inflows towards the nuclear BH—most of the gas not used for star formation may be blown away by supernova-powered outflows. In addition, there may be a mismatch between the characteristic timescales of bar formation and disruption ( a few yrs: Combes & Elmegreen [8]), and the longer timescales of nuclear BH accretion. In this scenario [62], bars and associated nuclear star formation would appear first, and nuclear activity later, after the bar-driven star formation has subsided.
7. There is an anticorrelation between the BH mass and the Eddington ratio: elliptical galaxies in the local universe have higher BH masses but much lower accretion parameters, corresponding to X-ray luminosities . When late-type spirals have an X-ray nuclear source, their luminosities are , because they have a larger supply of gas. In any case, all classes of nuclear sources in our sample are expected to be in the radiatively-inefficient regime, dominated either by energy advection (e.g., ADAF) or by non-radiative output channels (jets). We are planning further work to determine the radio core luminosity of the nuclear X-ray sources detected in our sample.
References
- [1] Antonucci, R. 1993, ARA&A, 31, 473
- [2] Arnaud, K. A. 1996, Astronomical Data Analysis Software and Systems V, ASP Conference Series, Vol. 101, G. H. Jacoby and J. Barnes, eds., p. 17
- [3] Barth, A. J., Greene, J. E., & Ho, L. C. 2005, ApJ, 619, L151
- [4] Bower, G. A., Wilson, A. S., Heckman, T. M., Magorrian, J., Gebhardt, K., Richstone, D. O., Peterson, B. M., & Green, R. F. 2000, BAAS, 32, 1566
- [5] Bower, G. A., et al. 2001, ApJ, 550, 75
- [6] Cappi, M., et al. 2006, A&A, 446, 459
- [7] Cash, W. 1979, ApJ, 228, 939
- [8] Combes, F., & Elmegreen, B. G. 1993, A&A, 271, 391
- [9] Cretton, N., & van den Bosch, F. C. 1999, ApJ, 514, 704
- [10] de Vaucouleurs, G., de Vaucouleurs, A., Corwin, H. G., Buta, R. J., Paturel, G., & Fouque, P. 1991, Third Reference Catalogue of Bright Galaxies (Springer-Verlag: New York)
- [11] Desroches, L.-B., & Ho, L. C. 2009, ApJ, 690, 267
- [12] Dickey, J. M., & Lockman, F. J. 1990, ARA&A, 28, 215 Nakanishi, K., & Inous, M. 2005, MNRAS, 363, 692
- [13] Done, C., Madejski, G. M., Zycki, P. T., & Greenhill, L. J. 2003, ApJ, 588, 763
- [14] Dong, X. B., et al. 2007. ApJ, 657, 700
- [15] Dong, X. Y., & De Robertis, M. M. 2006, ApJ, 131, 1236
- [16] Dubus, G., Charles, P. A., & Long, K. S. 2004, A&A, 425, 95
- [17] Dudik, R. P., Satyapal, S., Gliozzi, M., & Sambruna, R. M. 2005, ApJ, 620, 113
- [18] Elvis, M. 2000, ApJ, 545, 63
- [19] Elvis, M., Risaliti, G., Nicastro, F., Miller, J. M., Fiore, F., & Puccetti, S. 2004, ApJ, 615, L25
- [20] Emsellem, E., Dejonghe, H., & Bacon, R. 1999 MNRAS, 303, 495
- [21] Esin, A. A., McClintock, J. E., & Narayan, R. 1997, ApJ, 489, 865
- [22] Evans, D. A., Kraft, R. P., Worrall, D. M., Hardcastle, M. J., Jones, C., Forman, W. R., & Murray, S. S. 2004, ApJ, 612, 786
- [23] Fender, R. P., Belloni, T. M., & Gallo, E. 2004, MNRAS, 355, 1105
- [24] Ferrarese, L., et al. 2006, ApJ, 644, L21
- [25] Filho, M. E., Barthel, P. D., & Ho, L. C. 2006, A&A, 451, 71
- [26] Filippenko, A. V., & Ho, L. C. 2003, ApJ, 588, L13
- [27] Flohic, H. M. L. G., Eracleous, M., Chartas, G., Shields, J. C., & Moran, E. C. 2006, ApJ, 647, 140
- [28] Freedman, W., et al. 2001, ApJ, 553, 47
- [29] Fukazawa, Y., Iyomoto, N., Kubota, A., Matsumoto, Y., & Makishima, K. 2001, A&A, 374, 73
- [30] Fullmer, L. & Londsdale, C. J. 1989, Cataloged galaxies and quasars observed in the IRAS survey (Pasadena: Jet Propulsion Laboratory).
- [31] Garcia, M. R., Williams, B. F., Yuan, F., Kong, A. K. H., Primini, F. A., Barmby, P., Kaaret, P., & Murray, S. S. 2005, ApJ, 632, 1042
- [32] Gebhardt, K., et al. 2000b, AJ, 119, 1157
- [33] Gebhardt, K., et al. 2001, AJ, 122, 2469
- [34] Gebhardt, K., et al. 2003, ApJ, 583, 92
- [35] Ghosh, H., Mathur, S., Fiore, F., & Ferrarese, L. 2008, ApJ, 687, 216
- [36] Gilfanov, M. 2004, MNRAS, 349, 146
- [37] Gilli, R., Comastri, A., & Hasinger, G. 2007, A&A, 463, 79
- [38] González-Martín, O., Masegosa, J., Marquez, I., Guerrero, M. A., & Dultzin-Hacyan, D. 2006, A&A, 460, 45
- [39] Graham, A. W., & Driver, S. P. 2007, ApJ, 655, 77
- [40] Greene, J. E., & Ho, L. C. 2004, ApJ, 610, 722
- [41] Greene, J. E., & Ho, L. C. 2007, ApJ, 670, 92
- [42] Greene, J. E., Ho, L. C., & Barth, A. J. 2008, ApJ, 688, 159
- [43] Greenhill, L. J., & Gwinn, C. R. 1997, Ap&SS, 248, 261
- [44] Greenhill, L. J., Moran, J. M., & Herrnstein, J. R. 1997, ApJ, 481, L23
- [45] Greenhill, L., et al. 2003, ApJ, 590, 162
- [46] Grimm, H. J., Gilfanov, M., & Sunyaev, R. 2003, MNRAS, 339, 793
- [47] Gultekin, K., et al. 2009, ApJ, in press (arXiv:0901.4162)
- [48] Hao, L., et al. 2005, 129, 1783
- [49] Hao, L., et al. 2005, 129, 1795
- [50] Hasinger, G. 2008, A&A, 490, 905
- [51] Heckman, T. M. 1980, A&A, 87, 142
- [52] Heller, C. H., & Shlosman, I. 1994, ApJ, 424, 84
- [53] Herrnstein, J. R., et al. 1999, Nature, 400, 539
- [54] Ho, Luis C. 2008, ARA&A, 46, 475
- [55] Ho, Luis C., Filippenko, A. V., & Sargent, W. L. W. 1997a, ApJS, 112, 315
- [56] Ho, Luis C., Filippenko, A. V., & Sargent, W. L. W. 1997b, ApJ, 487, 568
- [57] Ho, Luis C., Filippenko, A. V., & Sargent, W. L. W. 1997c, ApJ, 487, 579
- [58] Ho, L. C., Filippenko, A. V., & Sargent, W. L. W. 1997d, ApJ, 487, 591
- [59] Ho, L. C., et al. 2001, ApJ, 549, L51
- [60] Hopkins, P. F., Hickox, R., Quataert, E., & Hernquist, L. 2009, MNRAS, in press (arXiv:0901.2936)
- [61] Hoyle, F., & Lyttleton, R. A. 1939, PCPS, 35, 405
- [62] Hunt, L. K., & Malkan, M. A. 1999, ApJ, 516, 660
- [63] Immler, S., Wang, Q. D., Leonard, D. C., & Schlegel, E. M. 2003, ApJ, 595, 727
- [64] Irwin, J. A., Sarazin, C. L., & Bergman, J. N. 2002, ApJ, 570, 152
- [65] Itoh, T., et al. 2008, PASJ, 60, 251
- [66] Jenkins, L. P., Brandt, W. N., Colbert, E. J. M., Levan, A. J., Roberts, T. P., Ward, M. J., & Zezas, A. 2008, proceedings of the ESAC workshop on X-rays from nearby galaxies, Madrid (Spain), September 2007, MPE Report 295, p. 65 (arXiv:0801.2356)
- [67] Jester, S. 2005, ApJ, 625, 667
- [68] Jiménez-Bailón, E., Santos-Lleó, M., Dahlem, M., Ehle, M., MasHesse, J. M., Guainazzi, M., Heckman, T. M., & Weaver, K. A. 2005, A&A, 442, 861
- [69] Kennicutt, R. C. 1998, ARA&A, 36, 189
- [70] Kormendy, J. 2004, in Coevolution of Black Holes and Galaxies, ed. L. C. Ho (Cambridge: Cambridge Univ. Press), 1
- [71] Kormendy, J., Bender, R., Evans, A. S., & Richstone, D. 1998, AJ, 115, 1823
- [72] Kraft, R. P., Burrows, D. N., & Nousek, J. A. 1991, ApJ, 374, 344
- [73] Lauer, T. R., et al. 1995, AJ, 110, 2622
- [74] Laurikainen, E., Salo, H., & Buta, R. 2004, ApJ, 607, 103
- [75] Lynden-Bell, D. 1969, Nature, 223, 690
- [76] Magorrian, J., et al. 1998, AJ, 115, 2285
- [77] Marconi, A., Capetti, A., Axon, D. J., Koekemoer, A., Macchetto, D., & Schreier, E. J. 2001, ApJ, 549, 915
- [78] Menci, N., Fiore, F., Puccetti, S., & Cavaliere, A. 2008, ApJ, 686, 219
- [79] Merloni, A., Heinz, S., & Di Matteo, T. 2003, MNRAS, 345, 1057
- [80] Merritt, D., & Ferrarese, L. 2001a, ASPC, 249, 335
- [81] Merritt, D., & Ferrarese, L. 2001b, MNRAS, 320, L30
- [82] Moshir, M., et al. 1993, IRAS Faint Source Catalog, on Vizier.
- [83] Murray, N., & Chiang, J. 1998, ApJ, 494, 125
- [84] Murray, N., Chiang, J., Grossman, S. A., & Voit, G. M. 1995, ApJ, 451, 498
- [85] Nagar, N. M., Falcke, H., & Wilson, A. S. 2005, ApJ, 435, 521
- [86] Narayan, R. 2002, in Lighthouses of the Universe, ed. M. Gilfanov, R. Sunyaev, & E. Churazov (New York: Springer), 405
- [87] Narayan, R., Barrett, D., & McClintock, J. E. 1997, ApJ, 482, 448
- [88] Narayan, R., Mahadevan, R., Grindlay, J. E., Popham, R. G., Gammie, C. 1998, ApJ, 492, 554
- [89] Narayan, R., & Yi, I. 1995, ApJ, 444, 231
- [90] Nilson, P. 1973, Uppsala General Catalogue of Galaxies (Uppsala: Astron. Obs.)
- [91] Ohta, K., Aoki, K., Kawaguchi, T., & Kiuchi, G. 2007, ApJS, 169, 1
- [92] Panessa, F., Bassani, L., Cappi, M., Dadina, M., Barcons, X., Carrera, F. J., Ho, L. C., & Iwasawa, K. 2006, A&A, 455, 173
- [93] Pellegrini, S. 2005, ApJ, 624, 155
- [94] Pellegrini, S., Fabbiano, G., Fiore, F., Trinchieri, G., & Antonelli, A. 2002, A&A, 383, 1
- [95] Pence, W. D., Snowden, S. L., & Mukai, K. 2001, ApJ, 561, 189
- [96] Peterson, B. M., et al. 2005, ApJ, 632, 799
- [97] Pinkney, J., et al. 2003, ApJ, 596, 903
- [98] Plucinsky, P. P, et al. 2008, ApJ, 174, 366
- [99] Posson-Brown, J., Raychaudhury, S., Forman, W., Donnelly, R. H., & Jones, C. 2009, ApJ, in press (astro-ph/0605308)
- [100] Quataert, E., & Narayan, R. 1999, ApJ, 520, 298
- [101] Reyes, R., et al. 2008, AJ, 136, 2373
- [102] Rice, W., Lonsdale, C. J., Soifer, B. T., Neugebauer, G., Kopan, E. L., Lloyd, L. A., de Jong, T., & Habing, H. J. 1988, ApJS, 68, 91
- [103] Sakamoto, K., Okumura, S. K., Ishizuki, S., & Scoville, N. Z. 1999, ApJ, 525, 691
- [104] Salpeter, E. E. 1964, ApJ, 140, 796
- [105] Sarzi, M., Rox. H. W., Shields, J. C., Rudnick, G., Ho, L. C., McIntosh, D. H., Filippenko, A. V., & Sargent, W. L. W. 2001, ApJ, 550, 65
- [106] Satyapal, S., Dudik, R. P., OHalloran, B., & Gliozzi, M. 2005, ApJ, 633, 86
- [107] Satyapal, S., Sambruna, R. M., & Dudik, R. P. 2004, A&A, 414, 825
- [108] Satyapal, S., Vega, D., Dudik, R. P., Abel, N. P., & Heckman, T. 2008, ApJ, 677, 926
- [109] Seth, A., Agüeros, M., Lee, D., & Basu-Zych, A. 2008, ApJ, 678, 116
- [110] Skrutskie, M. F., et al. 2006, AJ, 131, 1163.
- [111] Smith, D. A., & Wilson, A. S. 2001, ApJ, 557, 180
- [112] Soria, R., & Wu, K. 2002, A&A, 384, 99
- [113] Summers, L. K., Stevens, I. R., Strickland, D. K., & Heckman, T. M. 2004, MNRAS, 351, 1
- [114] Swartz, D. A., Ghosh, K. K., McCollough, M. L., Pannuti, T. G., Tennant, A. F., & Wu, K. 2003, ApJ, 144, 213
- [115] Swartz, D. A., Ghosh, K. K., Tennant, A. F., & Wu, K. 2004, ApJS, 154, 519
- [116] Swartz, D. A., Soria, R., & Tennant, A. F. 2008, ApJ, 684, 282
- [117] Terashima, Y., Iyomoto, N., Ho, L. C., & Ptak, A. F. 2002, ApJS, 139, 1
- [118] Terashima, Y., & Wilson, A. S. 2001, ApJ, 560, 139
- [119] Terashima, Y., & Wilson, A. S. 2004, ApJ, 601, 735
- [120] Thatte, N., Tecza, M., & Genzel, R. 2000, A&A, 364, L47
- [121] Tonry, J. L., Dressler, A., Blakeslee, J. P., Ajhar, E. A., Fletcher, A. B., Luppino, G. A., Metzger, M. R., & Moore, C. B. 2001, ApJ, 546, 681
- [122] Tremaine. S., et al. 2002, ApJ, 574, 740
- [123] Tully, R. B. 1988, Nearby Galaxies Catalogue (Cambridge: Cambridge Univ.Press)
- [124] Tully, R. B., Shaya, E. J. & Pierce, M. J. 1992, ApJS, 80, 479
- [125] Ueda, Y., Akiyama, M., Ohta, K., & Miyaji, T. 2003, ApJ, 598, 886
- [126] Wang, L., & Kauffmann, G. 2008, MNRAS, 391, 785
- [127] Wang, J.-M., & Zhang, E.-P. 2007, ApJ, 660, 1072
- [128] Weaver, K. A., Heckman, T. M., Strickland, D. K., & Dahlem, M. 2002, ApJ, 576, L19
- [129] Wrobel, J. M., & Heeschen D. S. 1991, AJ, 101, 148
- [130] Wrobel, J. M., Terashima, Y., & Ho, L. C. 2008, ApJ, 675, 1041
- [131] Young, A. J., Wilson, A. S., & Shopbell, P. L. 2001, ApJ, 556, 6
- [132] Yuan, F., & Narayan, R. 2004, ApJ, 612, 724
- [133] Zhu, L., Zhang, S. N., & Tang, S. M. 2008, arXiv:0807.3992
| Galaxy | DistanceaaReferences for the distances are given in brackets, as follows: KP = Key Project [28]; SBF = surface brightness fluctuations [121]; T92 = nearby galaxy flow model [124]; T88 = Nearby Galaxy Catalog [123]; NED = distances computed from recessional velocities relative to the cosmic microwave background. | Morphol. | ClassbbOptical classification of the nuclear spectrum, from Ho et al. [55] and NED: H = HII nucleus; S = Seyfert; L = LINER; T = transition object. The number attached to the class letter designates the type (1.0, 1.2, 1.5, 1.8, 1.9, and 2); quality ratings are given by ”:” and ”::” for uncertain and highly uncertain classifications, respectively. | X-Ray CoreccX-ray classification of the nuclear region, from our study: I = dominant point-like X-ray nucleus; II = point-like nuclear source embedded in diffuse emission; III = diffuse X-ray emission in the nuclear region without a point-like core; IV = no detectable X-ray emission at the nuclear position. See examples in Figure 1. | Exp. TimeddChandra/ACIS exposure time for the datasets used in our analysis. | CountseeChandra/ACIS X-ray counts or upper limits for a point-like nuclear X-ray source; upper limits are at the % confidence level, estimated using a Bayesian method [72]. | Galactic ffLine-of-sight column density, from Dickey & Lockman [12]. | SampleggS denotes galaxies included in the optically/IR-selected sample (see Section 2). |
|---|---|---|---|---|---|---|---|---|
| (Mpc) | Type | (ks) | (cm-2) | |||||
| IC10 | 0.7[T88] | IBm | H | IV | 117.1 | 5.3E+21 | S | |
| IC239 | 14.2[T88] | SAB(rs)cd | L2:: | IV | 4.5 | 5.3E+20 | S | |
| IC342 | 3.9[T88] | SAB(rs)cd | H | I | 57.8 | 585 | 3.0E+21 | S |
| IC396 | 14.4[T88] | S | I | 4.9 | 24 | 1.1E+21 | S | |
| IC1473 | 11.5[T88] | S0 | IV | 3.3 | 6.0E+20 | S | ||
| IC1613 | 0.7[T88] | IB(s)m | IV | 49.9 | 3.0E+20 | S | ||
| IC1727 | 6.4[T88] | SB(s)m | T2/L2 | IV | 3.9 | 7.2E+20 | ||
| IC5332 | 8.4[T88] | SA(s)d | IV | 107.9 | 1.4E+20 | |||
| IC2574 | 2.7[T88] | SAB(s)m | H | IV | 10.1 | 2.4E+20 | S | |
| IC3521 | 8.2[T88] | SBm | IV | 1.9 | 1.5E+20 | S | ||
| IC3647 | 8.5[NED] | Im | IV | 5.1 | 2.0E+20 | |||
| IC3773 | 14.5[NED] | E | IV | 5.3 | 1.7E+20 | |||
| NGC14 | 12.8[T88] | IB(s)m | IV | 4.0 | 4.1E+20 | S | ||
| NGC45 | 8.1[T92] | SA(s)dm | I | 65.9 | 17 | 2.2E+20 | ||
| NGC55 | 1.5[MM] | SB(s)m | IV | 69.8 | 1.7E+20 | |||
| NGC205 (M110) | 0.7[T88] | E5 | IV | 10.0 | 9.0E+20 | S | ||
| NGC253 | 3.0[T92] | SAB(s)c | T | II | 14.1 | 580 | 1.4E+20 | |
| NGC278 | 11.8[T88] | SAB(rs)b | H | III | 76.4 | 1.3E+21 | S | |
| NGC404 | 2.4[T88] | SA(s)0- | L2 | I | 25.9 | 160 | 5.3E+20 | S |
| NGC598 (M33) | 0.7[T88] | SA(s)cd | H | II | 93.9 | 140000 | 5.6E+20 | S |
| NGC625 | 3.9[T88] | SB(s)m | H | IV | 61.1 | 2.2E+20 | ||
| NGC628 (M74) | 9.7[T88] | SA(s)c | I | 46.4 | 97 | 4.8E+20 | S | |
| NGC660 | 12.8[T88] | SB(s)a | T2/H: | III | 5.0 | 4.9E+20 | S | |
| NGC672 | 7.5[T88] | SB(s)cd | H | IV | 2.1 | 7.2E+20 | S | |
| NGC855 | 8.2[T88] | E | IV | 1.7 | 6.4E+20 | S | ||
| NGC891 | 9.6[T88] | SA(s)b | H | I | 50.8 | 7 | 7.6E+20 | S |
| NGC925 | 9.4[T88] | SAB(s)d | H | I | 2.2 | 13 | 6.3E+20 | S |
| NGC949 | 10.3[T88] | SA(rs)b | IV | 2.7 | 5.1E+20 | S | ||
| NGC959 | 10.1[T88] | Sdm | H | IV | 2.2 | 5.7E+20 | S | |
| NGC1003 | 10.7[T88] | SA(s)cd | IV | 2.7 | 7.9E+20 | S | ||
| NGC1012 | 14.4[T88] | S0/a | I | 5.1 | 24 | 9.0E+20 | S | |
| NGC1023 | 11.4[SBF] | SB(rs)0- | I | 10.3 | 63 | 7.2E+20 | ||
| NGC1023A | 9.9[NED] | IB | IV | 10.3 | 7.2E+20 | |||
| NGC1023D | 9.3[NED] | dwarf | IV | 10.3 | 7.0E+20 | |||
| NGC1036 | 11.2[T88] | peculiar | IV | 3.1 | 8.7E+20 | S | ||
| NGC1055 | 12.6[T88] | SBb | T2/L2:: | IV | 5.0 | 3.4E+20 | S | |
| NGC1058 | 9.1[T88] | SA(rs)c | S2 | I | 2.4 | 3 | 6.7E+20 | S |
| NGC1068 (M77) | 14.4[T88] | SA(rs)b | S1.8 | II | 12.8 | 25000 | 3.5E+20 | S |
| NGC1156 | 6.4[T88] | IB(s)m | H | IV | 1.9 | 1.1E+21 | S | |
| NGC1291 | 8.6[T88] | SB(s)0/a | II | 60.4 | 1228 | 2.1E+20 | ||
| NGC1313 | 3.7[T88] | SB(s)d | H | IV | 49.9 | 3.9E+20 | ||
| NGC1396 | 10.8[NED] | SAB0- | IV | 3.6 | 1.4E+20 | |||
| NGC1493 | 11.3[T88] | SB(r)cd | I | 10.1 | 47 | 1.4E+20 | ||
| NGC1507 | 10.6[T88] | SB(s)m | IV | 2.8 | 1.0E+21 | S | ||
| NGC1569 | 1.6[T88] | IBm | H | III | 96.8 | 2.2E+21 | S | |
| NGC1637 | 8.9[T88] | SAB(rs)c | I | 168.1 | 450 | 4.4E+20 | ||
| NGC1672 | 14.5[T88] | SB(s)b | S2 | II | 40.1 | 30 | 2.3E+20 | |
| NGC1705 | 6.0[T88] | SA0- | H | IV | 57.6 | 4.2E+20 | ||
| NGC1800 | 7.4[T88] | IB(s)m | H | IV | 46.7 | 1.6E+20 | ||
| NGC1808 | 10.8[T88] | SAB(s)a | S2 | II | 43.4 | 550 | 2.7E+20 | |
| NGC2337 | 8.2[T88] | IBm | IV | 1.9 | 8.4E+20 | S | ||
| NGC2403 | 4.2[T88] | SAB(s)cd | H | IV | 36.0 | 4.1E+20 | S | |
| NGC2500 | 10.1[T88] | SB(rs)d | H | I | 2.6 | 7 | 4.7E+20 | S |
| NGC2541 | 10.6[T88] | SA(s)cd | T2/H: | IV | 1.9 | 4.6E+20 | S | |
| NGC2552 | 10.0[T88] | SA(s)m | IV | 7.9 | 4.4E+20 | |||
| NGC2681 | 13.3[T88] | SAB(rs)0/a | L1.9 | I | 80.9 | 635 | 2.5E+20 | S |
| NGC2683 | 5.7[T88] | SA(rs)b | L2/S2 | I | 1.7 | 15 | 3.0E+20 | S |
| NGC2787 | 13.0[T88] | SB(r)0+ | L1.9 | I | 30.9 | 480 | 4.3E+20 | S |
| NGC2841 | 12.0[T88] | SA(r)b | L2 | II | 28.2 | 128 | 1.5E+20 | S |
| NGC3031 (M81) | 3.6[T88] | SA(s)ab | S1.5 | II | 49.9 | 2000 | 4.2E+20 | S |
| NGC3034 (M82) | 5.2[T88] | I0 | H | III | 33.6 | 4.0E+20 | S | |
| NGC3077 | 2.1[T88] | I0 | H | I | 54.1 | 254 | 3.9E+20 | S |
| NGC3115 | 9.7[SBF] | S0- | II | 37.4 | 137 | 4.3E+20 | ||
| NGC3125 | 11.5[NED] | E | II | 57.6 | 17 | 5.7E+20 | ||
| NGC3184 | 8.7[T88] | SAB(rs)cd | H | I | 65 | 28 | 1.1E+20 | S |
| NGC3239 | 8.1[T88] | IB(s)m | IV | 1.9 | 2.7E+20 | S | ||
| NGC3274 | 5.9[T88] | SABd | IV | 1.7 | 1.9E+20 | S | ||
| NGC3344 | 6.1[T88] | SAB(r)bc | H | I | 1.7 | 7 | 2.2E+20 | S |
| NGC3351 (M95) | 8.1[T88] | SB(r)b | H | III | 40.0 | 2.9E+20 | S | |
| NGC3368 (M96) | 8.1[T88] | SAB(rs)ab | L2 | II | 1.9 | 6 | 2.8E+20 | S |
| NGC3377 | 11.2[SBF] | E5 | I | 40.1 | 110 | 2.9E+20 | ||
| NGC3379 (M105) | 10.6[SBF] | E1 | L2/T2:: | II | 341.1 | 858 | 2.8E+20 | |
| NGC3384 | 11.6[SBF] | SB(s)0- | II | 10.0 | 29 | 2.7E+20 | ||
| NGC3412 | 11.3[SBF] | SB(s)0o | I | 10.0 | 3 | 2.6E+20 | ||
| NGC3413 | 8.8[T88] | S0 | IV | 1.7 | 2.0E+20 | S | ||
| NGC3432 | 7.8[T88] | SB(s)m | H | IV | 1.9 | 1.8E+20 | S | |
| NGC3486 | 7.4[T88] | SAB(r)c | S2 | IV | 1.7 | 1.9E+20 | S | |
| NGC3489 | 12.1[SBF] | SAB(rs)0+ | T2/S2 | I | 1.7 | 11 | 1.9E+20 | |
| NGC3495 | 12.8[T88] | Sd | H: | IV | 4.1 | 4.2E+20 | S | |
| NGC3507 | 11.8[T92] | SB(s)b | L2 | I | 39.7 | 288 | 1.6E+20 | |
| NGC3521 | 7.2[T88] | SAB(rs)bc | H/L2:: | II | 10.0 | 24 | 4.1E+20 | S |
| NGC3556 (M108) | 14.1[T88] | SB(s)cd | H | II | 60.1 | 6 | 7.9E+19 | S |
| NGC3593 | 5.5[T88] | SA(s)0/a | H | I | 1.9 | 4 | 1.8E+20 | S |
| NGC3600 | 10.5[T88] | Sa | H | IV | 2.6 | 1.9E+20 | S | |
| NGC3623 (M65) | 7.3[T88] | SAB(rs)a | L2: | I | 1.7 | 8 | 2.2E+20 | S |
| NGC3627 (M66) | 6.6[T88] | SAB(s)b | T2/S2 | I | 1.7 | 9 | 2.4E+20 | S |
| NGC3628 | 7.7[T88] | Sb | T2 | III | 58.7 | 2.2E+20 | S | |
| NGC3675 | 12.8[T88] | SA(s)b | T2 | IV | 1.7 | 2.2E+20 | S | |
| NGC3985 | 8.3[T88] | SB(s)m | IV | 1.7 | 2.1E+20 | S | ||
| NGC3998 | 14.1[SBF] | SA(r)0o | L1.9 | I | 15.0 | 19000 | 1.2E+20 | |
| NGC4020 | 8.0[T88] | SBd | IV | 1.7 | 1.6E+20 | S | ||
| NGC4026 | 13.6[SBF] | S0 | I | 15.1 | 24 | 2.0E+20 | ||
| NGC4062 | 9.7[T88] | SA(s)c | H | IV | 2.2 | 1.6E+20 | S | |
| NGC4096 | 8.8[T88] | SAB(rs)c | H | IV | 1.7 | 1.7E+20 | S | |
| NGC4111 | 15.0[SBF] | SA(r)0+ | L2 | II | 15.1 | 269 | 1.4E+20 | |
| NGC4136 | 9.7[T88] | SAB(r)c | H | I | 18.5 | 18 | 1.6E+20 | S |
| NGC4138 | 13.8[SBF] | SA(r)0+ | S1.9 | I | 6.1 | 817 | 1.4E+20 | |
| NGC4150 | 9.7[T88] | SA(r)0o | T2 | IV | 1.7 | 1.6E+20 | S | |
| NGC4203 | 9.7[T88] | SAB0- | L1.9 | I | 1.7 | 310 | 1.2E+20 | S |
| NGC4204 | 7.9[T88] | SB(s)dm | IV | 2.0 | 2.4E+20 | S | ||
| NGC4207 | 8.3[T88] | Scd | IV | 1.7 | 1.8E+20 | S | ||
| NGC4214 | 3.5[T88] | IAB(s)m | H | IV | 29.0 | 1.5E+20 | S | |
| NGC4244 | 3.1[T88] | SA(s)cd | H | IV | 49.8 | 1.7E+20 | S | |
| NGC4245 | 9.7[T88] | SB(r)0/a | H | IV | 7.1 | 1.7E+20 | S | |
| NGC4258 (M106) | 9.6[T88] | SAB(s)bc | S1.9 | II | 21.2 | 3000 | 1.2E+20 | S |
| NGC4274 | 9.7[T88] | SB(r)ab | H | IV | 1.9 | 1.8E+20 | S | |
| NGC4286 | 8.6[NED] | SA(r)0/a | IV | 37.9 | 1.8E+20 | |||
| NGC4309 | 11.9[T88] | SAB(r)0+ | IV | 3.3 | 1.6E+20 | S | ||
| NGC4310 | 9.7[T88] | SAB(r)0+ | IV | 2.4 | 1.8E+20 | S | ||
| NGC4312 | 2.1[T88] | SA(rs)ab | IV | 1.9 | 2.5E+20 | S | ||
| NGC4314 | 9.7[T88] | SB(rs)a | L2 | II | 16.1 | 17 | 1.8E+20 | S |
| NGC4321 (M100) | 14.1[KP] | SAB(s)bc | T2 | II | 38.3 | 68 | 2.4E+20 | |
| NGC4341 | 12.5[NED] | SAB(s)0o | IV | 38.7 | 1.6E+20 | |||
| NGC4342 | 10.0[NED] | S0- | I | 38.7 | 171 | 1.6E+20 | ||
| NGC4343 | 13.9[T88] | SA(rs)b | I | 4.7 | 4 | 1.6E+20 | S | |
| NGC4370 | 10.7[T88] | Sa | IV | 40.9 | 1.6E+20 | S | ||
| NGC4395 | 3.6[T88] | SA(s)m | S1.8 | I | 72.9 | 8000 | 1.4E+20 | S |
| NGC4414 | 9.7[T88] | SA(rs)c | T2: | I | 1.7 | 8 | 1.4E+20 | S |
| NGC4419 | 13.5[SBF] | SB(s)a | T2 | I | 5.1 | 40 | 2.7E+20 | |
| NGC4448 | 9.7[T88] | SB(r)ab | H | IV | 2.0 | 1.8E+20 | S | |
| NGC4449 | 3.0[T88] | IBm | H | IV | 26.9 | 1.4E+20 | S | |
| NGC4471 | 10.8[NED] | E | S2:: | IV | 40.0 | 1.7E+20 | ||
| NGC4485 | 9.3[T88] | IB(s)m | H | IV | 98.7 | 1.8E+20 | ||
| NGC4490 | 7.8[T88] | SB(s)d | H | IV | 19.5 | 1.8E+20 | S | |
| NGC4491 | 6.8[T88] | SB(s)a | IV | 2.1 | 2.3E+20 | S | ||
| NGC4509 | 12.8[T88] | Sab | H | IV | 3.9 | 1.5E+20 | S | |
| NGC4527 | 13.5[T88] | SAB(s)bc | T2 | II | 4.9 | 17 | 1.9E+20 | |
| NGC4548 (M91) | 15.0[KP] | SB(rs)b | L2 | I | 3.0 | 27 | 2.4E+20 | |
| NGC4559 | 9.7[T88] | SAB(rs)cd | H | I | 11.9 | 60 | 1.5E+20 | S |
| NGC4561 | 12.3[T88] | SB(rs)dm | I | 3.5 | 92 | 2.1E+20 | S | |
| NGC4564 | 15.0[SBF] | E | II | 18.3 | 33 | 2.4E+20 | ||
| NGC4565 | 9.7[T88] | SA(s)b | S1.9 | I | 59.2 | 2100 | 1.3E+20 | S |
| NGC4592 | 9.6[T88] | SA(s)dm | IV | 2.1 | 1.8E+20 | S | ||
| NGC4594 (M104) | 9.8[SBF] | SA(s)a | L2 | II | 18.7 | 2700 | 3.8E+20 | |
| NGC4618 | 7.3[T88] | SB(rs)m | H | IV | 9.4 | 1.9E+20 | S | |
| NGC4625 | 8.2[T88] | SAB(rs)m | IV | 1.7 | 1.5E+20 | S | ||
| NGC4627 | 7.4[T88] | E4 | IV | 59.9 | 1.3E+20 | S | ||
| NGC4631 | 6.9[T88] | SB(s)d | H | IV | 59.9 | 1.3E+20 | S | |
| NGC4636 | 14.7[SBF] | E0 | L1.9 | II | 210.0 | 202 | 1.8E+20 | |
| NGC4670 | 11.0[T88] | SB(s)d | I | 2.6 | 12 | 1.1E+20 | S | |
| NGC4697 | 11.8[SBF] | E6 | II | 39.7 | 120 | 2.1E+20 | ||
| NGC4713 | 10.9[T92] | SAB(rs)d | T2 | I | 4.9 | 10 | 2.0E+20 | |
| NGC4725 | 12.4[T88] | SAB(r)ab | S2: | I | 2.4 | 196 | 1.0E+20 | S |
| NGC4736 (M94) | 4.3[T88] | SA(r)ab | L2 | II | 47.3 | 90 | 1.4E+20 | S |
| NGC4826 (M64) | 4.1[T88] | SA(rs)ab | T2 | III | 1.8 | 2.6E+20 | S | |
| NGC4945 | 5.2[T88] | SB(s)cd | S2 | II | 49.7 | 1000 | 1.6E+21 | |
| NGC5055 (M63) | 7.2[T88] | SA(rs)bc | T2 | II | 28.3 | 200 | 1.3E+20 | S |
| NGC5068 | 6.7[T88] | SAB(rs)cd | IV | 28.3 | 7.8E+20 | |||
| NGC5102 | 4.0[SBF] | SA0- | H | I | 34.6 | 14 | 4.3E+20 | |
| NGC5128 (Cen A) | 4.2[SBF] | S0 | S2 | II | 99.5 | 134000 | 8.6E+20 | |
| NGC5194 (M51a) | 7.7[T88] | SA(s)bc | S2 | II | 14.9 | 200 | 1.6E+20 | S |
| NGC5195 (M51b) | 7.7[T88] | I0 | L2: | II | 41.7 | 522 | 1.6E+20 | S |
| NGC5204 | 4.8[T88] | SA(s)m | H | IV | 48.9 | 1.4E+20 | S | |
| NGC5236 (M83) | 4.7[T88] | SAB(s)c | II | 49.5 | 690 | 3.8E+20 | ||
| NGC5253 | 3.2[KP] | peculiar | H | II | 57.3 | 70 | 3.9E+20 | |
| NGC5457 (M101) | 5.4[T88] | SAB(rs)cd | H | I | 98.2 | 310 | 1.2E+20 | S |
| NGC5474 | 6.0[T88] | SA(s)cd | H | IV | 1.7 | 1.2E+20 | S | |
| NGC5585 | 7.0[T88] | SAB(s)d | H | IV | 5.3 | 1.4E+20 | S | |
| NGC5879 | 12.3[T92] | SA(rs)bc | T2/L2 | I | 90.1 | 159 | 1.5E+20 | |
| NGC5949 | 11.2[T88] | SA(r)bc | IV | 3.0 | 2.0E+20 | S | ||
| NGC6503 | 6.1[T88] | SA(s)cd | T2/S2: | I | 13.2 | 15 | 4.1E+20 | S |
| NGC6690 | 12.2[T88] | Sd | IV | 3.5 | 5.9E+20 | S | ||
| NGC6822 | 0.5[MM] | IB(s)m | IV | 28.4 | 9.5E+20 | |||
| NGC6946 | 5.5[T88] | SAB(rs)cd | H | II | 58.3 | 159 | 2.1E+21 | S |
| NGC7013 | 14.2[T88] | SA(r)0a | L | I | 4.4 | 49 | 1.7E+21 | S |
| NGC7090 | 6.6[T92] | SBc | IV | 57.4 | 2.8E+20 | |||
| NGC7320 | 13.8[T88] | SA(s)d | H | I | 19.9 | 13 | 8.0E+20 | S |
| NGC7331 | 14.3[T88] | SA(s)b | T2 | II | 30.1 | 78 | 8.6E+20 | S |
| NGC7424 | 11.5[T88] | SAB(rs)cd | IV | 47.8 | 1.3E+20 | |||
| NGC7457 | 13.2[SBF] | SA(rs)0- | I | 9.1 | 10 | 5.6E+20 | ||
| NGC7640 | 8.6[T88] | SB(s)c | H | IV | 1.9 | 1.0E+21 | S | |
| NGC7741 | 12.3[T88] | SB(s)cd | H | IV | 3.5 | 4.7E+20 | S | |
| NGC7793 | 3.7[T92] | SA(s)d | H | IV | 49.5 | 1.2E+20 | ||
| PGC3589 | 0.08[MM] | E | IV | 6.1 | 2.0E+20 | |||
| PGC13449 | 11.0[NED] | SAB(s)0o | IV | 44.1 | 1.3E+20 | |||
| PGC13452 | 12.0[NED] | E0 | IV | 63.7 | 1.4E+20 | |||
| PGC16744 | 9.1[NED] | SB0 | IV | 46.7 | 1.6E+20 | |||
| PGC24175 | 10.5[T88] | I0 | II | 20.0 | 188 | 9.8E+20 | ||
| PGC40512 | 10.3[NED] | E | IV | 40.2 | 2.5E+20 | |||
| PGC46093 | 5.2[NED] | Im | IV | 28.3 | 1.3E+20 | |||
| PGC50779 (Circinus) | 4.2[T88] | SA(s)b | S2 | II | 24.6 | 6600 | 5.6E+21 | |
| UGC2126 | 9.5[NED] | SABdm | IV | 2.7 | 7.8E+20 | |||
| UGC5336 (Ho IX) | 3.42[KP] | Im | IV | 5.1 | 4.1E+20 | |||
| UGC6456 | 1.4[T88] | peculiar | IV | 10.6 | 3.8E+20 | |||
| UGC7636 | 3.7[NED] | Im | IV | 10.4 | 1.7E+20 | |||
| UGC8041 | 14.2[T88] | SB(s)d | IV | 4.7 | 1.6E+20 | S | ||
| UGC11466 | 11.2[T88] | Sab | IV | 2.7 | 1.3E+21 | S |
| Sample | Morphological Class | Bar Structure ClassaaSA: non-barred spirals; SAB: weakly barred spirals; SB: strongly barred spirals. | Spectroscopic ClassbbS: Seyferts; L: LINERs; T: transition objects; H: HII nuclei. | ||||||||||
|---|---|---|---|---|---|---|---|---|---|---|---|---|---|
| E | S0–Sb | Sc–Sm | Irr/pec | SA | SAB | SB | S | L | T | H | |||
| Optical/IR | 0/3 | 27/50 | 18/50 | 2/13 | 21/34 | 16/27 | 6/26 | 7/9 | 12/13 | 5/12 | 16/46 | ||
| Extended | 6/14 | 51/80 | 25/68 | 4/25 | 30/48 | 24/41 | 16/42 | 14/16 | 19/20 | 12/20 | 18/54 | ||
| Sample | Early-type spirals (S0–Sb) | Late-type spirals (Sc–Sm) | |||||
|---|---|---|---|---|---|---|---|
| SA | SAB | SB | SA | SAB | SB | ||
| Optical/IR | 14/20 | 9/12 | 2/9 | 7/14 | 7/15 | 4/17 | |
| Extended | 22/30 | 13/19 | 10/18 | 8/18 | 11/22 | 6/24 | |
| Galaxy | aaEmitted luminosity in the – keV band, inferred from the best-fitting spectral model. | bbIntrinsic neutral-hydrogen column density, inferred from the best-fitting spectral model. For sources with net counts, such estimates are not meaningful, and no value is listed; the luminosity of those sources is estimated assuming Galactic line-of-sight absorption only. | ModelccOur spectral models are coded as follows. P: power-law with Galactic absorption; AP: power-law with Galactic and intrinsic absorption; ARP: two-component model, with an absorbed optically-thin thermal plasma and an absorbed power-law component; AHP: power-law absorbed by both neutral hydrogen and an ionized absorber; AHRP: two-component model with an optically-thin thermal plasma component and a power-law component, absorbed by both neutral hydrogen and an ionized absorber. AHBP: two-component model with a disk-blackbody and a power-law component, absorbed by both neutral hydrogen and an ionized absorber. When a reference number is given, we used spectral-analysis results from the literature. | ddInclination angle of the host galaxy, from de Vaucouleurs et al. [10] | MethodeeMethods used for estimating the nuclear BH masses (assuming that late-type galaxies contain BHs), as follows. S: stellar kinematics; G: gas kinematics; M: kinematics of water-maser clumps; R: reverberation mapping; MS: – relation [117]; MN: –Sersić index relation [39]; BB: BH mass–bulge mass relation [15]. | ffX-ray Eddington ratio, defined as . | log()ggAccretion parameter required for the inferred X-ray luminosity, assuming the radiatively-inefficient ADAF model; we used the grid of ADAF solutions plotted in Merloni et al. [79]. From our definition of , the Eddington luminosity corresponds to . | ||
|---|---|---|---|---|---|---|---|---|---|
| ( ) | ( cm-2) | (°) | ( ) | ||||||
| IC342 | 0.37 | ARP | 20 | 0.25 | MS | 1.2E06 | |||
| IC396 | 2.5 | AP | 47 | ||||||
| NGC45 | 0.021 | AP | 47 | ||||||
| NGC253 | 2.0 | [1] | 86 | 0.94 | MS | 1.6E06 | |||
| NGC404 | 0.031 | AP | 0 | 0.06 | MS | 4.0E07 | |||
| NGC598 (M33) | 0.8 | AP,[2] | 56 | S,[3] | |||||
| NGC628 (M74) | 0.18 | AP | 0 | 0.5 | BB,[4] | 2.7E07 | |||
| NGC891 | 0.0045 | P | 84 | 0.23 | MS | 1.5E08 | |||
| NGC925 | 0.59 | AP | 54 | ||||||
| NGC1012 | 165 | AP | 61 | ||||||
| NGC1023 | 0.73 | AP | 72 | 4.4 | S,[5] | 1.3E07 | |||
| NGC1058 | 0.055 | P | 16 | 0.012 | MS | 3.4E06 | |||
| NGC1068 (M77) | 300 | [6] | 29 | 1.50 | M,[7] | 1.6E04 | |||
| NGC1291 | 2.0 | AP,[8] | 28 | 7.4 | MS | 2.1E07 | |||
| NGC1493 | 0.54 | AP | 0 | ||||||
| NGC1637 | 0.12 | [9] | 39 | ||||||
| NGC1672 | 1.0 | [10] | 37 | ||||||
| NGC1808 | 12 | [11] | 50 | 4.1 | MS | 1.7E06 | |||
| NGC2500 | 0.35 | P | 0 | ||||||
| NGC2681 | 0.61 | ARP | 0 | 1.2 | MS | 4.0E07 | |||
| NGC2683 | 9.0 | AHP | 79 | 1.5 | MS | 4.6E06 | |||
| NGC2787 | 3.2 | AP | 52 | 4.1 | G,[12] | 6.0E07 | |||
| NGC2841 | 0.89 | AP | 64 | 6.3 | BB,[13] | 1.1E07 | |||
| NGC3031 (M81) | 100 | AP,[14] | 60 | 6.8 | BB,[15] | 1.1E05 | |||
| NGC3077 | 0.060 | AP | 43 | ||||||
| NGC3115 | 0.28 | AP | 66 | 92 | S,[16] | 2.4E09 | |||
| NGC3125 | 0.04 | AP | |||||||
| NGC3184 | 0.02 | AP | 26 | ||||||
| NGC3344 | 0.36 | P | 23 | 0.16 | BB,[4] | 1.8E06 | |||
| NGC3368 (M96) | 0.19 | P | 50 | 3.2 | BB,[4] | 4.5E08 | |||
| NGC3377 | 0.39 | AP | 54 | 10 | S,[17,18] | 3.0E08 | |||
| NGC3379 (M105) | 0.28 | AP | 25 | 13.5 | S,[19] | 1.4E08 | |||
| NGC3384 | 0.55 | AP | 65 | 1.6 | S,[17,20] | 2.4E07 | |||
| NGC3412 | 0.044 | P | 59 | 0.87 | MS | 4.0E08 | |||
| NGC3489 | 0.66 | AP | 56 | 1.0 | MS | 5.0E07 | |||
| NGC3507 | 0.22 | ARP | 37 | 0.79 | MN | 2.2E07 | |||
| NGC3521 | 0.15 | AP | 61 | 0.26 | MN | 4.4E07 | |||
| NGC3556 (M108) | 0.023 | P | 81 | ||||||
| NGC3593 | 0.21 | P | 69 | 0.63 | BB,[4] | 2.6E07 | |||
| NGC3623 (M65) | 0.22 | P | 81 | 1.3 | BB,[4] | 1.4E07 | |||
| NGC3627 (M66) | 0.912 | P | 65 | 1.3 | BB,[4] | 5.6E07 | |||
| NGC3998 | 280 | AP | 36 | 60 | S,[21] | 3.6E06 | |||
| NGC4026 | 0.4 | AP | 83 | 21 | S,[22] | 1.5E08 | |||
| NGC4111 | 7.6 | ARP | 87 | 4.0 | MS | 1.4E06 | |||
| NGC4136 | 0.15 | AP | 0 | 0.04 | BB,[4] | 2.9E06 | |||
| NGC4138 | 200 | AP | 58 | 3.2 | MS | 4.9E05 | |||
| NGC4203 | 18 | AHRP | 26 | 5.8 | MS | 2.4E06 | |||
| NGC4258 (M106) | 31 | AP | 71 | 3.9 | M,[23] | 6.1E06 | |||
| NGC4314 | 0.068 | AP | 15 | 1.0 | BB,[4] | 5.2E08 | |||
| NGC4321 (M100) | 0.15 | ARP | 37 | 0.45 | MS | 2.6E07 | |||
| NGC4342 | 0.48 | AP | 58 | 33 | S,[13] | 1.1E08 | |||
| NGC4343 | 0.25 | P | |||||||
| NGC4395 | 5.2 | AHP | 38 | 0.036 | R,[24] | 1.3E04 | |||
| NGC4414 | 0.21 | P | 50 | 1.2 | MS | 1.4E07 | |||
| NGC4419 | 1.8 | AP | 75 | 0.8 | MS | 1.7E06 | |||
| NGC4527 | 0.78 | AP | 68 | 16.7 | MS | 3.6E08 | |||
| NGC4548 (M91) | 8.4 | AP | 37 | 3.6 | MS | 1.8E06 | |||
| NGC4559 | 1.2 | AP | 69 | ||||||
| NGC4561 | 4.3 | AP | 25 | ||||||
| NGC4564 | 0.48 | AP | 62 | 5.6 | S,[17,20] | 6.4E08 | |||
| NGC4565 | 4.5 | AP | 90 | 2.9 | MS | 1.2E06 | |||
| NGC4594 (M104) | 17 | AP | 79 | 100 | BB,[4] | 1.3E07 | |||
| NGC4636 | 0.21 | [25] | 44 | 7.9 | MS,[15] | 2.0E08 | |||
| NGC4670 | 0.79 | AP | 31 | ||||||
| NGC4697 | 0.03 | [26] | 44 | 17 | S,[17,20] | 1.0E09 | |||
| NGC4713 | 0.18 | P | 53 | ||||||
| NGC4725 | 0.54 | AHBP | 43 | 3.4 | MS | 1.2E07 | |||
| NGC4736 (M94) | 1.0 | AP, [27] | 33 | 2.2 | MS | 3.5E07 | |||
| NGC4945 | 20000 | [28] | 90 | 0.14 | M,[29] | 0.11 | |||
| NGC5055 (M63) | 0.34 | AP | 55 | 0.87 | MS | 3.0E07 | |||
| NGC5102 | 0.006 | AP | 71 | 3.0 | MS | 1.6E09 | |||
| NGC5128 (Cen A) | 600 | AP,[30] | 43 | 20 | G,[31] | 1.9E05 | |||
| NGC5194 (M51a) | 200 | [32,33] | 64 | 0.71 | MS | 2.2E04 | |||
| NGC5195 (M51b) | 0.8 | AP,[34] | 46 | 3.9 | MS | 1.6E07 | |||
| NGC5236 (M83) | 0.26 | AP,[35] | 24 | 1.3 | S,[36] | 1.5E07 | |||
| NGC5253 | 0.1 | [37] | 77 | ||||||
| NGC5457 (M101) | 0.1 | AP,[38] | 0 | 0.24 | MS | 3.2E07 | |||
| NGC5879 | 24 | ARP | 73 | 0.25 | MS | 7.4E06 | - | ||
| NGC6503 | 0.086 | AP | 74 | 0.037 | MS | 1.8E06 | |||
| NGC6946 | 0.1 | AP | 42 | 2.7 | MN | 2.9E08 | |||
| NGC7013 | 11.4 | AHP | 76 | 0.54 | MS | 1.6E05 | |||
| NGC7320 | 0.17 | AP | 60 | ||||||
| NGC7331 | 0.52 | AP | 68 | 3.0 | MS | 1.4E07 | |||
| NGC7457 | 0.18 | P | 56 | 0.35 | S,[17,20] | 4.0E07 | |||
| PGC24175 | 0.87 | AP | 32 | ||||||
| PGC50779 | 20 | [39] | 65 | 0.17 | M,[40] | 9.1E05 |
References. — [1]: Weaver et al. [128]; [2]: Plucinsky et al. [98]; [3]: Gebhardt et al. [33]; [4]: Dong & De Robertis [15]; [5]: Bower et al. [5]; [6]: Young et al. [131]; [7]: Greenhill & Gwinn [43]; [8]: Irwin et al. [64]; [9]: Immler et al. [63]; [10]: Jenkins et al. [66]; [11]: Jímenez-Bailón et al. [68]; [12]: Sarzi et al. [105]; [13]: Cretton & van den Bosch [9]; [14]: Swartz et al. [114]; [15]: Merritt & Ferrarese [80]; [16]: Emsellem et al. [20]; [17]: Gebhardt et al. [34]; [18]: Kormendy et al. [71]; [19]: Gebhardt et al. [32]; [20]: Pinkney et al. [97]; [21]: Bower et al. [4]; [22]: Gultekin et al. [47]; [23]: Herrnstein et al. [53]; [24]: Peterson et al. [96]; [25]: Posson-Brown et al. [99]; [26]: Wrobel et al. [130]; [27]: Pellegrini et al. [94]; [28]: Done et al. [13]; [29]: Greenhill et al. [44]; [30]: Evans et al. [22]; [31]: Thatte et al. [120]; [32]: Terashima & Wilson [118]; [33]: Fukazawa et al. [29]; [34]: Terashima & Wilson [119]; [35]: Soria & Wu [112]; [36]: Marconi et al. [77]; [37]: Summers et al. [113]; [38]: Pence et al. [95]; [39]: Smith & Wilson [111]; [40]: Greenhill et al. [45]