Science-Operational Metrics and Issuesfor the “Are We Alone?” Movement
A movement is underway to test the uniqueness of Earth. Sponsored primarily by NASA, it is enlisting talented researchers from many disciplines. It is conceiving new telescopes to discover and characterize other worlds like Earth around nearby stars and to obtain their spectra. The goal is to search for signs of biological activity and perhaps find other cradles of life.
Most effort thus far has focused on the optics to make such observations feasible. Relatively little attention has been paid to science operations—the link between instrument and science. Because of the special challenges presented by extrasolar planets, science-operational issues may be limiting factors for the “Are We Alone?” (AWA) movement. Science-operational metrics can help compare the merits of direct and astrometric planet searches, and estimate the concatenated completeness of searching followed by spectroscopy. This completeness is the prime science metric of the AWA program. Therefore, the goals of this white paper are to present representative calculations involving science-operational metrics, and to promote a science-operational perspective. We urge the Survey Committee to allow this perspective and such metrics to inform its plan for the future of AWA.
Extreme targets
Because of three features, an Earth twin (ET)—the AWA benchmark adopted for the calculations presented here—is the most extreme target in astronomy: low information rate, high variability in position and brightness, and the huge, proximate, unwanted signal of the star. To illustrate, consider a space telescope with aperture m, the largest currently under serious discussion. With efficiency , and resolving power in the band, this telescope would detect 0.1 photons per second from an ET at quadrature at 20-pc distance. The apparent separation of the stellar and planetary images would be 0.05 arcsec or . Assuming an inner working angle —meaning the radius of the photometrically inaccessible region immediately around the star—and assuming a maximum feasible difference in magnitudes between the planet and star , set by wavefront instability for an internal coronagraph, or by the starshade accuracy and alignment in the case of an external occultor, such an ET on a random orbit would be detectable 66% of random search epochs.11 1 See calculations of completeness and discussion of in Brown, R. A. 2005, “Single-Visit Photometric and Obscurational Completeness,” ApJ, 624, 1010–1024. The median time for a detected ET on a partially obscured orbit to become undetectable again—too faint or too close to the star—is two months after detection. Assuming the optics suppress the diffraction wings by factor 10-10 from the central intensity of the stellar image, and assuming sharpness , some 10 photons of scattered starlight and 1 photon of zodiacal light—assuming 1.0 local zodi and 2.0 exozodi—would be counted with each planetary photon during the exposure time sec that would be required to obtain a spectrum with photometric signal-to-noise ratio at the oxygen band (760 nm), as required to measure 20% of Earth’s column density of O2 with 99% confidence.22 2 For details of the photometric calculation, see HandCheckPhotometry_SunEarth.doc at http://homepage.mac.com/planetfinder/.
Turning to the astrometric signal, at 20 pc the amplitude of the astrometric wobble of the Sun due to the orbiting ET would be as or 0.00064 solar radius. varies directly with the square root of the stellar luminosity and inversely with the stellar mass. An astrometric data set comprises measurements of the form (, , , , ): the – position at epochs spread over more than one planetary period, where the exposure time is for each of the two quasi-orthogonal directions, and where is the positional uncertainty in either direction. The astrometric signal-to-noise ratio is , where
where is the total exposure time. This noise reduction with and is valid only down to the noise floor, or for , where is determined by systematic effects. For the Space Interferometry Mission (SIM Lite), a space astrometer currently under study, we use the instrumental parameters are as, sec, and as.33 3 Unwin, S. C., et al. 2008, “Taking the Measure of the Universe: Precision Astrometry with SIM PlanetQuest,” PASP, 120, 38.,44 4 Catanzarite, J., Shao, M., Tanner, A., Unwin, S., & Yu, J. 2006, “Astrometric detection of terrestrial planets in the habitable zones of nearby stars with SIM PlanetQuest,” PASP, 118, 1319–1339.,55 5 Traub, W. A., et al. 2009, in Extrasolar Planets in Multi-Body Systems: Theory and Observations, Ed. Krzysztof Gozdziewski, European Astronomical Society Publication Series, in preparation.,66 6 Brown, R. A. 2009, “On the Completeness of Reflex Astrometry on Extrasolar Planets near the Sensitivity Limit,” submitted to ApJ; http://arxiv.org/pdf/0901.4897/.
Assuming periodogram (power spectrum) analysis of the data set to find weak, periodic signals, the search completeness , ) depends on and the accepted false-alarm probability ; for example, for . The sensitivity limit for detection probability is therefore as, which would be achieved in sec. For example, an ET at 14.3 pc would be just detectable by SIM Lite under these assumptions, because the required as, which is equal to the noise floor.
The mother of all problems
The mother of all science-operational problems for AWA is the density of stars in the solar neighborhood. If it were higher, Hubble ( m) might have obtained the first spectrum of an ET—if it were capable of contrast, of course.

Figure 1 shows the 7332 stars in a SIM Lite project star list for planet searching.77 7 Thanks to Joe Catanzarite for developing and sharing this star list, which includes all the dwarfs and subgiants within 100 pc in the NStED data base (http://nsted.ipac.caltech.edu/) with stars cut by these criteria: (1) known from the Washington Double Star Catalog to have a companion closer than 35 mas, (2) known to have a companion between 35 mas and 1.5 arcsec with magnitude difference , (3) luminosity , (4) fainter than , (5) chromospheric activity index , (6) known to have age Gyr, or (7) with orbital period at Earth’s equilibrium temperature years. For this list, a telescope with m resolves 505 ETs at some time in their orbits and achieves the required for the O2 spectrum in less than sec, an arbitrary, “stretch” exposure time. (“ET” now means the same radius and albedo as Earth, but with semimajor axis equal to , where is the stellar luminosity, which ensures the same equilibrium temperature.)
The exposure time for the O2 spectrum for the hypothetical Earth-Sun system at 20 pc is close to the median value for the 505 stars: sec.
Some 117 of the 505 stars suitable for O2 spectroscopy with a 16-m telescope have ETs detectable by SIM Lite according to the sole criterion as.
Finding their addresses
For ETs, the two main searching options under consideration today are direct imaging and astrometry. Radial velocity works for larger planetary masses, but probably not ETs. For example, the 505 stars just discussed have a median mass of 0.97 and range from 0.4 to 2.4 solar masses. The radial-velocity amplitude for the Earth-Sun is 0.089 m/sec, assuming an edge-on orbit. For other stars, the ET radial-velocity amplitude varies inversely with both the square root of the mass and the fourth root of the luminosity. For the 505 stars, the median radial-velocity amplitude is 0.094 and ranges from 0.03 to 0.3 m/sec—substantially beyond current radial-velocity performance limits. Occultation photometry won’t work because the alignments are highly improbable for the number of nearby stars.
Discovery by direct detection was studied intensively for TPF-C.88 8 Brown, R. A., Hunyadi, S. L., & Shaklan, S. B. 2006, “A DRM for TPF-C: A Design Reference Mission for the Coronagraphic Terrestrial Planet Finder;” http://planetquest.jpl.nasa.gov/TPF/tpfcDocs/Brown.pdf/. It tends to be inefficient—low completeness per search observation due to the highly obscured orbits, and long exposure times—but still feasible. Certainly, any telescope that could obtain the O2 -band spectrum of an ET at could detect the planet by direct imaging in a shorter time at –10. Nevertheless, a search calls for starlight suppression over a large field of view, whereas spectroscopy requires it only at the planetary position—if the position is known. Furthermore, direct detection has other problems that have not been solved. For example, it cannot easily determine the identity of a faint image, which could be an ET, a speckle, a background source, a cluster of exo-zodiacal light, or a companion of only indirect interest for AWA, such as a Neptune or Jupiter. The discovery image—and indeed all the data obtained in the first observing season—would provide neither the mass nor the orbit. (Solar avoidance angles are typically , which means observing seasons months; orbital coverage is inadequate in the first season.) First-season images could disambiguate the only a fraction of sources, depending on a star’s particular combination of parallactic ellipse and proper motion. Another debilitating consequence of not determining the orbit is that recovery of the planet in future observing seasons---predicting its position for planning and scheduling purposes---becomes a low-probability, hit-or-miss proposition.99 9 Brown, R. A., Shaklan, S. B., & Hunyadi, S. L. 2006, “Science Operations and the Minimum Scale of TPF,” JPL 07-02 7/07, Proceedings of TPF-C Workshop 9/28–29/2007. (SciOpsTPF.pdf at http://homepage.mac.com/planetfinder/.)
To further investigate astrometric discovery, we conducted a reverse auction of exposure time to maximize the number of planets discovered (total completeness) as a function of exposure time on SIM Lite (assuming 100% duty cycle). First, was assigned to each of the 505 stars. Next, and the completenesses were computed using the “discovery” curve in Fig. 1 of Ref. 6. Next, those steps were repeated for minus 2200 sec (a quantum of exposure time), and the star was identified for which the reduction in completeness would be smallest. For that star, the reduction in and associated reduction in were implemented accordingly. This process was repeated many times, always removing the smallest amount of completeness per 2200 sec of exposure time, until the point was reached where . The auction record is shown in Fig. 2. At year, 33 stars were still being observed. For these stars, the minimum, median, and maximum values of were (5.8, 7.2, 11.1), with corresponding values of values of : (0.44, 0.74, 0.99).
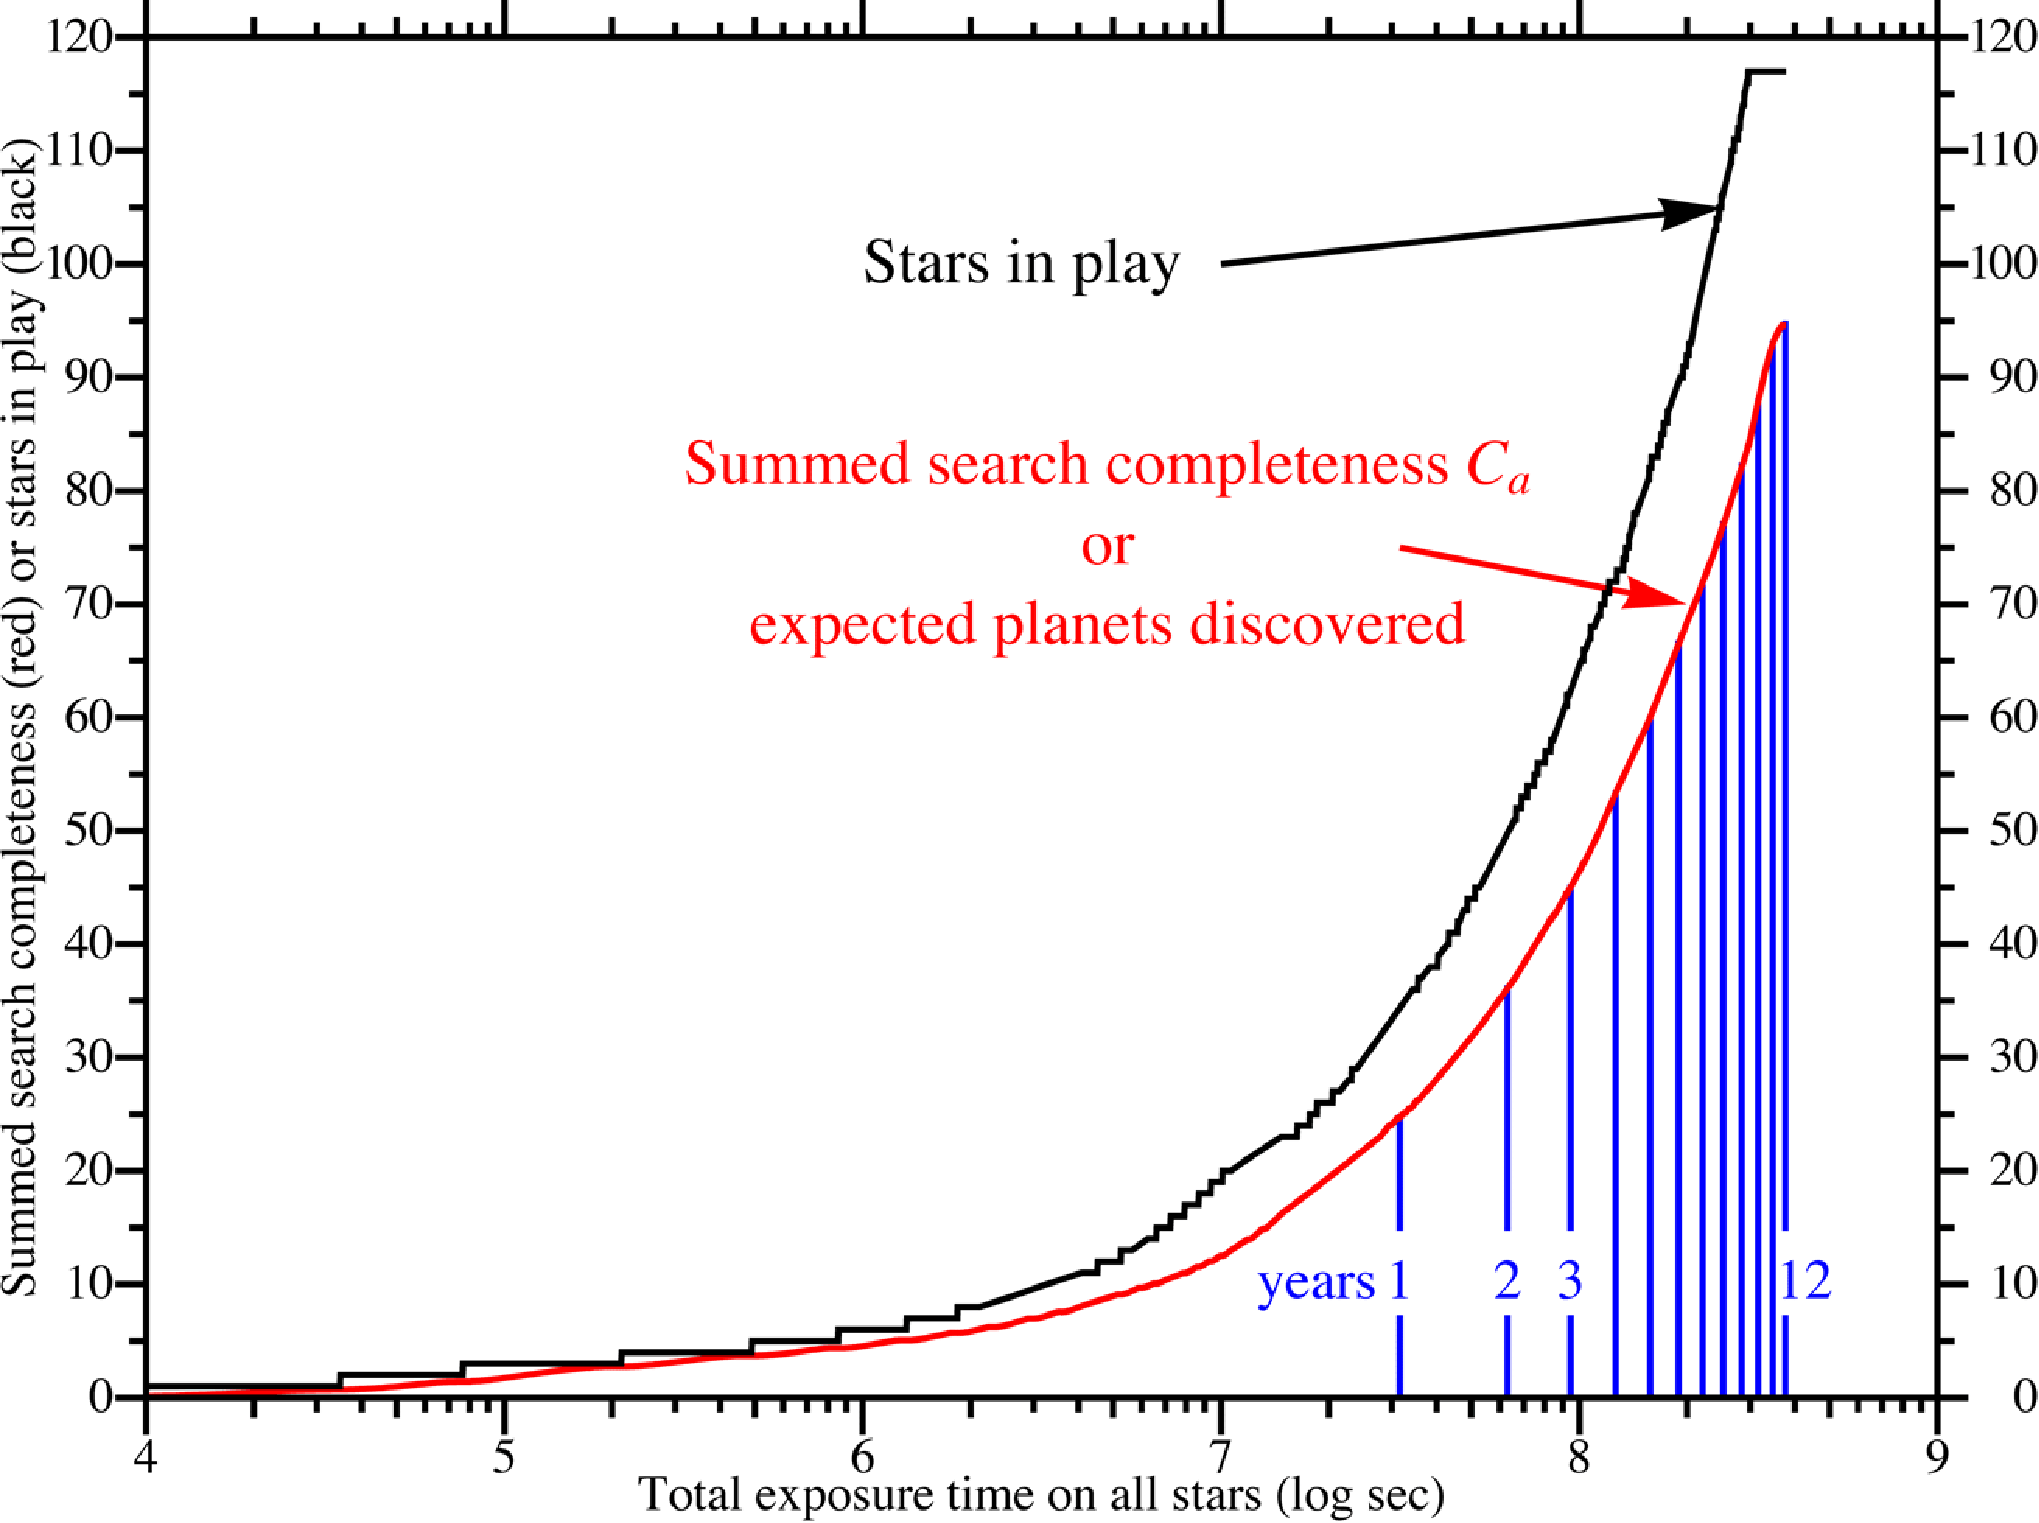
The discovery of a planet—yes or no—is a Bernoulli random variable with probability . The expectation value of the sum of Bernoulli random variables is the sum of their probabilities. By summing the values of , we find the expectation value of the number of ETs discovered. For year, In this case, if the occurrence rate of ETs is , the most probable result would be one ET discovered but a 30% chance of zero.
For years, all , all 117 stars are searched to their limits, and .
Astrometry’s unique forte is determining the masses and orbits of the ETs discovered. However, the least-squares estimators of Keplerian parameters, particularly for mass and eccentricity, are biased in the low regime, which is the domain of ETs for SIM Lite.1010 10 For astrometry, see Ref. 6; for radial velocity, see: Shen, Y. & Turner, E. L. 2008, “On the Eccentricity Distribution of Exoplanets from Radial Velocity Surveys,” ApJ, 685, 553. Preliminary indications are that, as a result of this bias, the completeness for mass estimates as good as 25% would be below 0.7, and below 0.3 for ±10% accuracy, for typical ETs observed by SIM Lite. The biased estimation of orbital elements also reduces the accuracy of positional estimates.6
Discussions
The above calculations are science operational. They estimate the science produced by operating the hardware. Because science is the ultimate purpose of the hardware, such calculations are essential for defining, understanding, and prioritizing exoplanetary projects. This is particularly important for the AWA movement, both because of the dynamic, low-SNR targets, and because complementary, concatenated missions may be involved.
Because of unresolved science-operational issues, it is challenging to outline a coherent, low-risk AWA mission series, progressing systematically from discovery of ETs to atmospheric spectroscopy in search of biomarkers. The results of Kepler will certainly help by clarifying what total search completeness is required to ensure an adequate sample of ETs. Even when the occurrence rate of ETs is better known, however, we still need deliberate processes for discovering, identifying, and obtaining the ephemerides of nearby ETs.
That is the top-down approach. The default, bottom-up approach would have the AWA movement not defining single-purpose missions, but proceeding opportunistically, competing for instrumental and observational opportunities on missions that are justified primarily by other science priorities. For example, the TPF-C studies illustrate that high-performance coronagraphy is compatible with wide-field imaging---not only for optics and instruments on an off-axis, unobscured telescope, but also in terms of science operations.1111 11 R. A. Brown et al. 2006, “Final Report of an Instrument Concept Study for a Wide-Field Camera for TPF-C.” See WFC ICS Final Report.pdf at http://homepage.mac.com/planetfinder/.
Someday, Hubble’s successor will be built to rekindle research along the long frontiers of science for which Hubble defines the present state of knowledge. A coronagraph will surely be on board---this time with realistic hopes for the goal of ‘‘direct imaging …for planetary companions of nearby stars.’’1212 12 A listed science objective in NASA’s “Announcement of Opportunity for Space Telescope,” March 1977. To illustratate the relative power of direct imaging, we note that all 33 stars circled in Fig. 1 are bright and close. Their ETs would be resolved with an for an 8-m telescope, which would achieve at in the band with a median exposure time of only sec. For 27 of the 33 stars, a 4-m telescope would do the same with a median exposure time sec.
Similarly, in the case of space astrometry, astrophysical science other than exoplanetary was strongly endorsed by two previous decadal surveys, and it remains the SIM Lite mission’s primary justification. If SIM Lite finds ETs, it will prove the existence theorem and produce at least rough estimates of mass and orbit. This will be of great interest. As illustrated in Fig. 2, more observing time would reach more stars: 12 years of SIM Lite exposure time, or 12 SIM Lites each exposing for 1 year, would discover all the ETs available to SIM Lite in this star sample.
Final remarks
The fact we can even contemplate such challenging observations attests to NASA’s progressive mastery of ever-broader wavefronts of astronomical light. This great achievement is evidenced by the success of the Hubble Space Telescope, as well as by plans for the James Webb Space Telescope, as well as designs for the SIM Lite and the coronagraphic Terrestrial Planet Finder (TPF-C). This mastery, on which any optimistic view of the long-term future of astronomy must largely be based, will be counted among the finest achievements of the space program.
In his memoir, Riccardo Giacconi offers a comment pertinent to AWA, on ‘‘the greatly increased program of research on extrasolar planets, stemming mainly from the personal interest of Daniel S. Goldin (a manager and engineer), NASA’s administrator from 1992 to 2005. This increased effort was welcomed by a minority of the astronomical community, but happened without prioritization with respect to other fields in astronomy of much greater astrophysical interest.’’1313 13 Giacconi, R. 2008, Secrets of the Hoary Deep: A Personal History of Modern Astronomy, (Baltimore: The Johns Hopkins University Press). Hopefully, in the current decadal study, the AWA movement will be reconciled with other priorities, based on the AWA science that could actually be produced by operating the hardware, as estimated by science-operational metrics.