On the impact of intergalactic dust on cosmology with type Ia supernovae
Abstract
Supernova measurements have become a key ingredient in current determinations of cosmological parameters. These sources can however be used as standard candles only after correcting their apparent brightness for a number of effects. In this paper we discuss some limitations imposed by the formalism currently used for such corrections and investigate the impact on cosmological constraints. We show that color corrections are, in general, expected to be biased. In addition, color excesses which do not add a significant scatter to the observed SN brightnesses affect the value of cosmological parameters but leave the slope of the color-luminosity relation unchanged.
We quantify these biases in the context of the redshift-dependent dust extinction suggested by the recent detection of intergalactic dust by Ménard et al. (2009). Using a range of models for the opacity of the Universe as a function of redshift, we find that color-magnitude-stretch scaling relations are virtually insensitive to the presence of cosmic dust while cosmological parameters such as and are biased at the level of a few percent, i.e. offsets comparable to the current statistical errors.
Future surveys will be able to limit the impact of intergalactic extinction by observing at larger wavelengths. In addition such datasets will provide direct detections of intergalactic dust by cross-correlating SN colors and the density of foreground galaxies, which can be used as a consistency check on the cosmic dust extinction correction. Alternatively, such biases could be avoided by correcting the colors of supernovae on an object-by-object basis with accurate photometry.
Keywords:
supernovae – cosmology: parameters – dust: intergalactic1 INTRODUCTION
About a decade ago, the use of type Ia supernovae (SNe Ia) as standardizable candles led to the discovery of the accelerating expansion of the Universe (Garnavich et al. 1998; Perlmutter et al. 1998; Riess et al. 1998; Schmidt et al. 1998). Since then, SNe Ia measurements have become a cornerstone in cosmological parameters estimation. More recent and upcoming surveys are aiming to push these constraints to higher accuracies and explore the properties of dark energy. To this end, it is important to identify and characterize the potential limits and biases involved.
The use of SNe Ia as standard candles requires correcting their observed magnitudes for a number of effects: a luminosity–light curve shape dependence (usually referred to as the “stretch”), a luminosity–color relation, dust extinction and gravitational magnification. For sufficiently large surveys, magnification effects average out, adding only scatter to the apparent magnitudes without introducing any significant bias. Conversely, the effect of dust extinction is more critical, as it is cumulative along the line of sight. In this paper, we address the limits and potential biases of the procedure currently used to correct for such effects, focusing on the extinction induced by intergalactic dust.
The presence of dust on large scales around galaxies has been the subject of numerous papers. Theoretical studies indicate that dust grains can be efficiently transported from galactic disks to the intergalactic medium through winds and radiation pressure (Aguirre, 1999; Aguirre et al., 2001; Bianchi & Ferrara, 2005). Based on estimates of the stellar density and metallicity as a function of redshift, several authors have inferred the existence of significant amounts of intergalactic dust and a cosmic dust density (Loeb & Haiman, 1997; Corasaniti, 2007; Inoue & Kamaya, 2004). The amount of dust in galaxy clusters has been explored through reddening measurements of background sources (e.g. Chelouche, Koester, & Bowen 2007; Bovy, Hogg, & Moustakas 2008; Muller et al. 2008). Upper limits on the the cosmic opacity were recently obtained by measuring the excess scatter seen in higher redshift quasar colors, (Mörtsell & Goobar, 2003), using the Toman test (More, Bovy, & Hogg, 2008) and combining constraints from luminosity distances and (Avgoustidis, Verde, & Jimenez, 2009) and using the amount of dust X-ray scattering around AGNs (Dijkstra & Loeb, 2009).
Recently, Ménard et al. (2009) (M09 hereafter) cross-correlated the colors of about 85,000 distant quasars with the position of 20 million galaxies observed with the Sloan Digital Sky Survey (York et al. 2000; SDSS). They reported a statistical detection of dust reddening up to large scales around galaxies. From this result they inferred the opacity of the Universe, calibrated at and extrapolated to higher redshifts. Their model-dependent estimate gives mag. Such an opacity is not negligible given the precision level of current supernovae surveys. This Letter makes use of these results and addresses their impact on the estimation of cosmological parameters from SNe Ia. Our analysis does not include any effects due to a possible gray dust component. If present, the biases in cosmological parameters derived below should be seen as lower limits only.
2 Cosmological information from type Ia supernovae
2.1 Scaling relations
The distance modulus of a standard candle with intrinsic absolute magnitude can be used as an estimate of the luminosity distance:
| (1) |
where is the observed magnitude. The luminosity distance is defined by the relationship between bolometric flux and luminosity : . can be related to the cosmology by
| (2) |
where, for a Universe containing a dark-energy component with density and equation of state ,
| (3) |
The impact of dust extinction on the estimation of cosmological parameters using the luminosity distance can be illustrated by Taylor-expanding the distance modulus from Equation 1. In the case of a flat Universe with a cosmological constant, we find
| (4) |
Therefore, the mean magnitude of standard candles must be controlled at a level comparable to the targeted accuracy of the matter density estimation. The above equations show that, unless corrected, the existence of a cosmic opacity of will affect the value of by a similar amount, translating into a bias for . As derived by Zhang (2008), a similar relationship can be written down for the shift in the equation of state parameter :
| (5) |
2.2 Luminosity distance and potential biases
Given a sample of supernovae, constraints on cosmological parameters can be computed by comparing the expected and observed luminosity distances. To do so we define the -function,
| (6) |
For each supernova, the distance modulus is calculated according to Equation 1 for a magnitude
| (7) |
where is the observed magnitude (usually expressed in terms of the rest-frame -band) and is the net magnitude shift needed to convert the supernova from a standardizable to a standard candle. Recent analyses have included two components to describe :
- 1.
a correction term to account for any color-magnitude relation, including intrinsic color excess, dust extinction and reddening, etc.
- 2.
a stretch correction to include an intrinsic dependence between the brightness and duration of SNe Ia
The latter term is not of interest in the present analysis; it will be included in all calculations but not discussed explicitly.
It is generally assumed that these correction terms are not redshift dependent. This allows one to write the distance modulus as
| (8) |
where refers to the stretch correction, is the color-based correction, making use of the observed color excess (usually expressed as the rest-frame E color) of each supernova11 1 Other teams have used a different parameterization to apply a color-based correction (Jha, Riess, & Kirshner 2007; Wood-Vasey et al. 2007). Nevertheless these formalisms also rely on the assumption of a non-evolving color correction and similar conclusions apply.. The coefficients and are unknown parameters which do not depend on redshift. The color correction term must account for both dust extinction and any intrinsic color-magnitude relation with a unique coefficent . A redshift-dependent color/extinction term will therefore invalidate the assumption that is constant with , introducing a bias into the parameter estimation.
The color-based correction makes use of the observable net color excess of each supernova. In general, this excess can be the sum of several components,
| (9) |
where the -terms describe the intrinsic color, dust reddening due to the host galaxy, dust along the line-of-sight and so on. In principle, each contribution can be corrected for using an appropriate color-dimming coefficient :
| (10) |
(if attributed to dust extinction, corresponds to , following the previously introduced bands).
Let us now consider the effects of cosmic dust extinction, which we will denote with the subscript “”. For simplicity, we will only consider its redshift dependence, i.e. and . The brightness of standard candles will appear modified according to . If differs from the best-fit value of found in Equation 6, a redshift-dependent magnitude bias
| (11) |
is introduced. The relation between and depends on the relative contribution of cosmic dust reddening to the overall color scatter. Note that such a bias can be either positive or negative.
In order to quantify the amplitude of this potential bias, we use the estimate of the opacity of the Universe given by M09. These authors reported reddening effects on large-scales around galaxies, characterized by . Based on these results, they proposed several model-dependent estimates of the opacity of the Universe as a function of redshift. Here we will consider two cases:
- 1.
a high- model, shown in Figure 1 with the dark-blue curve. This estimate is calibrated at the redshift of their measurement and then extrapolated to higher redshift using an evolution model based on the observed amount of dust in MgII absorbers.
- 2.
a low- model, where the cosmic dust density for the high- model is damped by a factor . This results in a significant suppression of the opacity at . This model, shown with the light-blue curve, is still consistent with broad observational constraints and only about a factor higher than the allowed lower limits.
Recent analyses of SNe Ia point toward a value of (Kowalski et al., 2008) which is derived from minimizing the residuals in the Hubble diagram. According to Equation 11, a component of cosmic dust with will bias the distance modulus estimate by
| (12) |
Given the simple scaling relations derived in §2.1, this will in turn bias the inferred value by . This translates into a bias for . Below we quantify this effect more accurately, using existing data.

2.3 Application to the Union supernova sample
We now investigate the impact of cosmic dust on a recent supernova dataset: the “Union” sample (Kowalski et al., 2008). These authors have combined various supernova samples, compiling a “clean” dataset of 307 SNe with which they used to infer cosmological parameter constraints.
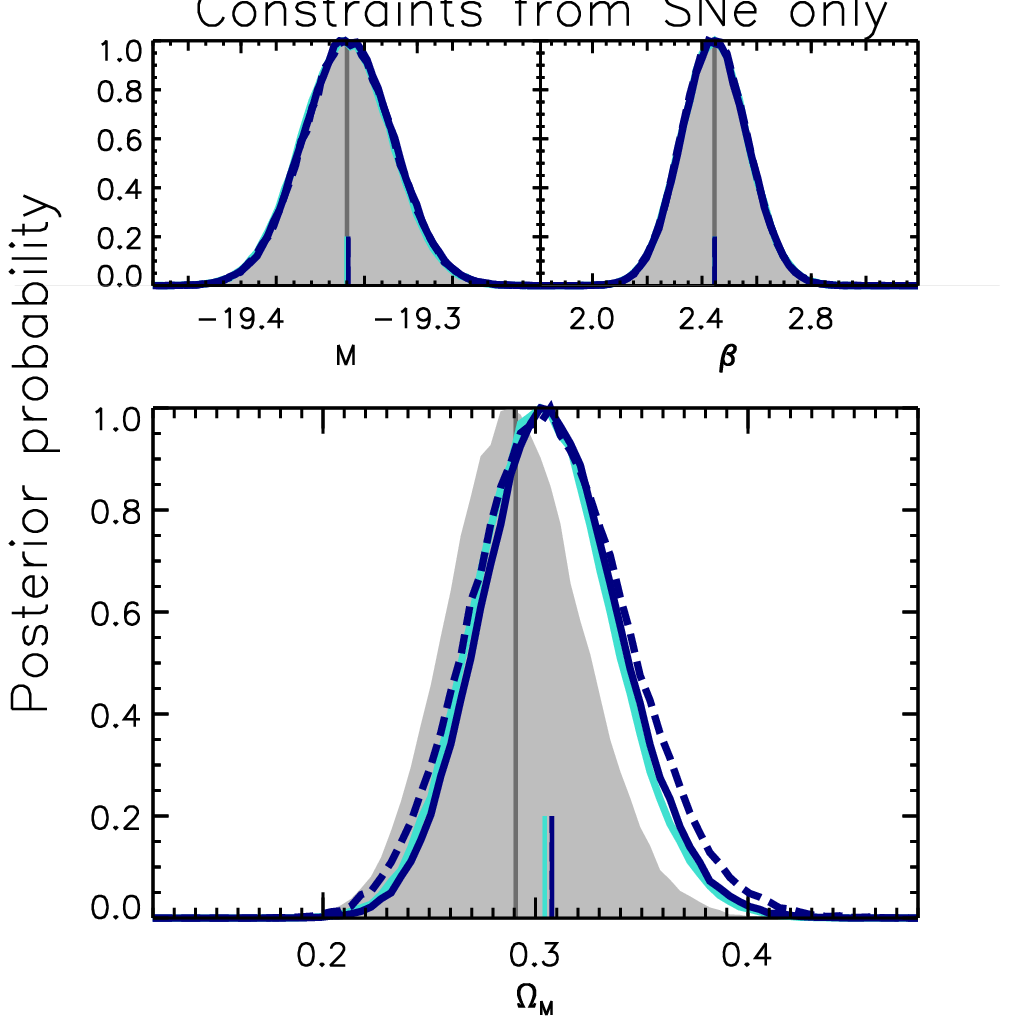
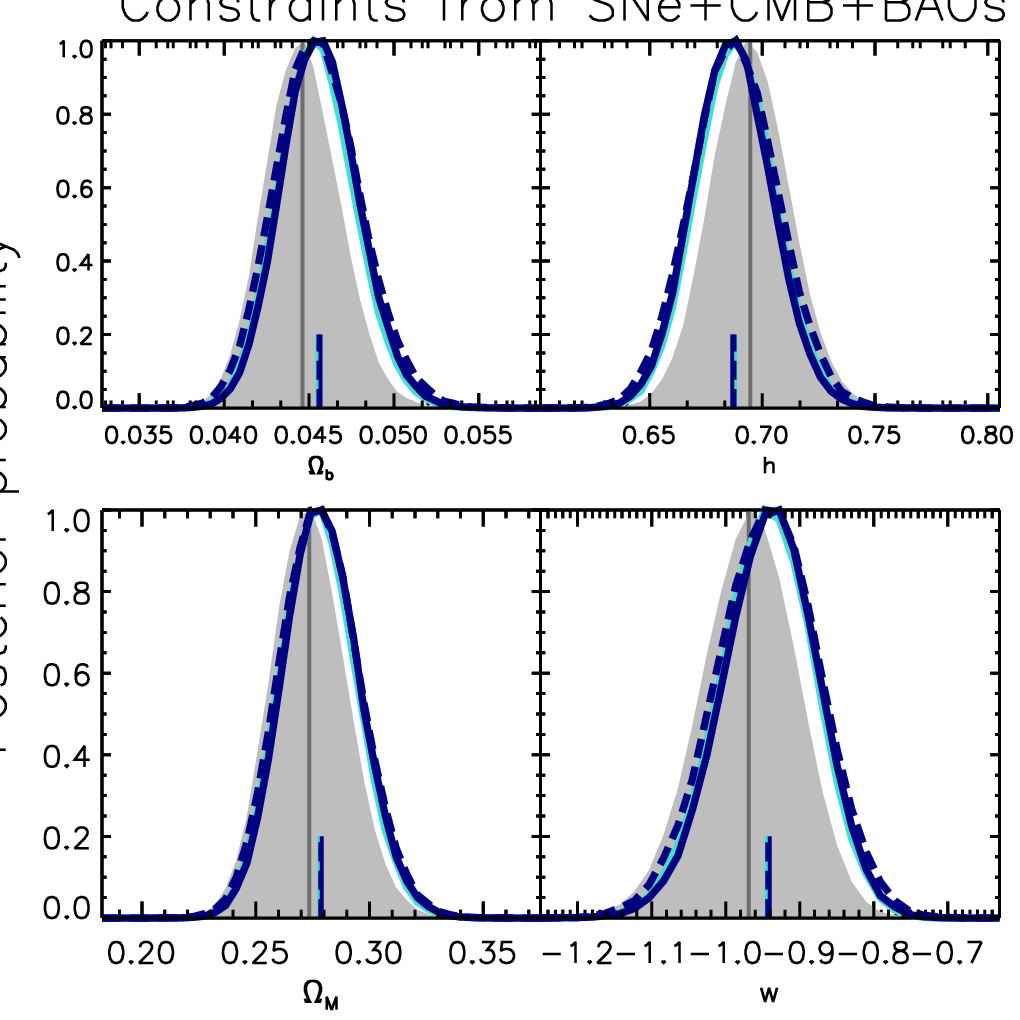
Using Equation 6, we sample the parameter space constrained by this dataset for two cosmological models, using an adaptive importance sampling algorithm called Population MonteCarlo (for more details, see Wraith et al. 2009)22 2 In Equation 6 the error for each supernova contains the covariance of (which depends on and ), an intrinsic absolute magnitude scatter of 0.15 and an additional uncertainty from peculiar velocities of 300 km s-1.. We first consider a flat CDM Universe using only constraints from the supernovae themselves. This allows us to estimate the constraints on , the latter three being the nuisance parameters intended to absorb the effects of the standard candle normalization. Our numerical values are presented in Table 1 and we show the posterior distributions of , and in Figure 2 with the gray histograms. Second, we consider a dark-energy model with constant equation of state . In order to obtain interesting constraints, we add data from the CMB (WMAP5 distance priors; Komatsu et al. 2008) and BAO (distance parameter measured with the SDSS; Eisenstein et al. 2005). The constraints on the parameters are given in Table 1 and we show the posterior distribution for , and and in Figure 3. In each case, we recover results similar to Kowalski et al. (2008).
2.3.1 Smooth dust component
After verifying that our method reproduces the current results, we can now turn our attention to including the effects of cosmic dust extinction. First, we consider the limiting case of a smooth cosmic dust component. Using the two estimates of the opacity of the Universe introduced above and (for now) ignoring measurement uncertainties, we can correct the apparent magnitude and the net color of each supernova for the expected effect of intergalactic dust extinction as a function of supernova redshift. In principle, such corrections should take into account the band used for each observation. In order to simplify our treatment we will however only consider the rest-frame -band, which corresponds to the observed -band at the average redshift, , i.e. the filter used for most of the supernovae in this sample. We then use these corrected magnitudes and calculate the constraints on cosmological parameters as done above.
The results of this calculation are shown in Figure 2 and Table 1. We first observe that the posterior distributions on , and are basically unchanged. The color-magnitude correction used to convert supernovae into standard candles is therefore not sensitive to the presence of a redshift-dependent cosmic extinction. This is expected as a smooth component has a minimal contribution to the scatter in magnitude and/or color to which is sensitive. However, the tilt induced in the Hubble diagram by a redshift-dependent cosmic extinction significantly affects the estimate of the matter density: , i.e. a change in amplitude. This corresponds to a systematic shift comparable to the statistical uncertainty. By comparison, estimates of the absolute magnitude and change by less than . When extending the cosmological model to a CDM (and adding constraints from CMB and BAO), we obtain the results shown in Figure 3. As with the CDM model, the best-fit values of , and remain unchanged (see Table 1), while the cosmological parameters are all biased to some extent. As shown in the Table, the offsets range from 0.25 to 0.45.
For a more realistic description of the properties of the intergalactic dust we can include the measurement error on . To do so, we add a Gaussian prior for to the with mean 4.9 and rms as indicated by M09. The results for the high- model are shown in Figures 2 & 3 using the dark-blue dashed lines. The uncertainty in propagates into the best-fit parameter uncertainties, yielding an increase in the width and skewness of the posterior distributions.
These results illustrate that with the current formalism being used to measure the luminosity distance from SNe Ia, the color-magnitude correction term does not properly account for a redshift-dependent cosmic dust extinction. The slope of the color-luminosity relation is not sensitive to such a reddening component. As a result, the formalism can only correct for a fraction of the extinction effect, as indicated in Eq. 11. Thus, instead of being absorbed by the nuisance parameters, such a component of dust impacts the value of cosmological parameters, resulting in offsets comparable to the current statistical errors on and .
|
2.3.2 Clumpy dust component
Since dust is expected to originate from galaxies, the extinction effects due to intergalactic dust should be related to the underlying density field. Hence, the dust contribution to the scatter in supernovae colors/magnitudes should reflect this correlation. Using a toy model we can investigate the expected impact of this effect on cosmological parameter estimation.
The number of halos intercepted by an average line-of-sight is given by
| (13) |
where and are the cross-section and number density of the galaxies responsible for most of the dust extinction. Assuming that the amount of dust is roughly proportional to luminosity and metallicity, M09 claim that most of the dust originates from galaxies with . They use and , with .
For a Poisson distribution, the level of fluctuation is simply . An upper limit on the extinction scatter due to intergalactic dust is then given by . This quantity is shown in the lower panel of Figure 1 for the two models of dust considered above. At , the average number of halos intercepted by a line-of-sight is of order ten and the scatter in is about 0.03 mag.
Comparing this quantity to the scatter in observed supernova magnitudes from the Union sample (data points), we see that the the level of scatter due to cosmic extinction ends up being significantly lower than the observed scatter in SN magnitudes. Therefore, this contribution is not expected to substantially affect the above constraints on cosmological parameters and leaves our previous conclusions unchanged.
3 Discussion and prospects
The current formalism used to correct the brightness of supernovae for color-magnitude trends assumes that all color-magnitude corrections can be parametrized by a unique (and therefore redshift independent) coefficient, . We have shown that in the presence of several sources of reddening this assumption may lead to a biased estimate of the intrinsic brightness of SNe and therefore their distance modulus. In addition, color excesses which do not add a significant scatter to the observed SNe Ia brightnesses end up affecting the value of cosmological parameters but leave the best-fit color-scaling parameter unchanged.
We have considered the effects of the intergalactic dust observed by M09 and applied a range of extinction corrections to the Union supernovae sample. We have shown that the reddening-based correction used in recent works is not sensitive to such an extinction contribution. As a result, it only corrects for a fraction of the extinction effect, and biases estimates of cosmological parameters. Considering several scenarios of extinction corrections as a function of redshift we found biases in and at a level ranging from 0.3 to 0.5 of current statistical errors.
While our analysis indicates a systematic limitation in the current formalism for standardizing SNe Ia, we remind the reader that the parameter estimates presented above rely on the value of the opacity of the Universe which remains poorly constrained, especially at high redshift. The quantitative results are based on reddening measurements around galaxies at , then extrapolated. Our analysis is therefore not meant to provide more robust cosmological parameter estimations, but only illustrates the fact that the statistical errors achieved by recent surveys are becoming comparable to systematic biasing due to extinction. Below we suggest a few means by which future surveys can reduce their exposure to this particular bias.
3.1 Minimizing the effect of dust extinction
Dust extinction effects weaken significantly when considering larger wavelengths. One can therefore minimize the amplitude of the bias discussed above by observing and estimating supernova magnitudes in redder bands. Planned surveys will satisfy this criterion:
- 1.
JDEM will provide us with observations of supernovae in rest-frame band. For dust with , the extinction effects are expected to be about two times weaker than those in band. According to Equation 5, the bias in will decrease to about 1%. More detailed calculations applying the extinction corrections to simulated JDEM data give about 0.5% (D. Rubin, private communication).
- 2.
For LSST (Ivezic et al., 2008) the reddest filters ( and ) should be sufficient for k-correcting to rest-frame band, which should yield roughly a 1.5% systematic error on from intergalactic dust using the current formalism.
In addition, if the photometry is accurate enough, it becomes possible to correct for reddening effects object-by-object. With photometry in three or more passbands and a supernova template, it is possible to estimate and for each object. Such an approach no longer requires the assumption of a unique slope of the supernova color-luminosity relation and might be favored in the future. As pointed out Wood-Vasey et al. (2007), there are currently only a few SNe Ia in the literature with the requisite high-precision photometry extending from the rest-frame UV to the near-IR, at .
3.2 Detecting and correcting for intergalactic dust extinction with SNe Ia
Similarly to searches for magnification effects (Ménard & Dalal, 2005), the contribution of dust extinction associated with foreground galaxies can in principle be detected using the supernovae themselves, by cross-correlating their observed colors with the density field of foreground galaxies:
| (14) |
where
| (15) |
and is the density of foreground galaxies measured within some aperture of size around a given supernova. Note that including higher-redshift galaxies would not bias the estimate but only add noise. Compared to the results presented in this paper, the advantage of such a measurement is to directly include the full redshift range from which dust extinction effects arise. Similarly, measuring this effect as a function of wavelength provides constraints on the coefficient relevant to the considered supernovae sample.
We now estimate the number of supernovae required for such a measurement. The above correlation is not sensitive to the mean reddening along lines-of-sight but only to fluctuations. The typical reddening excess due to intergalactic dust is given by , where is defined in Equation 13. Such a change will be induced to the mean color of supernovae lying behind the corresponding over/under-densities. The error on the estimate of the mean color of supernovae is given by , where is the scatter of observed supernova colors. Detecting such a quantity at the -level requires
| (16) |
At , and . For (see Figure 1), we find that supernovae are required to detect this effect at the 3 level. At , and , giving . Such detections might therefore be within reach, given the expected yields of the next generation of supernova surveys. Hence, the contribution of cosmic dust extinction can be corrected for, on average, as done in the present analysis. Note that . Therefore, better photometric accuracy would significantly reduce the number of required supernovae to detect the effects of intergalactic reddening.
We are also pointing out that once the mean reddening per galaxy has been estimated, it is possible to correct the supernova magnitudes object-by-object, by subtracting the expected amount of extinction given the number of foreground galaxies in the vicinity of each supernova. If the amplitude of intergalactic reddening is properly estimated, the correlation between foreground galaxy density and corrected supernova magnitudes should vanish. This provides a consistency check for the correction of cosmic dust. Such a test emphasizes the necessary interdependence of the large-scale structure and synoptic aspects of the next-generation surveys.
Acknowledgements
We thank David Rubin, Saul Perlmutter, Nao Suzuki, Pierre Astier, Eric Aubourg, Michael Wood-Vasey and Ray Carlberg for useful discussions and Marek Kowalski for providing us with the Union dataset.
References
- Aguirre (1999) Aguirre A., 1999, ApJ, 525, 583
- Aguirre et al. (2001) Aguirre A., Hernquist L., Schaye J., Katz N., Weinberg D. H., Gardner J., 2001, ApJ, 561, 521
- Avgoustidis, Verde, & Jimenez (2009) Avgoustidis A., Verde L., Jimenez R., 2009, arXiv, arXiv:0902.2006
- Bianchi & Ferrara (2005) Bianchi S., Ferrara A., 2005, MNRAS, 358, 379
- Bovy, Hogg, & Moustakas (2008) Bovy J., Hogg D. W., Moustakas J., 2008, ApJ, 688, 198
- Chelouche, Koester, & Bowen (2007) Chelouche D., Koester B. P., Bowen D. V., 2007, ApJ, 671, L97
- Corasaniti (2007) Corasaniti P. S., 2007, NewAR, 51, 332
- Dijkstra & Loeb (2009) Dijkstra M., Loeb A., 2009, arXiv, arXiv:0902.4703
- Eisenstein et al. (2005) Eisenstein D. J., et al., 2005, ApJ, 633, 560
- Garnavich et al. (1998) Garnavich P. M., et al., 1998, ApJ, 493, L53
- Inoue & Kamaya (2004) Inoue A. K., Kamaya H., 2004, MNRAS, 350, 729
- Ivezic et al. (2008) Ivezic Z., et al., 2008, arXiv, arXiv:0805.2366
- Jha, Riess, & Kirshner (2007) Jha S., Riess A. G., Kirshner R. P., 2007, ApJ, 659, 122
- Kilbinger et al. (2008) Kilbinger M., et al., 2008, arXiv, arXiv:0810.5129
- Komatsu et al. (2008) Komatsu E., et al., 2008, arXiv, arXiv:0803.0547
- Kowalski et al. (2008) Kowalski M., et al., 2008, ApJ, 686, 749
- Loeb & Haiman (1997) Loeb A., Haiman Z., 1997, ApJ, 490, 571
- Ménard et al. (2009) Ménard, B., Scranton, R., Fukugita, M., & Richards, G. 2009, arXiv:0902.4240
- Ménard & Dalal (2005) Ménard B., Dalal N., 2005, MNRAS, 358, 101
- More, Bovy, & Hogg (2008) More S., Bovy J., Hogg D. W., 2008, arXiv, arXiv:0810.5553
- Mörtsell & Goobar (2003) Mörtsell E., Goobar A., 2003, JCAP, 9, 9
- Muller et al. (2008) Muller S., Wu S.-Y., Hsieh B.-C., González R. A., Loinard L., Yee H. K. C., Gladders M. D., 2008, ApJ, 680, 975
- Perlmutter et al. (1998) Perlmutter S., et al., 1998, Nature, 391, 51
- Perlmutter & Schmidt (2003) Perlmutter S., Schmidt B. P., 2003, LNP, 598, 195
- Riess et al. (1998) Riess A. G., et al., 1998, AJ, 116, 1009
- Schmidt et al. (1998) Schmidt B. P., et al., 1998, ApJ, 507, 46
- Wood-Vasey et al. (2007) Wood-Vasey W. M., et al., 2007, ApJ, 666, 694
- Wraith et al. (2009) Wraith D., Kilbinger M., Benabed K., Cappé O., Cardoso J.-F., Fort G., Prunet S., Robert C. P., 2009, arXiv, arXiv:0903.0837
- Wraith et al. (2009) Wraith, D., Kilbinger, M., Benabed K., Cappé, O. et al., 2009, A&A, to be submitted
- York et al. (2000) York D. G., et al., 2000, AJ, 120, 1579
- Zhang (2008) Zhang P., 2008, ApJ, 682, 721