A VLT VIMOS study of the anomalous BCD Mrk 996: mapping the ionised gas kinematics and abundances†
Abstract
A study of the blue compact dwarf (BCD) galaxy Mrk 996 based on high resolution optical VLT VIMOS integral field unit spectroscopy is presented. Mrk 996 displays multi-component line emission, with most line profiles consisting of a narrow, central Gaussian (FWHM110 km s-1) with an underlying broad component (FWHM400 km s-1). The broad H i Balmer component splits into two separate broad components inside a 1′′.5 radius from the nucleus; these are attributed to a two-armed mini-spiral. This spiral-like nucleus rotates in the same sense as the extended narrow-line ionised gas but is offset by 50 km s-1 from the systemic velocity of the galaxy. The rotation curve of Mrk 996 derived from the H narrow component yields a total mass of 5108M⊙ within a radius of 3 kpc. From the H luminosity we infer a global star formation rate of 2 M⊙ yr-1.
The high excitation energy, high critical density [O iii] 4363 and [N ii] 5755 lines are only detected from the inner region and exist purely in broad component form, implying unusual excitation conditions. Surface brightness, radial velocity, and FWHM maps for several emission components are presented. A separate physical analysis of the broad and narrow emission line regions is undertaken. We derive an upper limit of 10,000 K for the electron temperature of the narrow line gas, together with an electron density of 170 cm-3, typical of normal H ii regions. For the broad line component, measured [O iii] and [Fe iii] diagnostic line ratios are consistent with a temperature of 11,000 K and an electron density of 107 cm-3. The broad line emission regions show N/H and N/O enrichment factors of 20 relative to the narrow line regions, but no He/H, O/H, S/H, or Ar/H enrichment is inferred. Previous studies indicated that Mrk 996 showed anomalously high N/O ratios compared with BCDs of a similar metallicity. Our multi-component analysis yields a revised metallicity of 0.5 Z⊙(12log O/H 8.37) for both the narrow and broad gas components, significantly higher than previous studies. As a result the narrow line region’s N/O ratio is now typical for the galaxy’s metallicity. The narrow line component’s N/O ratio peaks outside the core region, spatially correlating with 3 Myr-old stellar populations. The dominant line excitation mechanism is photoionisation by the 3000 WR stars and 150,000 O-type stars estimated to be present in the core. This is indeed a peculiar BCD, with extremely dense zones of gas in the core, through which stellar outflows and possible shock fronts permeate contributing to the excitation of the broad line emission.
Keywords:
galaxies: abundances – galaxies: individual (Markarian 996)– galaxies: kinematics and dynamics – galaxies: starburst – stars: Wolf-Rayet – galaxies: dwarf1 Introduction
Blue Compact Dwarf (BCD) galaxies provide a means of studying chemical evolution and star formation in low metallicity environments in the nearby Universe. In general BCDs are faint (MB 18), have blue optical colours, are typically small (1 kpc) and are thought to be experiencing bursts of star formation in relatively chemically un-evolved environments, ranging from 1/2–1/50 solar metallicity (Kunth & Östlin, 2000), and are therefore good analogues to high redshift star forming galaxies.
The current study focuses on Markarian 996, a BCD whose properties are far from ordinary. Thuan et al. (1996) (TIL96 hereafter) presented a comprehensive HST study of Mrk 996 by analysing FOS UV and optical spectra and WFPC2 - and -band imaging. Their HST -band image, shown in Figure 1, revealed that the majority of the star formation in Mrk 996 occurs within a bright, compact nuclear H ii region of 3 arcsec angular radius (315 pc for their adopted distance of 21.6 Mpc (TIL96)) surrounded by an extended elliptical low surface brightness component of 40.6 arcsec diameter. However, the remarkable nature of the galaxy was exposed by the small-aperture (1 arcsec) FOS spectra obtained from the nucleus of Mrk 996. Line widths increase with the degree of ionisation; lines from singly ionised species being narrow and typical of H ii regions whereas lines from ions such as O2+ and Ne2+ are very broad, with FWHM widths up to 900 km s-1 (TIL96). Un-physically high [O iii] electron temperatures are derived for the nucleus unless an electron density () of at least cm-3 is adopted, several orders of magnitude higher than normal H ii region electron densities (Izotov et al., 1994). In order to account for the observed line intensities, TIL96 applied a two-zone density-bounded H ii region model, with an inner core density of cm-3 and an outer zone with a density of cm-3. They suggested that this large density gradient is caused by a mass outflow driven by the large population of Wolf-Rayet stars found to be present in the galaxy.
Elemental abundances were also derived by TIL96, who estimated a metallicity of 0.22 Z⊙, based on the abundance of oxygen. As a result of their study, Mrk 996 was placed in a small group of eight BCDs known to display a significant overabundance of nitrogen (Pustilnik et al., 2004), with derived N/O ratios that are 0.3–1.4 dex higher than for other BCDs of similar oxygen abundances. The enhanced nitrogen within this group has been suggested by Pustilnik et al. (2004) to be connected with merger events, in particular with a short phase of the consequent starburst, when many WR stars contribute to the enrichment of the interstellar medium (ISM). This was certainly the case for NGC 5253 (thought to be interacting with its companion galaxy NCG 5236 (Moorwood & Glass, 1982)), where spatially resolved N/H and N/O enhancements were observed by Walsh & Roy (1987) to correlate strongly with WR star signatures. In support of this, a correlation was also found between spatial enhancements of He/H and N/O, attributed to helium enrichment of the ISM by WR stars (Walsh & Roy, 1989).
The study of TIL96 showed that Mrk 996 has spatially varying physical properties. Spatially resolved kinematic and chemical abundance information across the galaxy is therefore crucial for understanding the nature of this system; such information can be readily obtained with integral field spectroscopy (IFS). In this paper we present high resolution optical IFS observations obtained with the VIMOS integral field unit (IFU) spectrograph on the 8.2m Very Large Telescope UT3/Melipal. The data afford us a new spatiokinematic ‘3-D’ view of Mrk 996. The spatial and spectral resolution achieved allows us to undertake a full multi-velocity-component analysis of this system, ultimately providing a more complete picture of its diverse ionised ISM.
We adopt a distance of 22.3 Mpc for Mrk 996, at a redshifted velocity of 1642 km s-1 (corresponding to 0.00544, this work), using a Hubble constant Ho 73.5 km s-1 Mpc-1 (DeBernardis et al., 2008).

2 VIMOS IFU Observations and Data Reduction
2.1 Observations
Two data sets were obtained with the Visible Multi-Object Spectrograph (VIMOS) IFU at the 8.2m VLT at ESO’s Paranal Observatory in Chile. The VIMOS IFU consists of 6400 (8080) fibres coupled to microlenses and operates with four CCD detectors yielding four spectral and spatial quadrant samplings (Zanichelli et al., 2005). The spatial sampling is contiguous, with the dead space between fibres below 10 per cent of the inter-fibre distance. The data sets were taken with the high resolution and high magnification (i.e. a partially masked IFU head containing only 4040 fibres) settings of the IFU, resulting in a field-of-view (FoV) of 13′′ 13′′ covered by 1600 spatial pixels (spaxels) at a spatial sampling of 0.33′′ per spaxel. Two different grisms were used, high resolution blue (HRblue, 0.51 Å/pixel), covering 4150–6200 Å and high resolution orange (HRorange, 0.60 Å/pixel) covering 5250–7400 Å; spectra from both grisms are illustrated in Fig 2. The instrumental width delivered by the IFU HRblue and HRorange grisms was measured using arc lamp exposures. Gaussian profiles were fitted to a number of isolated lines within each extracted arc spectrum and were found to have FWHMs of 2.3 0.1 Å (113.5 4.9 km s-1) and 1.5 0.1 Å (72.3 4.8 km s-1) for the HRblue and HRorange grisms, respectively.
The observing log can be found in Table 1. Four exposures were taken per grism. The third exposure within each set was dithered by 0.34′′ in RA and by 0.58′′ in Dec (corresponding to a 2 spaxel offset in the -direction) in order to remove any dead fibres when averaging exposures. All observations were taken at a position angle of 30∘.
2.2 Data Reduction
The data reduction was carried out using the GUI-based pipeline software gasgano11 1 http://www.eso.org/sci/data-processing/software/gasgano that allows the user to organise calibration files and run pipeline tasks. Three main tasks were used: (1) vmbias created the master bias frame; (2) vmifucalib determined the spectral extraction mask, wavelength calibration and the relative fibre transmission correction; (3) vmifustandard created flux response curves from a summed spectrophotometric standard star spectrum. Finally, the products of these tasks were fed into vmifuscience which extracted the bias-subtracted, wavelength- and flux-calibrated, and relative fibre transmission-corrected science spectra. Each VIMOS CCD quadrant is an independent spectrograph, therefore the IFU data processing was performed separately on each quadrant, creating four fully calibrated 3-D arrays per science exposure. The flux calibration was performed by multiplying the 2-D spectral frame for each quadrant by its relative response curve, derived from standard star observations in the same filter, grism and quadrant. The final data cube is produced by median-combining each exposure in a jitter sequence (i.e. re-aligning the dithered exposure with the other exposures of identical pointing), after all the individual data quadrants for each exposure had been reduced. Reconstructing the cube spatially utilises the IFU table that lists the one-to-one correspondence between fibre positions on the IFU head and stacked spectra on the CCD (Bastian et al., 2006). A schematic representation of the data reduction processes can be found in Zanichelli et al. (2005).
| Observation ID | Date | Grism | Exp. time (s) | Airmass range | FWHM Seeing (arcsec) |
|---|---|---|---|---|---|
| 250520 | 13/10/2006 | HR blue | 4 402 | 1.135 – 1.097 | 0.72 |
| 250516 | 19/10/2006 | HR orange | 4 372 | 1.057 – 1.053 | 1.15 |
Unlike other IFU designs (such as VLT FLAMES/Argus), there are no ‘sky-dedicated’ fibres in VIMOS IFU mode. Sky subtraction was performed by locating a background region within each quadrant, summing the spectra over each of the spaxels in the reconstructed cube and subtracting the median sky spectrum of the region from its corresponding quadrant. Median combining was needed to ensure that any residual contamination from faint objects was removed. It should be noted that VIMOS IFU images are obtained as projections on the IFU CCD, i.e. they are mirror images to what is seen on the sky. Thus, all emission maps presented in this paper have been reflected about the -axis to obtain the correct orientation.

2.3 Emission Line Profile Fitting
The resolving power and signal-to-noise (S/N) of the data are high enough to allow the resolution of multiple components in the majority of the emission lines seen in the 1600 spectra across the FoV. In order to fit spectra of this quantity and complexity, we utilised an automated fitting procedure called PAN (Dimeo, 2005, Peak ANalysis; ). This IDL-based, general-purpose curve-fitting package was adapted by Westmoquette et al. (2007a) for use with FITS format data by allowing multiple spectra to be read simultaneously in an array format. The user can interactively specify initial parameters of a spectral line fit (continuum level, line peak flux, centroid and width) and allow PAN to sequentially process each spectrum, fitting Gaussian profiles accordingly. The output consists of the fit parameters for the continuum and each spectral line’s profile and the value for the fit.
It was found that in the spectra of Mrk 996 most high S/N ratio emission line profiles consist of a strong, narrow central Gaussian component (hereafter C1), superimposed on a very broad component containing a substantial proportion of the flux (hereafter C2). In addition to this, in the core of the galaxy the C2 component of the Balmer line profiles splits into two broad Gaussians of variable strength and velocity (hereafter C3 and C4, shifted towards the blue and red of the centroid of C1, respectively). The splitting of C2 into C3 and C4 and the region in which this occurs is discussed in Section 3.2. Fig 3 shows examples of fits to the H emission line from different regions of Mrk 996 in order to illustrate single, double and triple Gaussian fits, along with the corresponding fit residuals. In the same figure a double Gaussian fit to the [O iii] 5007 profile is also shown corresponding to the same central spaxel for which H requires a triple Gaussian fit, thus illustrating the difference between the H and [O iii] line profiles. Where appropriate, single or multiple Gaussians were fitted to the emission line profiles, restricting the minimum FWHM to be the instrumental width. Suitable wavelength limits were defined for each emission line and continuum level fit. Further constraints were applied when fitting the [S ii] doublet: the wavelength difference between the two lines was taken to be equal to the redshifted laboratory value when fitting the velocity component, and their FWHMs were set equal to one another.
In order to rigorously determine the optimum number of Gaussians required to fit each observed profile the statistical F-test was used. The F-distribution function allows one to calculate the significance of a variance () increase that is associated with a given confidence level, for a given number of degrees of freedom. We note that even though many low S/N ratio lines may in reality be composed of multiple emission components, it is often not statistically significant to fit anything more than a single Gaussian. This is why the robust F-test method was chosen for objectively determining the optimum number of components to fit to each line. Resultant optimised fits for various line species are as follows:
Single narrow Gaussian (i.e. C1 component only) – [Fe iii] 4658, 4702, 4881, 4986, [O i] 6300, 6364, [N ii] 6584, [S ii] 6717, 6731, and [O ii] 7320, 7330.
Single broad Gaussian (i.e. C2 component only) – [N ii] 5755, [O iii] 4363.
Double narrow/broad Gaussian (C1 and C2) – all Balmer lines (excluding the central spaxels), He i 4471, 5876, 6678, 7065, [O iii] 4959, 5007, [S iii] 6312, and [Ar iii] 7136.
Triple narrow/broad Gaussian fit (C1, C3, and C4) – all Balmer lines (central spaxels only).
The errors reported by PAN during fitting underestimate the true uncertainties. We thus follow an error estimation procedure which involves the visual re-inspection of the line profile plus fit after knowing which solution was selected by our tests, and taking into account the S/N ratio of the spectrum. The errors on the fits are minimised across the IFU’s aperture varying S/N ratio during the F-testing procedure by selecting the number of components which best-fit the profile within that particular spaxel. It is further noted that the uncertainties associated with each individual line component are coupled to those of the other components within a given line profile. By comparing PAN fits to those performed by other fitting techniques (e.g. iraf’s splot task) on line profiles with an established configuration (i.e. after performing the F-test) we find that uncertainties of 5–10 and 15–20 per cent are associated with the C1 and C2–4 fits, respectively. A listing of measured flux and FWHM uncertainties appears in Table 2, where errors are quoted for individual component fits to emission lines detected on integrated spectra across the inner and outer regions of Mrk 996.

2.4 Cube alignment and correction for differential atmospheric refraction
Observations of an object’s spectrum through the Earth’s atmosphere are subject to refraction as a function of wavelength, known as differential atmospheric refraction, DAR. The direction of DAR is along the parallactic angle at which the observation is made. Each reduced data cube was corrected for this effect using the algorithm outlined by Walsh & Roy (1990); this procedure calculates fractional pixel shifts for each monochromatic slice of the cube relative to a fiducial wavelength (i.e. a strong emission line), shifts each slice with respect to the orientation of the slit on the sky and the parallactic angle and re-combines the DAR-corrected data cube. Having data cubes with different wavelength ranges would ideally involve a choice of fiducial wavelength that is common to both, e.g. He i 5876 for these VIMOS data. However, the S/N ratio of this line is not consistently high across the IFU aperture, and pixel shifts for each cube relative to this line were found to be unreliable. Instead, we chose to correct each data cube using its strongest emission line: H for the HRblue cube and H for the HRorange cube. The two cubes were then spatially matched by aligning the H and H emission contours using a 2-D Gaussian fit. This involved a maximum shift of 0.73 spaxels in and 0.82 spaxels in . Two effects can introduce minor errors when aligning monochromatic H i images: (i) an extinction gradient across the observed region disproportionately affecting the two lines, and (ii) the presence of a temperature gradient, since the H i lines have a very slightly different temperature dependence. However, both gradients would need to be significant for substantial errors to be introduced; the sub-spaxel shifts that were determined show that this is not the case here.
| Core Region | Outer Region | ||||||
|---|---|---|---|---|---|---|---|
| Line ID | Component | FWHM (km s-1) | () | () | FWHM (km s-1) | () | () |
| 4340 H | C1 | 145.1 2.1 | 44.9 0.5 | 46.3 0.4 | 158.2 6.2 | 54.4 8.7 | 63.2 2.2 |
| 4340 H | C2 | 442.2 15.9 | 42.6 1.3 | 48.2 1.4 | – | – | – |
| 4363 [O iii] | C2 | 476.5 14.4 | 20.2 0.5 | 32.9 0.8 | – | – | – |
| 4471 He i | C1 | 155.6 14.8 | 3.8 0.6 | 3.9 0.6 | 260.2 91.2 | 9.7 2.9 | 10.8 2.8 |
| 4471 He i | C2 | 540.6 61.0 | 9.8 1.0 | 10.7 1.1 | – | – | – |
| 4658 [Fe iii] | C1 | 277.5 27.7 | 3.3 0.2 | 3.3 0.5 | – | – | – |
| 4702 [Fe iii] | C1 | 274.3 53.0 | 0.7 0.4 | 0.7 0.4 | – | – | – |
| 4861 H | C1 | 130.8 0.6 | 100.0 1.0 | 100.0 0.7 | 133.9 0.6 | 100.0 22.0 | 100.0 15.6 |
| 4861 H | C2 | 414.7 4.3 | 100.0 1.5 | 100.0 1.0 | 308.5 6.2 | 100.0 21.5 | 100.1 15.2 |
| 4881 [Fe iii] | C1 | 313.4 94.6 | 1.0 0.4 | 1.0 0.4 | – | – | – |
| 4959 [O iii] | C1 | 131.2 0.6 | 132.2 1.3 | 131.7 0.9 | 137.91.75 | 113.1 2.3 | 109.9 2.2 |
| 4959 [O iii] | C2 | 392.0 10.3 | 49.3 1.4 | 48.2 1.3 | 332.7 3.6 | 58.32 14.8 | 55.4 14.08 |
| 4986 [Fe iii] | C1 | 210.5 54.8 | 1.5 0.6 | 1.5 0.6 | – | – | – |
| 5007 [O iii] | C1 | 132.4 0.6 | 399.6 4.2 | 397.1 3.2 | 130.6 0.6 | 347.7 54.3 | 333.4 2.5 |
| 5007 [O iii] | C2 | 415.2 13.8 | 148.8 4.7 | 143.8 4.3 | 404.4 38.9 | 133.9 24.1 | 124.3 11.9 |
| 5755 [N ii] | C2 | 427.9 74.5 | 3.3 0.4 | 4.0 0.5 | – | – | – |
| 5875 He i | C1 | 121.5 2.5 | 11.3 0.4 | 10.7 0.4 | 147.0 8.7 | 19.6 3.2 | 15.2 0.7 |
| 5875 He i | C2 | 425.8 8.2 | 33.4 0.7 | 27.2 0.5 | – | – | – |
| 6300 [O i] | C1 | 128.0 13.8 | 4.6 0.4 | 4.3 0.4 | 141.9 22.9 | 7.6 1.5 | 5.4 0.7 |
| 6312 [S iii] | C1 | 107.4 13.8 | 1.2 0.2 | 1.2 0.2 | 133.0 31.8 | 3.8 0.8 | 2.7 0.4 |
| 6312 [S iii] | C2 | 403.0 29.0 | 5.8 0.4 | 4.4 0.3 | – | – | – |
| 6363 [O i] | C1 | 153.2 20.3 | 1.7 0.2 | 1.6 0.2 | 147.5 38.2 | 4.0 1.1 | 2.9 0.6 |
| 6563 H | C1 | 116.5 0.9 | 306.9 4.4 | 285.6 3.6 | 118.8 0.4 | 418.9 65.3 | 287.6 1.6 |
| 6563 H | C2 | 420.5 7.3 | 400.5 7.5 | 294.0 4.6 | 407.7 9.6 | 555.5 85.3 | 284.2 0.8 |
| 6584 [N ii] | C1 | 126.2 4.1 | 38.0 1.1 | 35.3 1.0 | 123.4 2.2 | 45.4 7.1 | 31.1 0.4 |
| 6678 He i | C1 | 112.7 4.9 | 3.5 0.2 | 3.2 0.2 | 124.8 14.8 | 6.8 1.3 | 4.6 0.5 |
| 6678 He i | C2 | 550.3 28.8 | 9.2 0.4 | 6.6 0.3 | – | – | – |
| 6717 [S ii] | C1 | 118.8 1.8 | 30.9 0.5 | 28.6 0.5 | 117.4 2.2 | 31.6 5.0 | 21.2 0.4 |
| 6731 [S ii] | C1 | 118.5 1.8 | 24.6 0.5 | 22.8 0.4 | 117.2 2.2 | 22.4 3.5 | 14.9 0.4 |
| 7065 He i | C1 | 76.00 65.4 | 1.1 0.9 | 1.0 0.8 | 217.8 56.1 | 7.0 1.9 | 4.4 1.0 |
| 7065 He i | C2 | 425.4 58.2 | 24.4 2.8 | 16.8 1.9 | – | – | – |
| 7136 [Ar iii] | C1 | 127.3 17.2 | 10.3 2.3 | 9.4 2.1 | 127.8 11.4 | 13.5 2.3 | 8.5 0.7 |
| 7136 [Ar iii] | C2 | 441.0 213.9 | 8.2 3.5 | 5.6 2.4 | – | – | – |
| 7320 [O ii] | C1 | 176.6 11.9 | 6.1 0.3 | 5.6 0.3 | 219.2 62.3 | 9.2 2.3 | 5.6 1.1 |
| 7330 [O ii] | C1 | 165.3 11.9 | 5.8 0.3 | 5.3 0.3 | 111.3 21.3 | 10.8 2.2 | 6.6 0.8 |
| (H) | C1 | 0.100.02 | 0.510.08 | ||||
| (H) | C2 | 0.420.04 | 0.910.12 | ||||
| (H) | C1 | 626.304.31 | 180.3328.13 | ||||
| (H) | C2 | 431.704.46 | 36.675.57 | ||||
3 Mapping of line fluxes and kinematics
3.1 Line fluxes and reddening correction
Full HRblue and HRorange spectra are shown in Fig 2, with identified emission lines labelled. Table 2 lists the measured FWHM and observed and de-reddened fluxes for the main velocity components of the detected emission lines. The fluxes are from spectra summed over the core region and the outer annulus region, as defined in Section 3.4, and are quoted relative to the flux of the corresponding H component. They were corrected for reddening using the Galactic reddening law of Howarth (1983) using (H) values derived from the H/H and H/H line ratios of their corresponding components, weighted in a 3:1 ratio, respectively, in conjunction with the theoretical Case B ratios from Hummer & Storey (1987). Following the same method, an average (H) map was also derived using ratioed H/H and H/H emission line maps. The (H) map was used for correcting emission line maps for reddening in order to then create abundance maps. In the direction to Mrk 996 a foreground Milky Way reddening of () 0.04, corresponding to (H) 0.06, is indicated by the extinction maps of Schlegel et al. (1998). Values of (H) of 0.100.02 and 0.510.08 are applicable to the narrow component emission in the inner and outer regions of Mrk 996, respectively, while values of 0.420.04 and 0.910.12 are applicable to the broad component emission for the inner and outer regions, respectively.
3.2 The Balmer line properties

All the Balmer lines detected from Mrk 996 (H, H and H) show a common multi-component velocity structure which in the innermost spaxels is exclusive to the Balmer lines, i.e. it is not seen in the forbidden lines. Here we present a discussion of the highest S/N ratio H i line, H. Maps of the individual H velocity components (flux, radial velocity and FWHM) are shown in Fig 4. As mentioned previously, up to three components are resolved in the H line profile in the nuclear region of Mrk 996:
(i) A central, narrow Gaussian (C1) is detected throughout the galaxy (see the flux map in Fig 4a), peaking at , (J2000), with a surface brightness of 10.110-12 erg cm-2 s-1 arcsec-2 in the central region, and gradually decreasing over a region with a major axis radius of 3′′.84 (403 pc) and a minor axis of 2′′.39 (251 pc); beyond this the H emission traces a very low surface brightness area (which TIL96 fitted with an exponential disk on their HST images). The galaxy does not show a smooth elliptical shape when viewed in H. Fig 1 shows the flux contours of the narrow H component (C1) overlaid on the HST F569W (V-band) image. The H emitting region imaged by VIMOS is mostly confined within the inner part of the F569W image but the major axes of the two are not aligned. A dust extinction feature is present in the north-west section of the inner star forming region that distorts the F569W flux isophotes (TIL96). The dust feature also distorts the outermost H contours of the VIMOS data.
(ii) In the very core of Mrk 996, over an area of 1′′.5 in radius (162 pc), the narrow C1 profiles are accompanied by broad underlying components that are best fit with two Gaussians (C3 and C4) to the blue and red of C1, respectively (Fig 4a). The significance of these features is discussed below.
(iii) Beyond a radius of 1′′.5 from the core, C3 and C4 blend into a single broad Gaussian (C2) (Fig 4a). The region over which this component is seen is 2–4 arcsec in radius (216–432 pc); its outer boundary matches well that of the brightest portion of the C1 flux map.

The radial velocity map of component C1 (Fig 4b) shows a strong velocity gradient from west to east, with a definable axis of rotation at PA (marked by the dashed line across the C1 velocity map). Neither the rotation axis as revealed by VIMOS nor the axis normal to it are aligned with the apparent, i.e. photometric, major axis of the galaxy which lies at PA (TIL96). A velocity gradient in approximately the same direction is observed in the broad component C2, although in this case the negative velocity component is not exactly balanced by a positive counterpart. Fig 5 shows position-velocity (P-V) diagrams along the adopted axis of rotation (Fig 5a) and also perpendicular to this axis (Fig 5b). A new estimation of the heliocentric systemic velocity of Mrk 996 can be made using Fig 5a; a radial velocity of 1642 10 km s-1 is needed to normalize the distribution of C1 velocities along the axis of rotation to zero (cf. the 1622 10 km s-1 estimate of TIL96). The narrow line component C1 shows a velocity gradient along the direction normal to the rotation axis, with radial velocities ranging from 50 km s-1 to 50 km s-1, and the P-V diagram of component C1 shows a linear velocity gradient indicating solid-body rotation (Fig 5b). This type of structure is not uncommon for BCDs observed in the H i 21 cm line and has been used by van Zee et al. (2001) to constrain evolutionary scenarios.
Assuming a Keplerian velocity profile we have converted each radial velocity data point of component C1 (Fig 5b) into a mass within radius , as shown in Fig 6. This plot shows dynamical mass growing at similar rates on either side of the centre, rising to a total mass of 1108M⊙ within a radius of 0.75 kpc. This is in good agreement with the total mass of 4.3 M⊙ estimated by TIL96 from H i emission features detected by Thuan et al. (1995). It should be noted that all previous kinematical studies of BCDs have been based on H i 21 cm observations (van Zee et al., 2001; Thuan et al., 2004).
The broad line component C2 also shows a velocity gradient roughly perpendicular to the rotation axis, (Fig 5b), aligned more closely with the major axis of Mrk 996, with radial velocities that merge with those of C1 2′′ from the centre of the galaxy, but extending to larger negative values. No definite velocity structure can be seen along this axis for the C3 and C4 components; however, these show an opposing velocity gradient along the galaxy’s rotation axis (Fig 5a). Their radial velocities lie much higher at 60 to 160 km s-1 for C3 and 110 to 210 km s-1 for C4, with the gradients in both showing a similar ‘S’ shape offset by 1′′ from the dynamical centre of Mrk 996. It is further noted that the velocity centre of symmetry of the ‘S’ feature is offset by 50 km s-1 from the heliocentric systemic velocity of Mrk 996 measured above. The ‘S’ kinematic feature can be attributed to a two-arm spiral structure located at the nucleus of Mrk 996, whose approaching and receding arms are respectively traced by the velocity distribution of the C3 and C4 components of H. Furthermore, our analysis reveals that the projected angular velocity vectors on the plane of the sky of the spiral and of the gas traced by the C1 narrow line component are at an angle of 90∘. In their WFPC2 images of Mrk 996, TIL96 identified a small spiral structure along the east-west direction (see their fig 4b) whose pivot is the nuclear star-forming region which is slightly offset from the centre of the outermost F791W image isophotes. The pivot of the spiral and the peak flux position on the VIMOS H C1 map coincide spatially. The 1′′ offset mentioned above for the spatial centre of symmetry of the ‘S’ feature (Fig 5a) is consistent with the asymmetry noted by TIL96. This fact, along with the 50 km s-1 offset of the spiral’s pivot with respect to the systemic velocity of the galaxy, indicates that the spiral-like nucleus of Mrk 996 is kinematically decoupled to some degree from the main ionised gas component. This could indeed be the fossil kinematic signature of a past merger event.
The FWHMs of C1–4 in H are shown in Fig 4c, corrected for the instrumental PSF (see Section 2.2). A peak in the FWHM of the narrow C1 component, 110 km s-1, is seen at the nucleus of Mrk 996. This gradually, but not uniformly, decreases to 65 km s-1 towards the outer regions. The gradient in the FWHM of C2 is far stronger, peaking at 450 km s-1 at two positions northwest and southest of the nucleus and decreasing to 100 km s-1 elsewhere: the broader line widths along the former direction could be the signature of an expanding shell surrounding the inner star forming region, blown outwards by the stellar winds of the core cluster. Higher resolving power IFU spectroscopy is needed to disentangle the kinematics of this region. No significant gradient is seen in the FWHM of components C3 and C4, both remaining between 200–300 km s-1.

3.3 The [O iii] nebular line properties
As mentioned previously, the structure of the H i Balmer lines is not mirrored in the forbidden nebular lines. All the strong forbidden lines (with the exception of [O iii] 4363 and [N ii] 5755 discussed below) are comprised of a narrow, central Gaussian (C1) with an underlying single broad Gaussian component (C2). An optimal fit, after applying the rigorous statistical F-test to a spaxel from the core of Mrk 996, can be seen in Fig 3f. For the spaxels in which the Balmer components C3 and C4 are detected, the FWHM of the [O iii] 5007 C2 component is 390–415 km s-1 and that of each of H C3 and C4 is 180–240 km s-1. The occurrence of additional C3-4 components in the Balmer lines is in contrast to the non-occurrence of C2 splitting in the [O iii] nebular lines and can perhaps be ascribed to a lower S/N ratio for the broad component of [O iii] 4959, 5007 compared to the C2 of H i lines: the observed C2/C1 flux ratios pertaining to the [O iii] nebular lines in the inner core of Mrk 996 (as defined in the following subsection) are half of those observed in the H i lines (Table 2). However, from our analysis of the broad C2 component, we find log (/cm-3) 7.25 0.25 from the [O iii] lines (Section 4). This is high enough to collisionally suppress 5007+4959 whose critical density for de-excitation is 6.4105 cm-3. The distribution of flux in the C1 and C2 components of the [O iii] 5007 line is shown in Fig 7. The shape and extent of the emitting regions are similar to those of the corresponding H C1 and C2 components.
3.4 Broad emission lines: [O iii] 4363 and [N ii] 5755


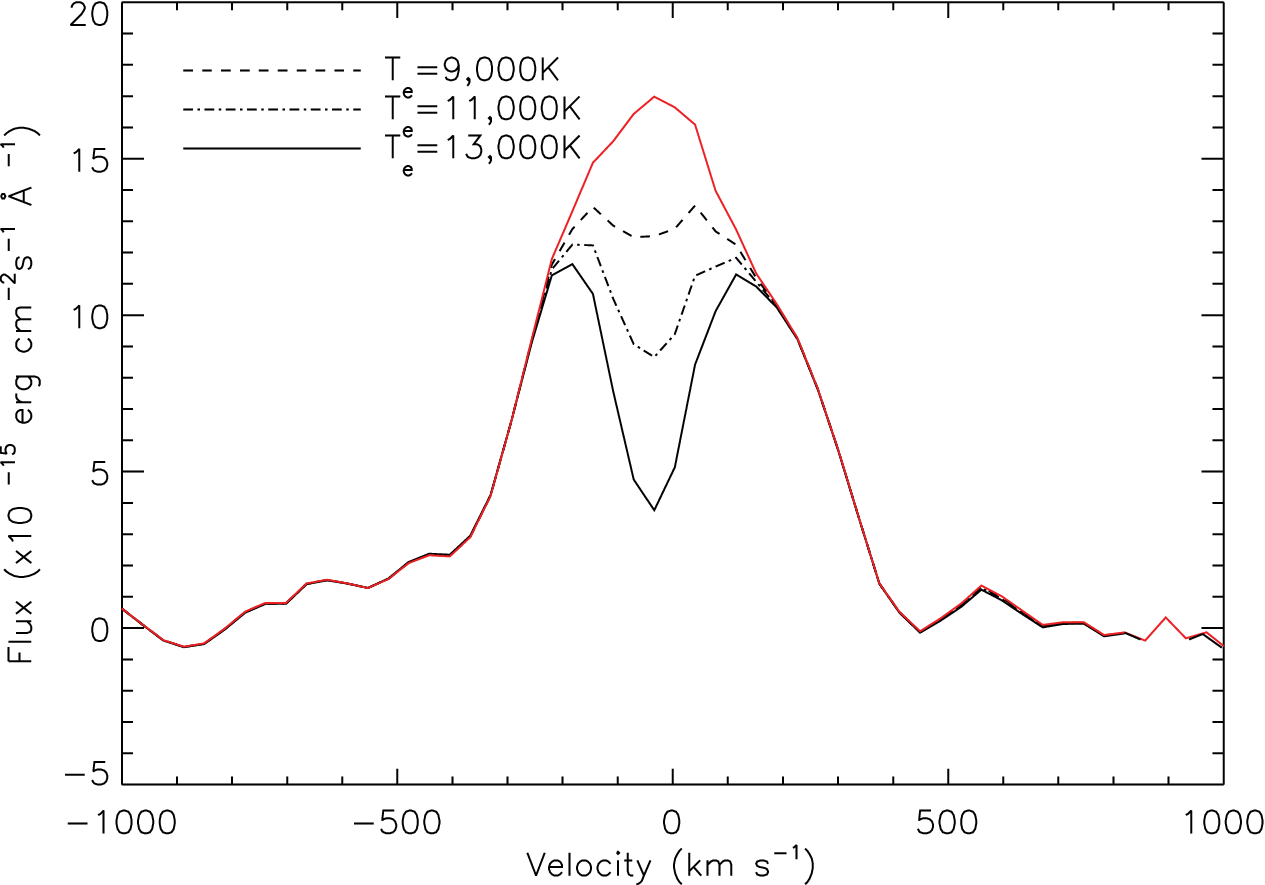
Our multi-component line analysis shows that only the broad (C2) components of the auroral [O iii] 4363 and [N ii] 5755 transitions are present, and only in the inner galaxy. The implications of this for the use of [O iii] 4363 as a temperature diagnostic are discussed in Section 4. For the purpose of this study the 4363 spectral map (Fig 8) is used to define a two-region model of Mrk 996: an ‘inner core’ region, defined by 4363 emission extending over an area of 1.72.3 arcsec2 (185250 pc2), and an ‘outer region’ large enough to incorporate almost the full extent of H emission over an area of 5.36.3 arcsec2 (575685 pc2). The lack of any detectable [O iii] 4363 emission in the outer region is illustrated in Fig 9. Here we compare the summed spectrum of the outer region plus core with the summed spectrum of the core region, and also show the residual outer region spectrum. An emission line map of the broad [N ii] 5755 line is shown in Fig 10a; its flux distribution correlates strongly with that of the similarly broad 4363, suggesting that the excitation of these lines is affected by processes that are particular to the inner core region of Mrk 996. In Fig 11 the velocity profiles of the broad C2 components of H, H and [O iii] 5007 are shown, overlaid in velocity space with the profiles of the [O iii] 4363 and [N ii] 5755. Each spectral line has been summed over the inner core region and all show a FWHM of 300 kms-1, suggesting that a common excitation mechanism is responsible for the emission of the broad component. The larger widths of [O iii] 4363 and [N ii] 5755 indicate that the physical conditions within the inner core are different from those in the outer region.


4 Multi-Component diagnoses: electron temperature and density
The multi-component nature of the emission lines from Mrk 996 must be taken into account when applying plasma diagnostic methods. For example, since [O iii] 4363 is only detected from the central region of Mrk 996 and completely lacks the narrow line component that [O iii] 4959, 5007 exhibit (see Fig 9), an integrated [O iii] (5007+4959)/4363 ratio can not provide a useful temperature diagnostic; this would lead to incorrect results. Previous analyses lacked the spectral and spatial resolution needed to decompose the line profiles and were forced to assume a single density of 106 cm-3 in order to match the anomalously low integrated [O iii] (5007+4959)/4363 flux ratio (TIL96).
The detection of separate narrow and broad line components opens up the possibility of determining separate electron temperatures and densities and conducting a separate abundance analysis for each.
4.1 The Narrow Component Gas
In order to estimate the electron temperature () from which the narrow line component C1 emission arises the following method was used. An upper limit to the applicable to the H i and [O iii] nebular C1 components can be obtained via the simulation of a narrow [O iii] 4363 component using the observed narrow 5007 component. Predicted 4363 C1 line intensities were obtained by multiplying the observed 5007 C1 profile by the theoretical 4363/5007 intensity ratio for a range of ’s at 170 cm-3; the latter was measured from the [S ii] doublet ratio as described below. It should be noted that the [S ii] lines only show narrow C1 components (Table 2). The scaling factors were applied to both the inner core and outer region C1 component 5007 absolute fluxes. Simulated narrow 4363 profiles of decreasing intensity were then subtracted from the observed 4363 line until the residual was no longer detectable, as shown for the core region 4363 profile in Fig 12. It is found that a measurable narrow 4363 C1 component would be detectable at an electron temperature of 10,000 K for both the inner core and the outer region. Thus we adopt an upper limit of 10,000 K to the electron temperature of the gas emitting the C1 component throughout Mrk 996. In Section 5.2 we argue that this limit is closer to 9200 K, based on the inference that these O/H abundance ratio across the narrow and broad line emitting regions is invariant.
| Adopted (K) | (cm-3) | (cm-3) |
|---|---|---|
| Core Region | Outer Region | |
| 9,000 | 17040 | 10 |
| 11,000 | 17040 | 10 |
| 13,000 | 17040 | 10 |
The [S ii] 6717, 6731 lines, whose intensity ratio is a common electron density diagnostic for H ii regions, show only the narrow emission component and were used to compute density values for a range of electron temperatures for the inner and outer regions of the galaxy (Table 3, using the iraf’s22 2 iraf is distributed by the National Optical Astronomy Observatory, which is operated by the Association of Universities for Research in Astronomy temden task of the nebula package). These densities are representative of conditions in the gas from which the narrow component emission arises. This propels us to use alternative methods to investigate the density of the gas emitting the broad line components in the inner core region of Mrk 996. With the electron temperature of 10,000 K obtained above, we find that electron densities of 170 cm-3 and 10 cm-3 are representative of the narrow C1 component gas in the inner and outer regions of Mrk 996, respectively.
4.2 [Fe iii] line diagnostics
[Fe iii] emission line ratios provide useful density diagnostics that can trace both high and low electron densities; see Keenan et al. (2001). The summed inner region spectrum of Mrk 996 (Fig 2) shows a few of the brightest transitions among the 3d6 levels of Fe iii; [Fe iii] 4658, 4702, 4881, 4986, and 5270. The flux in these lines above the continuum level was measured by integrating over the line profile. To maximise accuracy, the fluxes for 4658 and 4702 were measured after removing any contamination from Wolf-Rayet stellar features by subtracting the WR template fit derived in Section 6. Fig 13 shows the extinction corrected fluxes of 4881 and 5270 relative to 4658 along with theoretical ratios as a function of , for ’s between 7,000–20,000 K, from Keenan et al. (2001). Interpolating between the theoretical data for an adopted of 10,000 K, the 4881/4658 ratio indicates log (/cm-3) 5.7 0.3, which falls within the somewhat larger range of log (/cm-3) 6.5 implied by the observed 5270/4658 ratio. These results indicate the presence of a very dense ionised medium throughout the inner core of Mrk 996.


In contrast to the above however, the [Fe iii] 4986/4658 ratio is a more sensitive tracer of low electron densities. Fig 14 shows that relative to 4658 the 4986 line should not be detectable at densities higher than 1,000 cm-3; the fact that the line is detected from Mrk 996 indicates the presence of a low density gas component as well. This is not inconsistent with the high densities derived above for the inner core as the spatial distribution of 4986 emission (not shown) contrasts strongly with that of the other [Fe iii] lines – rather than peaking in the core of the galaxy, 4986 is distributed throughout Mrk 996 and is not confined to the inner region defined by the broad [O iii] 4363 emission. There is a clear detection of 4986 emission over a group of 8 spaxels extending 1′′.6 east from the core. The 4986/4658 and 4702/4658 intensity ratios integrated over these 8 spaxels (Fig 14) confirm that this is a low density area (100–1000 cm-3), typical of normal H ii regions. This emission could be tracing lower density ionised gas throughout Mrk 996. In a study of high excitation nebulae in the Magellanic Clouds by Nazé et al. (2003), [Fe iii] 4986 was only detected in the shell of the super-bubble surrounding the bright H nebula N44C. Due to the large distance of Mrk 996, we are unable to resolve any bubbles surrounding the central super-star cluster even though their presence in the galaxy is likely.
4.3 The Broad Component Gas
The [O iii] (5007+4959)/4363 intensity ratio can be used to determine the electron temperature of the gas from which the broad component emission arises. Since, however, [O iii] 4363 is only detected as a broad line, this dictates that estimates using [O iii] can only involve the broad C2 components; moreover these will only be applicable to the inner core region of the galaxy where 4363 is detected. The FWHMs of components C2 in 4959, 5007 are very similar to that of 4363, all being in the range of 320–515 kms-1 across the inner core region; their surface brightness distributions are also similar. Also in support of the suitability of the [O iii] ratio involving the C2 components is that we do not find any indication of C3 or C4 components in the highest S/N emission line profiles of 4959, 5007 (see Fig 3(f) for an optimised two-component fit to the 5007 emission line from the inner core region). Even so, electron temperatures derived using only the broad line components are un-physically high (30,000 K) until densities higher than 106 cm-3 are adopted.
We can attempt to constrain the electron temperature and density of the broad line component by using the 1663/4363 and 5007/4363 intensity ratios, which due to their considerably different O2+ upper level excitation energies can act as sensitive temperature and density diagnostics between the critical densities of each of these lines. The FOS UV spectra presented by TIL96 revealed a weak O iii] 1663 line detection which, due to its high excitation energy ought to originate from the same gas emitting the broad [O iii] 4363 that we detect. Using a simulated FOS aperture on our broad component flux maps for 5007 and 4363, fluxes of 39.66.3 ergs cm-2 s-1 for 4363 and 214.114.2 ergs cm-2 s-1 for 5007 are predicted to fall within the small FOS aperture centred on the nucleus of Mrk 996. Together with the 1663 flux of 1.9 ergs cm-2 s-1 measured from the FOS spectrum, these fluxes were then dereddened using an average (H) of 0.65 for a simulated FOS aperture on the broad component VIMOS (H) map, to yield 4363/1663 and 5007/4363 intensity ratios of 2.4 and 4.3, respectively. The theoretical 4363/1663 and 5007/4363 ratios for log() 5.0–10.0 and 5,000–30,000 K are presented in Fig 15a, b and the resultant set of solutions are shown in Fig 15c. The two curves in Fig 15c overlap between log() 6.5–8.5 and 7,000–14,000 K. We thus adopt 10,500 3,500 K and log(/cm-3) 7.25 for the broad component emitting gas. The inferred density range is somewhat higher than the value derived from the [Fe iii] 4881/4658 ratio (Section 4.2) and supports the conclusion that the central regions of Mrk 996 contain very dense zones of ionised gas.

5 Chemical Abundances
5.1 Narrow Component Abundances


Abundance maps relative to H+ were created for the N+, O+, O2+, S+, S2+, Ar2+ ions, using the narrow 6584, 7320+7330, 5007, 6717+6730, 6312, and 7136-Å lines respectively (via the abund task in iraf). Each VIMOS spaxel was treated as a distinct ‘nebular zone’ with its own set of physical conditions. Ionic argon and sulphur abundance ratios were converted to total Ar/H and S/H using an ICF(Ar) 1.87 and ICF(S) 1.03 respectively (Kingsburgh & Barlow, 1994). Very small changes were found by adopting the ICF prescriptions of Izotov et al. (2006). Since maps are unattainable for the narrow component gas, we have adopted the upper limit of 10,000 K applicable throughout Mrk 996 (Section 4.1), together with the mean electron densities derived from the [S ii] doublet ratios, of 170 cm-3 and 10 cm-3 for the inner core and outer region, respectively (Table 3). It is emphasised that since the adopted for the narrow component gas is an upper limit, the abundances derived here are necessarily lower limits.
In Fig 16 abundance distributions are shown in the directions from north-east to south-west and south-east to north-west that pass through the centre of Mrk 996 (i.e. in the and directions across the abundance maps, respectively, produced by averaging over a three spaxel-wide pseudo-slit). The variations in the abundances of O2+ and O+ in Fig 16 mirror each other in their distribution. As expected, the more highly ionised species is dominant in the core region, where the UV radiation is expected to be harder. It should further be noted that these abundance trends are only correct if the temperature is constant throughout the gas emitting the narrow line component.
The O/H elemental ratio was derived by summing the O+ and O2+ ionic abundance maps. Adopting a solar oxygen abundance of 4.910-4 relative to hydrogen (Allende Prieto et al., 2001), we find that Mrk 996 has an oxygen abundance of 0.50 solar throughout the inner core region and beyond. This is a significantly higher metallicity than the 0.2 solar derived previously by TIL96, which can be attributed to the high electron temperature of 15,000 K that they employed, based on cloudy models.
An N/H abundance ratio map (Fig 17) was created using an ionisation correction factor, ICF(N) (O++O2+)/O+ (Kingsburgh & Barlow, 1994). Again, very small changes were found by adopting the ICF prescriptions of Izotov et al. (2006). For a constant electron temperature, the N/H ratio, shown in Fig 17, remains constant throughout the core at but shows a two-fold increase north-east of the core region of Mrk 996. A cut across the N/O ratio map of Mrk 996, which is much less sensitive to the adopted electron temperature than either O/H or N/H, shows a similar trend, with log(N/O) 1.5 in the core, rising to 1.2 at a spot north-east of the core (Fig 16).
The mean abundances are listed in Table 5. For the revised oxygen metallicity of Mrk 996 the derived N/O, S/O and Ar/O ratios fall within the expected range for BCDs (Izotov et al., 2006, e.g.).
| Abundance 104 | |||||
| Te / K | 9,000 | 10,000 | 11,000 | ||
| log(Ne/cm-3) | 7.50 | 7.25 | 7.00 | ||
| Line | 100I()/I(H) | Species | |||
| 5755 [N ii] | 7.11.9 | N+/H+ | 1.90.5 | 0.90.2 | 0.40.1 |
| 1750 N iii] | 19.26.8 | N2+/H+ | 7.52.6 | 3.01.1 | 1.30.5 |
| N/H | 9.41.3 | 3.81.7 | 1.70.8 | ||
| 5007 [O iii] | 51.36.2 | O2+/H+ | 12.61.5 | 4.80.6 | 2.00.2 |
| O/H | 15.77.5 | 5.52.6 | 2.31.1 | ||
5.2 Broad component abundances

In order to derive nitrogen elemental abundance for the broad component gas, we correct for the presence of N2+ using the N iii] 1750 line detected by HST FOS. This high excitation energy UV line was not used to correct the narrow emission component nitrogen abundances because it ought to originate from the high excitation gas responsible for the broad line emission. Table 4 lists the ionic abundances derived for the broad line emission gas derived from optical and UV lines. Fluxes are quoted relative to the broad H flux within the simulated FOS aperture and are corrected for extinction using the average (H) value within that aperture in the reddening map derived from the broad components of H/H, H/H ratios. The physical conditions adopted for these calculations are those derived from the broad component emission, i.e. 10,000 3,500 K and log(/cm-3) 7.25 . We consider that the highest allowed is 11,000 K with log(/cm-3) 7.00 being the lowest allowed density, based on Fig 15c. This latter density is consistent with the upper density limit inferred from the [Fe iii] diagnostics. For 11,000 K and log(/cm-3) 7.00 the resulting broad-line O/H abundance ratio of is consistent with being the same as for the narrow line emission regions (cf. Tables 4 and 5). As a consistency check, we determined the for the narrow component VIMOS [O iii] 5007 and H fluxes falling within the FOS aperture that would be required to match the above broad-line O/H ratio. This yielded a temperature of 9,200 K, reinforcing the upper limit of 10,000 K derived in Section 4.1 for the C1 emission. S/H abundances were computed using the [S iii] 6312 line and an estimated (minor) contribution from S+/H+ (in parentheses in Table 5) using equation A38 of Kingsburgh & Barlow (1994). Ar/H abundance ratios were derived using the [Ar iii] 7136 line with ICF(Ar)=1.87 as previously. The adopted mean values are listed in Table 5.
In contrast to the apparent lack of significant variation in the abundances of oxygen, sulphur, and argon between the two velocity components, it appears that the N/O ratio in the broad line region is enriched by a factor of 20 relative to the narrow line region, with the broad line region having log(N/O) 0.13. We conclude that the observations are consistent with the narrow and broad line regions both having an O/H ratio of 0.5 solar.
5.3 Elemental Helium Abundance
Narrow and broad component He+/H+ abundance maps were derived from He i 5876 C1 and C2 maps. Abundances were calculated using the Case B He i emissivities of Porter et al. (2005) at the respective and of the broad and narrow emission components. Since these are only valid up to log(/cm-3) 6, a correction factor of 0.9543 was applied to the broad component emissivity to extrapolate up to log(/cm-3) 7.25. At these densities, collisional excitation from the He0 2s3S metastable level by electron impacts contributes to the observed broad He i 5876 component; this effect is accounted for by Porter et al. (2005). Fig 19 shows and direction cuts across the broad and narrow component elemental He/H maps. We have assumed that the He2+/H+ fraction is negligible. Good agreement between the spatial variations in the He/H abundance for each component is observed. No relative He/H enrichment is seen across the components; within the uncertainties both fall between the pre-galactic He/H ratio of 0.08 (Luridiana et al., 2003) and the solar ratio 0.10 (Lodders, 2003). This contrasts with the localized N/H enrichment north-east from the nucleus that spatially correlates with a peak in (H) (see Section 6). The slight decrease in He/H in the core region might be attributable to the presence of He2+. We find this unlikely, however, since no nebular He ii 4686 emission has been detected (none was reported in the recent study by Thuan et al. (2008)), and in addition, other similarly high excitation lines such as [Ar iv] are not present in the spectrum of the galaxy. The derived He/H abundances at the centre of Mrk 996 agree well with those of TIL96 who calculated He+/H+0.09 from the He i 5876 emission within their FOS aperture.
Table 5 summarises the derived abundance for the narrow and broad line emission regions of the galaxy.
| C1 | C2 | |
|---|---|---|
| Adopted (K) | 10,000a | 11,000 |
| Adopted (cm-3) | 170 | 107 |
| He/H | 0.0910.017 | 0.0720.018 |
| N+/H+ 105 | 0.460.18 | 4.11.1 |
| N2+/H+ 104 | – | 1.30.5 |
| N/H 105 | 0.890.25 | 17.07.6b |
| O+/H+ 104 | 1.30.4 | – |
| O2+/H+ 104 | 1.1 0.2 | 2.00.2 |
| O/H 104 | 2.40.4 | 2.31.1b |
| S+/H+ 107 | 10.31.8 | (9.71.8) |
| S2+/H+ 106 | 4.70.9 | 5.41.3 |
| S/H 106 | 5.91.6 | 6.61.6 |
| Ar2+/H+ 107 | 8.191.8 | 12.02.8 |
| Ar/H 106 | 1.5 0.3 | 2.2 0.5 |
| log N/O | 1.43 | 0.13 |
| log S/O | 1.61 | 1.54 |
| log Ar/O | 2.20 | 2.02 |
- a
-
Upper limit adopted so that C1 abundances are lower limits.
- b
-
Applicable to a central 0.′′86 (FOS) aperture; see the text for details.

6 Wolf-Rayet Stars and Stellar Age

Wolf-Rayet (WR) features were identified in Mrk 996 by TIL96 in their single aperture FOS spectroscopy of a 0.′′86 region at the centre of Mrk 996. The VIMOS IFU spectra also show a broad Wolf-Rayet (WR) stellar feature at 4650 Å, attributable to a mixture of late-type WN (WNL) and WC stars at He ii 4686 and N iii 4640 (with an additional weak WC stellar C iv feature at 5808 Å). The WR spectral signatures are seen to extend throughout the core region of Mrk 996 and show excellent agreement with the spatial extent of the broad [O iii] 4363 emission (Fig 8). A map of the 4650 Å WR feature is shown in Fig 20; this has been decontaminated from the emission by nebular [Fe iii] 4658 by fitting a Gaussian profile to the line and subtracting its flux from the integrated flux of the 4650 Å feature. After summing the spectra over the core region, LMC WR spectral templates from Crowther & Hadfield (2006) were used to fit both spectral features. Although the WC feature is weak, its contribution is essential in fitting the broad wings of the 4650 Å feature. At the distance of Mrk 996 (22 Mpc) the two WR features indicate the presence of 2600 WNL stars and 400 WC stars. Assuming a similar depth for the area over which these spectral features are summed, 1.72.3 arcsec2 (4.6104 pc2), results in a volume density of 310-4 WR stars per pc3 in the core region.
We can compare our WR number estimates with those of TIL96, who estimated that 600 late-type WN stars and 74 WC stars were responsible for the WR emission seen within their 0.′′86 diameter FOS aperture. Scaling our own core region WR number estimates for the difference in aperture size would predict 390 WNL stars and 60 WC stars within the FOS aperture. While the agreement between the two estimates is quite good, the decrease in WNL star numbers for our scaled estimate can be attributed to the non uniform density of WR stars in the core region (see Fig 20). In contrast, the WC 5808 Å feature is very centrally peaked, thus giving a good agreement between the two estimates.
Luminosities of hydrogen recombination lines, particularly H, can provide estimates of the ionizing flux present, assuming a radiation-bounded nebula (Schaerer & Vacca, 1998). Thus, the equivalent width () of H is commonly used as a stellar age indicator at a given metallicity. A map of (H) across Mrk 996 (derived from integrating over the full emission line profile) is shown in Fig 21 and displays a surprising morphology compared to the central location of the ionizing sources in Mrk 996. A peak is seen directly NE of the centre of the galaxy, which correlates well with the peak in [N ii] 6584 emission shown in Fig 17. We can use the (H) map, in conjunction with the metallicity map (described in Section 5.1), to estimate the distribution of stellar ages throughout Mrk 996. We find that the core region (H) corresponds to a stellar age of 4.5 Myr whereas the (H) peak NE of the core corresponds to a slightly younger stellar age of 3 Myr (Schaerer & Vacca, 1998, cf. fig 7 of ); these ages are sufficiently long to allow for the presence of WR stars in the galaxy.
An estimation of the number of O-type stars was made, assuming that all ionizing photons, , are produced by O and WR stars and utilising the H luminosity, (H), integrated over the whole galaxy (i.e. using the dereddened combined C1 and C2 H flux from the inner and outer regions, and at a distance of 22.3 Mpc). The absolute number of O stars was derived using (e.g. Fernandes et al. (2004))
| (1) |
where is the emission rate of ionising photons, as derived from (H), and , are the emission rates of ionizing photons by WR stars and O7V stars, respectively, with being the total number of WR stars. is a conversion parameter for the proportion of O7V stars relative to all OV stars and is estimated as being 0.2 by Schaerer & Vacca (1998) at the metallicity of Mrk 996 (0.5 Z⊙). Adopting 0.2, s-1 (Schaerer et al., 1999), and (C1+C2)3.361053 photons s-1 we find 153,000 yielding . As a lower limit, this ratio is in good agreement with those predicted by evolutionary synthesis models by previous studies; at the predicted age of 5 Myr for the Mrk 996 starburst, Cerviño & Mas-Hesse (1994) find that this fraction is typical at metallicities of 0.4 Z⊙, while Schaerer & Vacca (1998) predict /() 0.04 for a metallicity of 0.25 Z⊙.
Using the H–SFR (star formation rate) relation of Kennicutt (1998) and the total H luminosity (C1+C2) of 4.83 1041 erg s-1 we obtain a global current SFR of 3.8 M⊙ yr-1. Taking into account the subsolar metallicity of Mrk 996 this can be reduced to 2.7 M⊙ yr-1 (Lee et al., 2002). However, in the event that the C2 component emission is partly attributable to shock-excited gas (see Section 7.1) so that it cannot be included in the estimate of , a SFR lower limit of 1.3 M⊙ yr-1 is derived based on Q0(C1) 1.311052 photons s-1 alone.

7 Discussion
7.1 Diagnosing the ionisation mechanisms
In order to gain insight into the mechanisms responsible for the multi-component line emission from Mrk 996, we made use of the classic diagnostic diagrams of Baldwin et al. (1981) (the BPT diagrams). These are employed to classify galaxies according to the dominant excitation mechanism of their emission lines, i.e. either photoionisation by massive stars within H ii regions or photoionisation by non-thermal continua from active galactic nuclei (AGN). The diagrams consist of excitation-dependent, extinction-independent line ratios: log([O iii] 5007/H) versus either log([N ii] 6584/H) or log([S ii](6716,31)/H). Star-forming galaxies fall into the lower left region of the diagram, AGN host galaxies fall into the upper right region and Low-ionisation Emission Line Regions (LINERs) fall in the lower right region. The separation is not as clear, however, for low metallicity AGNs (see e.g. Stasińska et al. (2006)), only a handful of which have been proposed to exist thus far (Izotov & Thuan, 2008).
Kewley et al. (2001) calculated the first starburst grids that attempted to match optical diagnostic diagrams based on purely empirical data, by coupling the mappings iii photoionisation code and starburst99 population synthesis models. Whereas previous semi-empirical studies involved only solar-metallicity calculations, their line ratios were computed for a range of metallicities ( 0.05–3.0 Z⊙) and ionisation parameters ( – cm s-1), where is the maximum velocity of an ionisation front that can be driven by the local radiation field and is related to the non-dimensional ionisation parameter /c, (Dopita et al., 2001). Utilizing these grids, Kewley et al. (2001) determined a ‘maximum starburst line’ (shown in Fig 22), above which the flux ratios of an object cannot be fitted by pure starburst models alone. Ratios lying above this photoionisation boundary require additional sources of excitation such as shocks or AGNs. As mentioned above, this picture has recently been revised and it is now believed that low- AGNs, should they exist, would occupy similar regions on the BPT diagram as normal H ii galaxies; based on an analysis of a large sample of Sloan Digital Sky Survey galaxies, Stasińska et al. (2006) have found that composite AGN/H ii region models with 0.4 Z⊙ lie very close to and below the pure H ii region sequence, whereas when considering also the regime of 0.6 Z⊙ they established that the locus below the Kewley et al. (2001) line allows for an AGN-excited gas component of up to 20 per cent.
It is therefore instructive to see what area of the BPT diagram Mrk 996 occupies. Kewley et al. (2001) found that since the [S ii](6716,31)/H ratio is affected by the density of the line emitting region and it is therefore less accurate as a diagnostic. Hence considering the large density difference between the narrow and broad component gas within Mrk 996 we only considered the [O iii] 5007/H vs. [N ii] 6584/H ratios (Fig 22). Since no broad component is detected for [N ii] 6584 we have not been able to create separate broad and narrow diagnostic diagrams and instead present (i) a narrow component diagram (Fig 22 top panel), and (ii) ratios derived from the entire emission line profiles (i.e. integrated over broad and narrow component emission, where both exist; Fig 22 bottom panel). Spaxels corresponding to the core region of the galaxy are shown as red crosses, with outer region spaxels plotted as green crosses. Also shown is the maximum starburst line of Kewley et al. (2001).
The data points for the outer narrow line region of Mrk 996 mostly straddle the ‘theoretical’ upper limit for pure photoionisation. Based on the Kewley et al. (2001) grids, the flux ratios lie within a metallicity range of 0.3–0.5 and along and above an ionisation parameter track for 3 (the maximum ionisation parameter computed). The narrow component emission in the core region occupies the top left of the distribution, which corresponds to a higher ionisation parameter and lower metallicity in the starburst grids, while a significant number of data points fall outside the SFG (star-forming galaxies) area of the plot. When the broad component is included in the diagnostics, the location of the outer region spaxels move to the left, whereas the core region spaxels move downwards and to the left for both ratios to occupy a lower ionisation parameter and metallicity region. This is most likely due to the suppression of the [O iii] 5007 broad component emission within the high density core region, which would lower the combined narrow plus broad [O iii] 5007/H ratio.
As previously mentioned, exceeding the ‘maximum starburst’ line can also be indicative of a contribution to the ionisation by fast shocks. However, the amount by which this line can be crossed before shocks must be a substantial source of ionisation has not been established thus far. Similar diagrams were created by Calzetti et al. (2004) for four starburst (SB) galaxies using ratios from HST WFPC2 images, such as [O iii] 5007/H vs. [S ii] 6716,31/H. They found that a number of regions in the SB galaxies lay above the maximum starburst line and as a result defined regions of non-stellar excitation as either lying above and to the right of it or where the [S ii]/H ratio is high enough to be compatible with non-stellar sources, i.e. [S ii]/H 0.7–0.9 (Veilleux & Osterbrock, 1987; Shull & McKee, 1979). The log([S ii] 6716,31/H) ratio is traditionally used as a diagnostic for shock-excited gas because shock models predict that relatively cool high-density regions should form behind the shock front and emit strongly in [S ii] (Dopita, 1978). The [S ii]/H flux ratios for the narrow component emission across Mrk 996 lie between 0.03–6, well below the high [S ii]/H ratios predicted for shocks. On the other hand, Thuan et al. (2008) employed a model with shocks at a velocity of 250 km s-1 that reproduced the observed intensity of the high-ionisation potential [O iv] 25.9 m line detected in the Spitzer spectrum of Mrk 996. In conclusion, Fig 22 by itself cannot provide firm evidence for or against the presence of AGN activity within Mrk 996 given the galaxy’s rather low metallicity status, even though the integrated broad component H luminosity of 2.51041 erg s-1 this at the lower limit of those measured from rare low-Z BCDs suspected of harbouring active galactic nuclei (Izotov & Thuan, 2008, 31041 – 21042 erg s-1 ). Although photoionisation appears to be the dominant excitation mechanism, we cannot rule out a contribution from shocks, particularly with respect to the broad component emission. We draw attention to the significant bias inherent in BPT diagrams of galaxies whose analysis does not involve a separate consideration of narrow/broad line diagnostics.

7.2 What is the origin of the broad line emission?
Mrk 996 is not the only BCD that shows evidence for large line widths. Izotov et al. (2007) presented an analysis of a large number of low metallicity BCDs exhibiting broad emission lines with inferred gas expansion velocities of 1000–7000 km/s. WR stellar winds have been proposed as a possible mechanism for producing such broad line widths, but thus far no correlation between the presence of broad nebular lines and broad WR features have been found (Izotov et al., 2007). We find that in Mrk 996 the surface brightness of the 4650Å WR feature does not correlate tightly with that of [O iii] 4363 (Fig 23), further indicating that the mechanism responsible for the broad line emission is not active only in the regions where WR stars are present.
Roy et al. (1991); Roy et al. (1992) investigated a variety of mechanisms to explain broad nebular gas components in H ii regions, including electron scattering, stellar winds, supernova remnants and superbubble blowouts. However, each of these mechanisms was deemed unsatisfactory. An exploration of blowout mechanisms within low-metallicity H ii regions was conducted by Tenorio-Tagle et al. (1997) using a hydrodynamical calculations to try to match a sample of low-metallicity H ii regions with broad emission line components. They proposed that the absence of strong radiative cooling in the low-metallicity ISM within these regions could delay the action of Rayleigh-Taylor (RT) instabilities that can fragment the expanding shell within a blowout. However, this mechanism may not be applicable to Mrk 996, as one of the required conditions is a low-density environment, whereas we derive high densities for its broad component gas (log( )7).
Broad line emission (FWHM 400 km/s; C2) is detected throughout the central regions of Mrk 996, throughout the bright starburst region and out to 5′′. Close to the nucleus of the galaxy the broad Balmer line component splits into two additional broad components (FWHM 200–300 km s-1) which trace the kinematics of a two-armed mini spiral, but component C2 does not show evidence of velocity splitting at our level of spectral resolution farther out (Figs 3 and 4). Given the youth of the starburst region in Mrk 996 (5 Myr) containing large numbers of young O and WR-type stars (Section 6), and presence of very dense zones of gas (Section 4.3), it is possible that the broad line emission partly originates from a turbulent mixing layer forming on the surface of dense cool clumps which are subjected to irradiation and hydrodynamic ablation from the hot winds from young massive star clusters (Begelman & Fabian (1990); Slavin et al. (1993)). Recent work on the nearby NGC 1569 and M82 has revealed that the broad line component observed in those starburst galaxies can be explained as originating within turbulent layers on the surface of the dense gas clumps (Westmoquette et al., 2007a; Westmoquette et al., 2007b). Motivated by this hypothesis, Binette et al. (2009) have successfully modelled the broad underlying components seen in the Balmer and [O iii] lines of NGC 2363 via the inclusion of a turbulent mixing layer and conclude that the broad profile results from radial acceleration of photoionised turbulent gas. Their models also correctly predict the absence of a broad component in [S ii] and [N ii] lines. Although the applicability of these results to Mrk 996 may be limited due to the high densities of Mrk 996’s broad components ( 100 cm-3 is adopted for NGC 2363) and their much broader predicted line widths (3500 kms-1), their results lend a great deal of weight to the turbulent mixing layer hypothesis.
This mechanism could also be at work here. It is probable that the central region of Mrk 996 consists of many small, dense clouds of relatively low volume filling factor dispersed within the young star clusters of the starburst. This results in a large cloud surface area with which the copious ionizing photons and fast stellar winds can interact. If the presence of broad emission indicates that strong wind-clump interactions are taking place, then by extension, material from these interaction sites must be being stripped off and entrained into the cluster wind flows contributing to the overall appearance of component C2.

8 Summary and conclusions
Mrk 996 is a complex system containing an extended starburst region (216–432 pc in radius) with a centrally concentrated Wolf-Rayet population in the nuclear regions (200 pc). The young stellar population in the nuclear super-cluster contains 3000 WR stars and 150,000 O7V-type equivalent stars. The age of the nuclear starburst is estimated to be 4.5 Myr but there is evidence that the extended starburst is younger by 1 Myr. The presence of an old stellar population (1 Gyr) has been independently established (Thuan, Hunt & Izotov 2008). The current star formation rate is 2 M⊙ yr-1. The spatially mapped ionized gas shows a composite emission spectrum consisting of narrow and broad lines. The Balmer line velocity structure close to the nucleus confirms the presence of a spiral structure confined in the inner 160 pc. The H broad component has a large integrated luminosity of 2.51041 erg s-1; this is at the lower limit of those measured from the rare low- BCDs suspected of harbouring active galactic nuclei (Izotov & Thuan, 2008). Our VIMOS IFU analysis has enabled a separate analysis of the physical conditions and chemical composition of the narrow and broad emission line regions. The broad line region in the nuclear starburst is very dense (107 cm-3) whereas the narrow line component is of lower density (103 cm-3).
The upwards revised oxygen metallicity of Mrk 996 is Z⊙ (12 log O/H 8.37). The broad line region is nitrogen-enriched compared to the narrow line region by 1.3 dex. However, no relative enrichment of He, O, S, and Ar is inferred. The S/O and Ar/O abundance ratios in the two components, as well as the N/O ratio in the narrow line component, are typical of those in H ii galaxies and dwarf irregulars (van Zee & Haynes, 2006; Izotov et al., 2006, e.g.). The narrow-line N/O ratio in particular is exactly the value expected based on the galaxy’s colour, and follows the metallicity-luminosity relationship for isolated dwarf galaxies (van Zee & Haynes, 2006, cf. figs 8, 9 of ) for 16.7, 0.44, TIL96); its mean current value can be interpreted as the result of the slow release of nitrogen from the intermediate-mass stellar population over the last few Gyrs. On the other hand, the high N/O ratio in the broad line region of the inner galaxy is consistent with the presence of numerous evolved massive stars (e.g. WNL-type and Luminous Blue Variables) and can be attributed to the cumulative effect of their N-enriched winds. An elevated N/O could not in this case be due to the outflow of oxygen-enriched gas from supernova explosions: the absence of elevated (or suppressed) O/H, S/H and Ar/H ratios in the broad line gas implies that recent supernova ejecta are probably not implicated in its excitation; at the young age of the Mrk 996 starburst only a few very massive stars (50 M⊙) would have exploded as supernovae (Woosley et al., 2002, e.g. ). The mild two-fold increase over the mean of the narrow-line N/H (Fig 19) spatially correlates with a local peak in (H) in a region (Fig 21) where no WR stars are seen. This could mean that even though the narrow-line gas is fairly well mixed, some localized N-enrichment has already occurred in an area dominated by normal OB-type stars which is slightly younger than the nuclear starburst.
Finally, we would like to draw attention to the nature of the broad [O iii] 4363 line detected in Mrk 996. Even though this galaxy represents an extreme case in harbouring a very dense ionized component which dominates the excitation of this line, it is by no means unique (Izotov et al., 2007, see e.g. ). In such cases where a substantial fraction of the [O iii] 4363 and 4959, 5007 Å lines arise in different gas components, the integrated auroral to nebular ratio would not be representative of the electron temperature of the overall H ii region; using it would result in biased physical conditions and chemical abundances. The problem would be aggravated in analyses based on low dispersion, low spatial resolution spectra and may therefore have implications for the so-called ‘heating problem’ of blue compact galaxies (Stasińska & Schaerer, 1999; Péquignot, 2008, e.g.).
9 Acknowledgments
We thank the VIMOS support staff at Paranal for taking these service mode observations [programme 078.B-0353(A), PI: Tsamis]. We appreciate discussions with Marina Rejkuba and Carlo Izzo about the VIMOS instrument and the GASGANO reduction pipeline. Also, our thanks go to Fabrizio Sidoli for helpful discussions regarding WR template spectra and to Nate Bastian for advice on IFU cube construction. This research has made use of the NASA ADS database. BLJ acknowledges support from a STFC studentship. YGT acknowledges support from a STFC fellowship and from grants AYA2007-67965-C03-02 and CSD2006-00070 CONSOLIDER-2010 “First science with the GTC” of the Spanish Ministry of Science and Innovation.
References
- Allende Prieto et al. (2001) Allende Prieto C., Lambert D. L., Asplund M., 2001, ApJL, 556, L63
- Baldwin et al. (1981) Baldwin J. A., Phillips M. M., Terlevich R., 1981, PASP, 93, 5
- Bastian et al. (2006) Bastian N., Emsellem E., Kissler-Patig M., Maraston C., 2006, A&A, 445, 471
- Begelman & Fabian (1990) Begelman M. C., Fabian A. C., 1990, MNRAS, 244, 26P
- Binette et al. (2009) Binette L., Drissen L., Ubeda L., Raga A. C., Robert C., Krongold Y., 2009, ArXiv e-prints
- Calzetti et al. (2004) Calzetti D., Harris J., Gallagher III J. S., Smith D. A., Conselice C. J., Homeier N., Kewley L., 2004, AJ, 127, 1405
- Cerviño & Mas-Hesse (1994) Cerviño M., Mas-Hesse J. M., 1994, A&A, 284, 749
- Crowther & Hadfield (2006) Crowther P. A., Hadfield L. J., 2006, A&A, 449, 711
- DeBernardis et al. (2008) DeBernardis F., Melchiorri A., Verde L., Jimenez R., 2008, Journal of Cosmology and Astro-Particle Physics, 3, 20
- Dimeo (2005) Dimeo R., 2005, PAN User Guide. ftp://ftp.ncnr.nist.gov/pub/staff/dimeo/pandoc.pdf
- Dopita (1978) Dopita M. A., 1978, ApJS, 37, 117
- Dopita et al. (2001) Dopita M. A., Kewley L. J., Sutherland R. S., Heisler C. A., 2001, in Starburst Galaxies: Near and Far, Tacconi L., Lutz D., eds., p. 225
- Fernandes et al. (2004) Fernandes I. F., de Carvalho R., Contini T., Gal R. R., 2004, MNRAS, 355, 728
- Howarth (1983) Howarth I. D., 1983, MNRAS, 203, 301
- Hummer & Storey (1987) Hummer D. G., Storey P. J., 1987, MNRAS, 224, 801
- Izotov et al. (2006) Izotov Y. I., Stasińska G., Meynet G., Guseva N. G., Thuan T. X., 2006, A&A, 448, 955
- Izotov & Thuan (2008) Izotov Y. I., Thuan T. X., 2008, ApJ, 687, 133
- Izotov et al. (2007) Izotov Y. I., Thuan T. X., Guseva N. G., 2007, ApJ, 671, 1297
- Izotov et al. (1994) Izotov Y. I., Thuan T. X., Lipovetsky V. A., 1994, ApJ, 435, 647
- Keenan et al. (2001) Keenan F. P., Aller L. H., Ryans R. S. I., Hyung S., 2001, Proceedings of the National Academy of Science, 98, 9476
- Kennicutt (1998) Kennicutt Jr. R. C., 1998, ArA&A, 36, 189
- Kewley et al. (2001) Kewley L. J., Dopita M. A., Sutherland R. S., Heisler C. A., Trevena J., 2001, ApJ, 556, 121
- Kingsburgh & Barlow (1994) Kingsburgh R. L., Barlow M. J., 1994, MNRAS, 271, 257
- Kunth & Östlin (2000) Kunth D., Östlin G., 2000, A&A Rev., 10, 1
- Lee et al. (2002) Lee J. C., Salzer J. J., Impey C., Thuan T. X., Gronwall C., 2002, AJ, 124, 3088
- Lodders (2003) Lodders K., 2003, ApJ, 591, 1220
- Luridiana et al. (2003) Luridiana V., Peimbert A., Peimbert M., Cerviño M., 2003, ApJ, 592, 846
- Moorwood & Glass (1982) Moorwood A. F. M., Glass I. S., 1982, A&A, 115, 84
- Nazé et al. (2003) Nazé Y., Rauw G., Manfroid J., Chu Y.-H., Vreux J.-M., 2003, A&A, 408, 171
- Péquignot (2008) Péquignot D., 2008, A&A, 478, 371
- Porter et al. (2005) Porter R. L., Bauman R. P., Ferland G. J., MacAdam K. B., 2005, ApJL, 622, L73
- Pustilnik et al. (2004) Pustilnik S., Kniazev A., Pramskij A., Izotov Y., Foltz C., Brosch N., Martin J.-M., Ugryumov A., 2004, A&A, 419, 469
- Roy et al. (1992) Roy J.-R., Aube M., McCall M. L., Dufour R. J., 1992, ApJ, 386, 498
- Roy et al. (1991) Roy J.-R., Boulesteix J., Joncas G., Grundseth B., 1991, ApJ, 367, 141
- Schaerer et al. (1999) Schaerer D., Contini T., Kunth D., 1999, A&A, 341, 399
- Schaerer & Vacca (1998) Schaerer D., Vacca W. D., 1998, ApJ, 497, 618
- Schlegel et al. (1998) Schlegel D. J., Finkbeiner D. P., Davis M., 1998, ApJ, 500, 525
- Shull & McKee (1979) Shull J. M., McKee C. F., 1979, ApJ, 227, 131
- Slavin et al. (1993) Slavin J. D., Shull J. M., Begelman M. C., 1993, ApJ, 407, 83
- Stasińska et al. (2006) Stasińska G., Cid Fernandes R., Mateus A., Sodré L., Asari N. V., 2006, MNRAS, 371, 972
- Stasińska & Schaerer (1999) Stasińska G., Schaerer D., 1999, A&A, 351, 72
- Tenorio-Tagle et al. (1997) Tenorio-Tagle G., Munoz-Tunon C., Perez E., Melnick J., 1997, ApJL, 490, L179+
- Thuan et al. (2004) Thuan T. X., Hibbard J. E., Lévrier F., 2004, AJ, 128, 617
- Thuan et al. (2008) Thuan T. X., Hunt L. K., Izotov Y. I., 2008, ApJ, 689, 897
- Thuan et al. (1995) Thuan T. X., Izotov Y. I., Lipovetsky V. A., 1995, ApJ, 445, 108
- Thuan et al. (1996) —, 1996, ApJ, 463, 120
- van Zee & Haynes (2006) van Zee L., Haynes M. P., 2006, ApJ, 636, 214
- van Zee et al. (2001) van Zee L., Salzer J. J., Skillman E. D., 2001, AJ, 122, 121
- Veilleux & Osterbrock (1987) Veilleux S., Osterbrock D. E., 1987, ApJS, 63, 295
- Walsh & Roy (1987) Walsh J. R., Roy J.-R., 1987, ApJL, 319, L57
- Walsh & Roy (1989) —, 1989, MNRAS, 239, 297
- Walsh & Roy (1990) Walsh J. R., Roy J. R., 1990, in ESO Conf. Proc. 34: 2nd ESO/ST-ECF Data Analysis Workshop, Baade D., Grosbol P. J., eds., p. 95
- Westmoquette et al. (2007a) Westmoquette M. S., Exter K. M., Smith L. J., Gallagher J. S., 2007a, MNRAS, 381, 894
- Westmoquette et al. (2007b) Westmoquette M. S., Smith L. J., Gallagher III J. S., O’Connell R. W., Rosario D. J., de Grijs R., 2007b, ApJ, 671, 358
- Woosley et al. (2002) Woosley S. E., Heger A., Weaver T. A., 2002, Reviews of Modern Physics, 74, 1015
- Zanichelli et al. (2005) Zanichelli A., Garilli B., Scodeggio M., Franzetti P., Rizzo D., Maccagni D., Merighi R., Picat J. P., Le Fèvre O., Foucaud S., Bottini D., Le Brun V., Scaramella R., Tresse L., Vettolani G., Adami C., Arnaboldi M., Arnouts S., Bardelli S., Bolzonella M., Cappi A., Charlot S., Ciliegi P., Contini T., Gavignaud I., Guzzo L., Ilbert O., Iovino A., McCracken H. J., Marano B., Marinoni C., Mathez G., Mazure A., Meneux B., Paltani S., Pellò R., Pollo A., Pozzetti L., Radovich M., Zamorani G., Zucca E., 2005, PASP, 117, 1271