Non-specific DNA-protein interaction: Why proteins can diffuse along DNA
Abstract
The structure of DNA Binding Proteins enables a strong interaction with their specific target site on DNA. However, recent single molecule experiment reported that proteins can diffuse on DNA. This suggests that the interactions between proteins and DNA play a role during the target search even far from the specific site. It is unclear how these non-specific interactions optimize the search process, and how the protein structure comes into play. Each nucleotide being negatively charged, one may think that the positive surface of DNA-BPs should electrostatically collapse onto DNA. Here we show by means of Monte Carlo simulations and analytical calculations that a counter-intuitive repulsion between the two oppositely charged macromolecules exists at a nanometer range. We also show that this repulsion is due to a local increase of the osmotic pressure exerted by the ions which are trapped at the interface. For the concave shape of DNA-BPs, and for realistic protein charge densities, we find that the repulsion pushes the protein in a free energy minimum at a distance from DNA. As a consequence, a favorable path exists along which proteins can slide without interacting with the DNA bases. When a protein encounters its target, the osmotic barrier is completely counter-balanced by the H-bond interaction, thus enabling the sequence recognition.
DNA stores the genetic material of all living cells and viruses. This huge amount of information is effective only if DNA binding proteins (DNA-BPs) manipulates DNA in very specific locations. When the protein finds its DNA target, the shape complementarity of DNA Binding Proteins and their specific DNA sequence enables to maximize the number of hydrogen bonds, thus leading to a strong protein-DNA association [1, 2, 3, 4, 5, 6]. The rate of protein-DNA association is however not controlled by the association step itself, but by the whole searching process. It is well established now that DNA-BPs diffuse along DNA before they reach their specific site [7]. During this search, the only interactions between protein and DNA which can play a role are non sequence-specific. Those non-specific interactions between protein and DNA remain poorly documented. Altough the predominance of electrostatics is unquestionable [1, 2, 4, 3, 5, 6], it remains unclear how the protein structure comes into play [5, 6, 7]. Does the typical concavity of DNA-BPs which favors the specific association also influence the non-specific electrostatic interaction? In DNA-protein complexes, the mean charge of the protein residues located at the interface is positive [1, 2]. Nevertheless, structural studies of non-specific complexes have shown that the protein atoms and the DNA atoms are weakly packed together at the interface [1, 2, 3, 5, 6], thus suggesting that a force counterbalances the electrostatic attraction. In this letter, our purpose is to establish the general mechanisms that control the mean force between protein and DNA and that are applicable to a wide variety of DNA-BPs. That goal in mind, we design coarse-grained DNA and protein models, rather than detailed atomic models and investigate their interactions. First, we prove that a short range repulsion exists when the shape of the protein is complementary to the shape of DNA. Second, we show that this repulsion increases when the protein charge decreases, and we unravel the underlying physical mechanism. Finally, we discuss in detail why this phenomenon is relevant to real biological systems, thanks to statistical data of the protein charge and of the number of H-bonds between protein and DNA.
The most characteristic aspect of DNA-BPs is their shape complementarity with DNA. As a matter of fact, the concave DNA-BPs can cover the convex DNA with up to 35% of their surface [1]. At close contact, those interface regions exclude the solvent molecules and form numerous weak bonds with DNA (mainly H-bonds [1]). In a first instance, we artificially switch off these H-bond interactions. To probe the influence of protein shape in controlling the non-specific electrostatic interaction, we monitor changes in the potential of mean force upon modifying the curvature of smooth model proteins along the DNA direction (noted ) and in the perpendicular direction () (see Fig. 1a). The charge of all model proteins is given by a single site placed nm under the protein surface facing DNA. The direct electrostatic force in vacuum is therefore the same for any protein shape investigated here. The DNA is modelled as a hard cylinder with divalent charged sites. The water and the electrolyte ions are described by the primitive model of electrolyte solutions [8]. This model has already been used to explain the less intuitive trends of electrostatic interactions in solution, e.g. the attraction between like-charged particles [9], or the repulsion between charged and neutral ones [10]. The relative permittivity of water is taken equal to , and the radius of the salt ions is nm.
The potential of mean force between a protein and a DNA molecule separated by a distance is equal to the free energy of the global system (protein, DNA and ions in water). At a fixed surface-to-surface distance , this energy only depends on the ion distribution. We compute thus the free energy thanks to canonical Monte Carlo (MC) simulations that sample the ion configurations [11, 12]. We voluntarily freeze the rotational degrees of freedom of the protein, and study the interaction for the most attractive orientation, when the protein cavity points toward DNA. Indeed, this orientation is the one always observed for specific and non-specific complexes, and we observed that the free energy gets abruptly more repulsive when the protein rotates. The protein and DNA are placed in a parallelepipedical simulation box (275x275x150 nm) with periodic boundaries. The results are reported in Fig. 1b.
The curvature slightly influences the range of the interaction, as illustrated by the comparison of spherical and cylindrical proteins. The effect of the curvature is remarkably more pronounced. The free energy as a function of , which is monotonic for , becomes non-monotonic for and exhibits then a minimum at a distance . For , there is an unexpected repulsive free energy barrier between the oppositely charged bodies, that reaches kBT in the case of perfectly matching surfaces (). This behavior is weakly influenced by the shape of the remaining surface of the protein: varies from e.g. kBT with a cubic protein to kBT for a cylindrical one.


Once the role of the protein curvature is established, we perform simulations of concave DNA-BP models with various charge patterns to assess the influence of the protein charge on the interaction. When the pattern changes at constant interface charge density , the free energy exhibits only minor variations (data not shown). Conversely, strongly modulates the free energy profile (Fig. 2). For an interface of e.g. nm2, if changes from to , dramatically decreases from kBT to kBT and decreases from nm to nm.

To provide a rational basis to the simulation results, we carry out statistical mechanical calculations within the Poisson Boltzmann (PB) framework. The complementary interacting surfaces of the protein and the DNA are described by a minimal model: two charged parallel plates separated by a distance . In agreement with the MC results, this model predicts a minimum of the free energy, whose depth and position can be analytically expressed [14, 15]. Moreover, we introduce corrections to the plate-plate model to account for the actual curvature of protein and DNA by rescaling both the interface area and the charge density. More precisely, the PB free energy is integrated over after projection of each surface element on the plane orthogonal to the axis [16]. If and are the radius and height of the cylindrical interface, the interaction free energy is given by
where is the interaction free energy by unit area for two parallel plates and the distance between two surface elements of the curved bodies facing each other. The effective charge densities used in the PB calculation are obtained by fitting all the Monte Carlo results simultaneously ( and ). Despite the nanometer size of the interface, the Poisson-Boltzmann results remarkably agree with the results of the Monte Carlo simulations for the concave DNA-BP model (Fig. 2).
Furthermore, the PB results shed light on the two physical mechanisms inducing an attraction and a repulsion between oppositely charged bodies. The cations and anions between the plates are in equilibrium with a bulk reservoir (VT ensemble). Here, this equilibrium displays two regimes: a counterion-dominated regime, for which the number of ions between the plates is dominated by the counterions neutralizing DNA (), and a salt-dominated regime (). It is established that the salt-dominated regime is attractive, because the salt release is favorable salt both entropically (because the volume between the plates decreases) and electrostatically (because the plates are oppositely charged) [17]. As expected, the ionic density decreases as the charged plates approach each other in the particular case (i.e. ) representative of this regime (Fig. 3a). Nevertheless, if , a constant number of neutralizing counterions remains confined between the plates in order to maintain electroneutrality. As decreases, these cations get more and more concentrated. Below a given distance, this counterion trapping dominates the salt release (counterion-dominated regime). As a matter of fact, the ionic density increases as decreases for , Fig. 3a. The resulting enhancement of the osmotic pressure exceeds the salt-mediated attraction and results in a global repulsion.

To visualize how this mechanism applies to a more realistic interface, we compute the ionic density by MC simulations. As shown in Fig. 3b, the two regimes are similar to those observed with the two-plate model. This highlights the significance of electroneutrality effects for the nanometric interfaces of biopolymers. Indeed, since the Debye length (i.e. the range of charge inhomogeneities in solution) is of the order of a nanometer, strong electric fields can appear locally and trap ions in a very confined space. Moreover, this physical picture explains the influence of shape complementarity: The interface is then large enough (relative to ) and the gap thin enough to trap cations within a small volume.
To what extent do real DNA-BPs trap ions between their surface and DNA? To answer this question, we perform a statistical analysis of the protein interface charge densities and complementary surface areas, on a data set of 77 proteins. The charge densities of those proteins are not directly available, but DNA-BPs are characterized by conserved propensities of charged residues at the interface region, as defined in Ref. [18]. For each protein in the data set, we evaluate the total number of residue , and the number of residue for the charged residues (= Arg, Lys, Asp and Glu). Ref. [18] and Ref. [2] provides , the number of residues at the interface. We estimate the charge densities of the proteins by approximating the propensity of a residue by , and this leads to the number of residues at the interface and thus the number of charges. We take a mean interface area per residue of nm2 [19] to derive the mean charge density . In the case of sequence-specific DNA-BPs such as transcription factors and restriction enzymes, we obtain . Besides, we notice that the less-specific DNA-BPs (polymerases, DNA-repair proteins, histones) are more charged (). The area of the fitting interface nm2 is similar for all DNA-BPs [1]. According to these structural features, DNA-BPs should thus be repelled by DNA (cf. Fig. 2). This repulsion obtained with a coarse-grained model is in agreement with simulations of atomic models of BamHI [20], showing a repulsion when the concave surface of the protein approaches DNA.
To assess whether this repulsion is still significant after addition of a realistic short-range attraction, we include H-bond interactions and study the resulting free energy as a function of the protein position along the sequence and the distance between the surfaces. We consider a DNA-BP model of charge with a fitting shape. We account for each H-bond by a Morse potential term with kBT [21] and nm-1 [22]. Crystal structures of protein-DNA complexes provide a value of the number of H-bonds at the specific site ( H-bonds for nm2 [2]). We assume that the number of H-bonds that the protein can make on non-specific DNA follows a Gaussian distribution of average , and standard deviation . The value of is low because the number of H-bonds dramatically decreases for non specific sequences, even for sequences with a high degree of homology to the target one, as observed in the crystal structure of non cognate BamHI complex in Ref. [5].

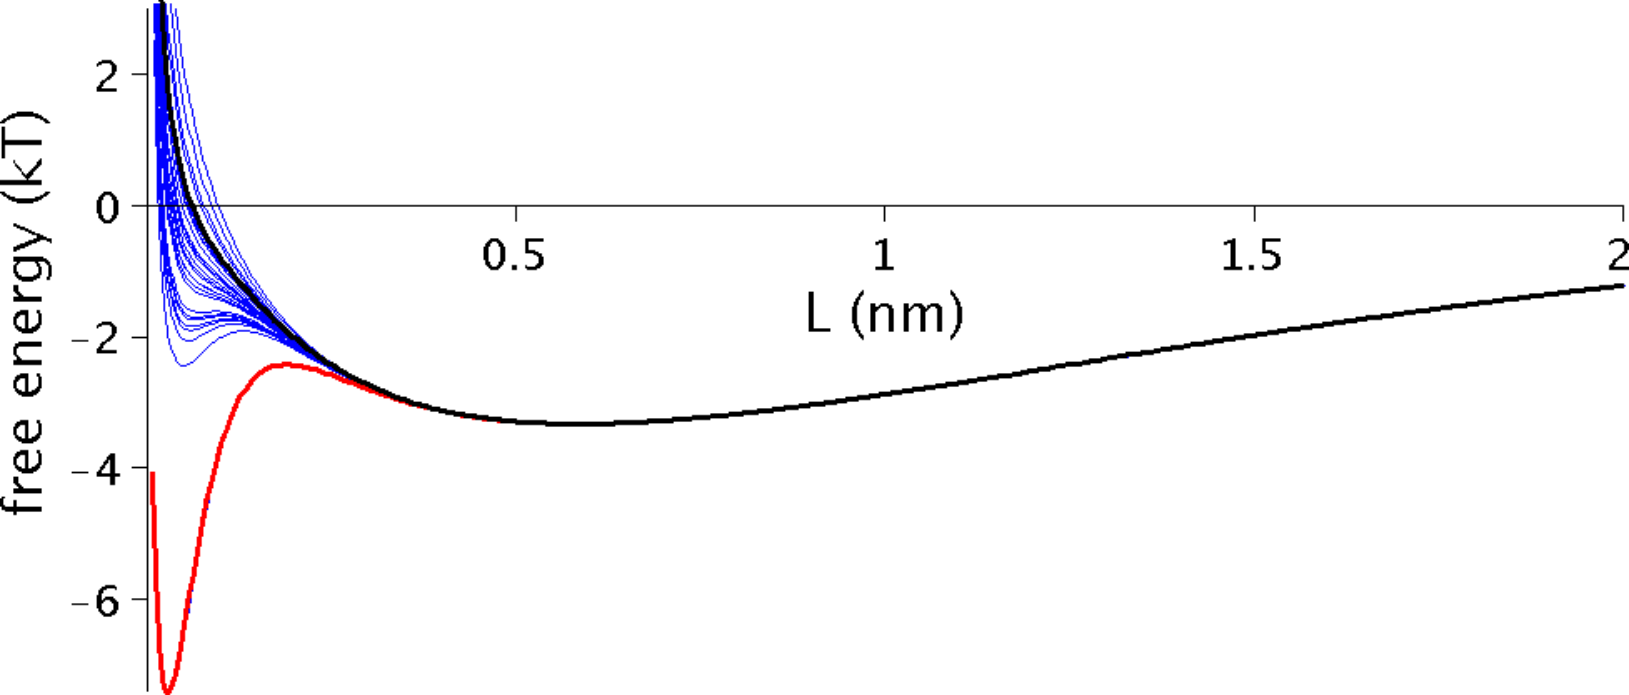
The resulting free energy landscape is shown in Fig. 4. Remarkably, the osmotic repulsion between sequence-specific DNA-BPs and DNA dominates along non-specific sequences. The equilibrium gap distance of nearly nm is in agreement with the distance observed in the complexes of EcoRV ( nm [1]) with non-specific sequences. Interestingly, along the equilibrium valley, the roughness of the sequence-dependent part of the potential is screened out: The protein can therefore easily slide along DNA. At the target site, the large H-bond interaction significantly reduces the barrier, and the protein can approach the DNA.
Our results unravel a subtle balance between long-range electrostatic attraction, short-range osmotic repulsion and short-range attraction. This effect is sensitive to the shape and charge of DNA-BPs, and should have thus contributed to the structural evolution of those proteins. From a dynamical perspective, our model provides new bases to conciliate the dual requirement of high protein mobility and high sequence sensitivity [23, 24, 25]. Indeed, the latter is usually assumed to slow down the protein diffusion [26, 27]. According to our results, the DNA-BP freely diffuses along non-specific DNA, confined in an electrostatic free energy valley. The free energy barrier, which keeps the protein at a distance from DNA, is also a signature of the sequence: Transverse thermal fluctuations enable the protein to cross the barrier only at the specific site or at highly homologous sequences. This recognition mechanism is efficient because it does not require the protein to probe the molecular details of non-specific DNA sequences. The implications of such a behavior on the protein 1D diffusion along DNA recently observed both in vitro and in vivo [28, 29, 30, 7] will be the goal of future investigations.
References
- [1] S. Jones, P. van Heyningen, H.M. Berman, and J.M. Thornton. J. Mol. Biol., 287:877–896, 1999.
- [2] K. Nadassy, S. J. Wodak, and J. Janin. Biochemistry, 38(7):1999 2017, 1999.
- [3] P. H. Von Hippel. Annu. Rev. Biophys. Biomol. Struct., 36:79–105, 2007.
- [4] Y. Takeda, P. D. Ross, and C. P. Mudd. Proc. Natl. Acad. Sci. USA, 89(17):8180–8184, 1992.
- [5] H. Viadiu and A. Aggarwal. Molecular Cell, 5:889, 2000.
- [6] C.G. Kalodimos and et al. Science, 305:386–389, 2004.
- [7] J. Gorman and E.C. Greene. Nature Structural and Molecular Biology, 15:5752–5757, 2008.
- [8] J.-P. Hansen and H. Löwen. Annu. Rev. Phys. Chem., 51:209, 2000.
- [9] E. Allahyarov, I. D’Amico, and H. Löwen. Phys. Rev. Lett., 81:1334, 1998.
- [10] V. Dahirel, M. Jardat, J.-F. Dufrêche, and Turq P. Phys. Chem. Chem. Phys., 10:5147 – 5155, 2008.
- [11] V. Dahirel, M. Jardat, J.-F. Dufrêche, and Turq P. Phys. Rev. E, 76:040902, 2007.
- [12] V. Dahirel, M. Jardat, J.-F. Dufrêche, and Turq P. J. Chem. Phys., 127:095101, 2007.
- [13] The Debye length is defined by =, where is the concentration of microion , the corresponding valence and the Bjerrum length equals .
- [14] H. Ohshima. Colloid and Polymer Sci., 253:150–157, 1975.
- [15] F. Paillusson, M. Barbi, and J.M. Victor. cond-mat, arXiv:0902.1457v1.
- [16] S. Bhattacharjee and M. Elimelech. J. Colloid Interface Sci., 193:273, 1997.
- [17] D. Ben-Yaakov, Y. Burak, D. Andelman, and S. A. Safran. Europhys. Lett., 79:48002, 2007.
- [18] S. Jones, H.P. Shanahan, H.M. Berman, and J.M. Thornton. Nucleic Acids Research, 31:7189–7198, 2003.
- [19] E. W. Stawiski, L. M. Gregoret, and Y. Mandel-Gutfreund. J. Mol. Biol., 326:1065, 2003.
- [20] J. Sun, H. Viadiu, A. K. Aggarwal, and H. Weinstein. Biophys. J., 84(5):3317–3325, 2003.
- [21] D. Tareste, F. Pincet, E. Perez, S. Rickling, C. Mioskowski, and L. Lebeau. Biophys. J., 83(6):3675–3681, 2002.
- [22] Y. Chen, T. Kortemme, T. Robertson, D. Baker, and G. Varani. Nucl. Acids Res., 32(17):5147–5162, 2004.
- [23] I. Eliazar, T. Koren, and J. Klafter. J. Phys.: Condens. Matter 19:065140, 2007.
- [24] B. van den Broek, M. A. Lomholt, S.-M. J. Kalisch, R. Metzler, and G. J. L. Wuite PNAS, 105:15738–15742, 2008.
- [25] O. Bénichou, Y. Kafri, M. Sheinman, and R. Voituriez. cond-mat, arXiv:0901.4185v2.
- [26] M. Slutsky and L. A. Mirny. Biophys. J., 87:4021–4035, 2004.
- [27] M. Barbi, V. Popkov, C. Place, and M. Salerno. J. of Biol. Physics, 30:203–226, 2004.
- [28] D.M. Gowers, G.G. Wilson, and S.E. Halford. Proc. Natl. Acad. Sci. U.S.A., 102:15883–15888, 2005.
- [29] J. Elf, G.W. Li, and X.S. Xie. Science, 316:1191 – 1194, 2007.
- [30] I. Bonnet, A. Biebricher, P-L. Porté, C. Loverdo, O. Bénichou, R. Voituriez, C. Escudé, W. Wende, A. Pingoud, and P. Desbiolles. Nucleic Acids Research, 36:4118–4127, 2008.