Radio Emission from Supernova Remnants: Implications for Post-Shock Magnetic Field Amplification & the Magnetic Fields of Galaxies
Abstract
Using observational data from the literature, we show that the non-thermal radio luminosity () of supernova remnants (SNRs) is a strong function of the average gas surface density () of the galaxy in which the remnants reside, from normal spirals to dense luminous starbursts. Our result supports the interpretation of the radio sources in M82 and Arp 220 as normal SNRs, and not “radio” supernovae. We combine a simple theory for electron cooling in SNRs with their observed radio luminosities to estimate the remnant magnetic field strength (): the correlation between and implies that also increases with . We explore two interpretations of this correlation: (1) is generated by post-shock magnetic field amplification, with and (2) results from shock-compression of the ambient interstellar medium (ISM) magnetic field (), with being larger in denser galaxies. We find that shock compression is, on average, sufficient to produce the observed radio emission from SNRs in the densest starburst galaxies; amplification of post-shock magnetic fields is not required. By contrast, in normal spirals modest post-shock field amplification in some remnants (a factor of ) is consistent with the data; we find tentative evidence that both the Alfvén speed within SNRs and the ratio of to the post-shock pressure (“”) are constant in SNRs from galaxy to galaxy. We discuss observational tests that can be used to more definitively distinguish between these two interpretations of the radio luminosities of SNRs. Regardless of which is correct, the radio emission from SNRs provides an upper limit to that is independent of the minimum energy assumption. For the densest starbursts, the magnetic energy density in the ISM is below the total ISM pressure required for hydrostatic equilibrium; thus magnetic fields are not dynamically important on the largest scales in starbursts, in contrast with spiral galaxies like our own. This dichotomy may have implications for galactic dynamo theory.
Keywords:
ISM: supernova remnants — galaxies: magnetic fields, starburst — radio continuum: galaxies1 Introduction
The magnetic energy density of the Galaxy is in rough equipartition with both the cosmic ray and the turbulent energy densities. These components of the ISM combine to produce a midplane pressure sufficient to balance the self-gravity of the Galactic disk and thus to establish hydrostatic equilibrium (Boulares & Cox 1990). Moreover, direct probes of magnetic fields in dense star-forming regions within the Galaxy indicate that they may be dynamically important (Crutcher 1999). Because of the potential importance of magnetic fields for star formation on small scales, at and below the scale of giant molecular clouds, and for the structure and self-regulation of galaxies on their largest scales, it is of considerable interest to understand how the average magnetic field strength varies from normal galaxies to starbursts, where the ISM conditions are considerably different.
A rough upper limit to the average magnetic field strength in a galaxy can be constructed by assuming that the field is dynamically comparable to gravity. For a thin self-gravitating gas-dominated disk of average gas surface density , this “equipartition” field strength is
| (1) |
where is measured in g cm-2. provides an upper limit to on galactic scales because for the field is buoyant and escapes the host galaxy (Parker 1966). For galaxies like the Milky Way, in which the total surface density, , is dominated by stars, in equation (1) should be multiplied by a factor of . The measured gas surface densities of galaxies vary by more than 4 decades (e.g., Kennicutt 1998, hereafter K98). Over this range, equation (1) implies a maximum field strength of G for the Milky Way ( g cm-2; ) and mG in galaxies like Arp 220 that anchor the high-density end of the Schmidt Law with g cm-2 and (Downes & Solomon 1998).
Estimates of magnetic field strengths in galaxies are traditionally limited to the “minimum energy” assumption of Burbidge (1956), which posits an equality between the magnetic and cosmic ray energy densities (see Longair 1994; Beck & Krause 2005). This approximation works well in the Galaxy and other normal spirals where the field strength is also nearly equipartition in the sense of equation (1), but the minimum energy assumption likely underestimates the field strengths in starburst galaxies because of strong cosmic ray electron cooling (Condon et al. 1991; Chi & Wolfendale 1993; Thompson et al. 2006; hereafter [T06]).
One way to see that the minimum energy estimate must fail in ultra-luminous infrared galaxies (ULIRGs) like Arp 220 is to note that the inverse Compton (IC) cooling time for radio-emitting cosmic ray electrons is yr (e.g., Condon et al. 1991). The minimum energy estimate for the magnetic field strength yields a synchrotron cooling timescale at GHz frequencies that is times longer, and yet Arp 220 lies on the FIR-radio correlation together with essentially all star-forming galaxies (Condon 1992; Yun et al. 2001), which have synchrotron cooling times somewhat shorter than IC cooling times (e.g., Fig. 2 of T06). These facts imply that the true magnetic field strength in ULIRGs is considerably larger than the minimum energy estimate, and that rapid electron cooling invalidates the assumptions upon which that estimate is predicated.
This argument can be generalized and used to construct an empirically
derived minimum magnetic field strength in galaxies by equating
the magnetic energy density and the energy density in starlight
. Because the ratio determines the ratio
of synchrotron to IC cooling, and because normal galaxies and ULIRGs
lie on both the FIR-radio correlation and the Schmidt Law, must be larger than (or a constant fraction of)
, where is a stellar
IMF-dependent constant, is the flux, and is the star
formation rate per unit area.11
1
In principle, a factor of the
dust optical depth should be applied to in the densest
starburst galaxies, if the cosmic rays are co-spatial with the dense
molecular gas that is optically thick even in the FIR (see, e.g.,
Thompson et al. 2005). However, this correction is uncertain and for
the purposes of constructing a lower limit to based on , this expression suffices. Thus, the average magnetic field
strength must exceed
| (2) | |||||
where the numerical approximations follow from the observed Schmidt Laws of K98 (top) and Bouché et al. (2007) (bottom). is a lower limit to the mean field strength in galaxies because if , variations in from galaxy to galaxy would likely introduce scatter and non-linearity into the FIR-radio correlation (T06). For the Galaxy, G and for Arp 220, mG.
In this paper, we argue that radio observations of supernova remnants (SNRs) provide a complimentary probe of the ISM magnetic field strength in star-forming galaxies. In §2 we describe a simple synchrotron cooling model for the radio luminosity of an individual SNR. The radio flux depends critically on the magnetic field in the SNR, which is somewhat uncertain. At a minimum, a SNR must contain shock-compressed ISM magnetic field, which is constrained (on average) by the upper and lower limits of equations (1) and (2), respectively. However, the magnetic field in SNRs could be much stronger than the shock compressed ISM field if there is significant amplification in the post-shock plasma. We compare the remnant magnetic field strengths derived from the model presented in §2 with our expectations from equations (1) and (2), to set limits on the importance of field amplification in SNRs. We further argue that the radio emission from SNRs provides an upper limit on the ambient ISM field in star-forming galaxies. In §3 we show that the luminosity of SNRs is strongly correlated with the average gas surface density of the galaxy in which they reside. Using the model of §2, we invert these observations to constrain the remnant and ambient ISM magnetic field in this sample of galaxies. We discuss our results in §4, focusing on the relative importance of shock compression of ISM field versus post-shock field amplification.
2 Magnetic Fields in Supernova Remnants
To estimate the radio luminosity of a SNR, we assume that a fraction of the supernova kinetic energy ( ergs) is supplied to primary cosmic ray electrons in the shock and that the accelerated electrons radiate synchrotron in a magnetic field of strength . We further assume that the electron particle spectrum is flat, with a power-law index of (), as is expected theoretically for strong shocks (e.g., Blandford & Eichler 1987) and is observed in situ in some SN remnants (e.g., Aharonian et al. 2005; Brogan et al. 2005). A value of is required to explain the integrated radio flux from star-forming galaxies, i.e., the FIR-radio correlation (Völk 1989; T06). Given the small scatter in the FIR-radio correlation (Yun et al. 2001), is uncertain at the factor of level when averaged over many SNe in a galaxy. With these assumptions, the radio luminosity is simply (van der Laan 1962)
| (3) |
where is the synchrotron cooling timescale for electrons radiating at and where we have assumed that , where is the expansion time of the remnant. In the last estimate in equation (3) we have assumed ; variations in from affect this estimate by only a factor of .
Equation (3) is an estimate of the radio emission produced by the interaction between a SN and the ambient ISM, i.e., the emission from a SNR (e.g., Shlovskii 1960). The radio emission is expected to peak at the Sedov time and persist until the remnant cools radiatively (see the discussion of these timescales in §4). This time evolution is in contrast to radio supernovae which peak and decay after a month to few-years and which likely result from the interaction between a SN shock and the immediate circumstellar medium and pre-SN ejecta (e.g., Chevalier 1982; Weiler et al. 2002). Nearly all of the radio remnants discovered in M82 and Arp 220 that we discuss below do not vary appreciably on decade timescales (Kronberg et al. 2000; Rovilos et al. 2005). Rather than interpret these bright sources as bona fide radio SNe, we thus interpret them as normal SNRs.
Given an observed radio flux density, equation (3) can be inverted to estimate the magnetic field strength in the SNR, . Assuming that is ambient ISM field compressed by the SN shock by a factor of (appropriate for randomly-oriented fields; Völk et al. 2002 advocate for young remnants), we obtain a simple estimate of the ISM magnetic field strength in terms of the SNR flux density:
| (4) |
equivalent to . Equation (4) is most readily interpreted as an upper limit on the ISM magnetic field given a set of SNRs with flux density because (1) may be as large as and (2) turbulence and instabilities can in principle amplify the post-shock magnetic field. The SNR field may thus be larger than , but it is unlikely to be smaller.22 2 If SNe systematically sample only low magnetic field regions of a galaxy, inferred from SNRs may not be the same as the volume averaged magnetic field strength. This possibility cannot be ruled out, but we regard it as unlikely.


The assumptions made in deriving equation (4) include that (weak cooling) and that . Together, these assumptions imply that the synchrotron spectral index should be (). For , and fixed total energy injected in cosmic ray electrons, the normalization of equation (4) increases, but modestly: for , is larger by a factor of and . The spectral indices of GHz radio emission from SNRs range from (see the refs. in Table 1). Diversity in may signal diversity in , evolutionary effects, that the assumption of weak cooling is violated, or some combination. Additionally, note also that is not valid during the early free-expansion phase of SNR evolution.
A further assumption made in deriving equation (4) is that the supernova remnants are not radiative. If they were, could be arbitrarily high. Indeed, Chevalier & Fransson (2001) argued that the radio point sources observed in M82 and Arp 220 are radiative, but otherwise normal, supernova remnants (i.e., not “radio” SNe). As we show below and as we discuss in more detail in §4, the radio luminosities of the remnants in starburst galaxies are consistent with compression of the ambient ISM magnetic field by an adiabatic shock, perhaps together with modest post-shock field amplification. Much larger , as would be implied if the remnants were radiative, is inconsistent with independent constraints on the ambient ISM magnetic fields in these systems.
To provide some quantitative context for comparing the strength of the magnetic field in SNRs produced by flux freezing with that produced by possible amplification in the post-shock plasma, Figure 1 shows the post-shock magnetic field strength in SNRs as a function of time assuming that the post-shock remnant magnetic energy density is a factor times the post-shock pressure (as is often assumed in models of radio supernovae and gamma-ray burst afterglows; e.g., Reynolds & Chevalier 1981); we consider a range of ambient densities , from low densities appropriate to SNRs in the Milky Way to high densities appropriate to SNRs in Arp 220. For these calculations we have used the analytic approximations for the evolution of SNRs developed by Draine & Woods (1991), which include both the Sedov-Taylor and pressure-driven snow-plow phases. The post-shock magnetic field is the strongest during the free expansion phase and decreases during the Sedov-Taylor phase and later as the post-shock plasma pressure decreases. We note, however, that the appropriate value for is quite uncertain, and thus it is difficult to estimate from first principles the importance of post-shock field amplification (see Riquelme & Spitkovsky 2009 for a recent study).
3 Results
A large sample of radio SNRs is available in the literature. These SNRs reside in a variety of galaxies that span the full range of both the FIR-radio correlation and the Schmidt Law. In general, the remnants are identified using the VLA, MERLIN, or VLBI, and are distinguished from compact HII regions by their steep non-thermal spectra (). The few “radio SNe” proper that appear in the compilations of SNe presented in the references in Table 1 are excluded. These include remnant 41.95+57.5 in M82 from Kronberg et al. (1985) (see Kronberg et al. 2000) and SN 2000ft in NGC 7469 (Colina et al. 2001; Alberdi et al. 2006). Background objects such as AGN behind nearby galaxies like NGC 5194 are a contaminant to the SNR sample (see Table 1).
Figure 2 shows the luminosity of observed SNRs as a function of the average gas surface density of the galaxy in which they reside. For simplicity, all fluxes have been scaled to a frequency of 1.4 GHz assuming , even in those cases where is known empirically in some frequency range. References, assumed distance, number of remnants, maximum and average SNR luminosity, and the sensitivity, frequency, and resolution of the observations are given in Table 1. For all of the galaxies we consider, the remnants account for just a few to ten percent of the total non-thermal continuum. Each vertical line in Figure 2 is a separate galaxy (or, for Arp 220, component). The filled square shows for the brightest single SNR. The line for each system extends to the lowest luminosity remnant identified. The horizontal line shows the average luminosity of the observed SNR distribution. A similar figure was constructed by Hunt & Reynolds (2006).
A strong correlation is evident between and . A simple power-law fit to the average SNR luminosities (horizontal bars) gives
| (5) |
A similar fit is found for the brightest SNRs (filled squares), but with a normalization of 36.48 and a slope of 0.78. It is also clear that the lowest SNR luminosities exhibit a correlation with that is qualitatively similar to that of the average and brightest SNRs.
The latter raises the concern that the results of Figure 2 may represent a selection bias rather than a physical effect. The correlation between the maximum SNR luminosity and in Figure 2 is the most secure and is not subject to an obvious bias. In particular, although faint remnants in high- galaxies (which are rarer and thus tend to be more distant) would be undetectable, bright remnants could be readily seen in nearby low- systems, but are not. On the other hand, the correlations between the average and lowest remnant luminosity and are more subject to the obvious bias that faint remnants are difficult to detect in all galaxies. One might anticipate that this bias would be particularly severe for higher galaxies and could account for the absence of low luminosity remnants in these systems. One indication that this effect does not significantly affect our calculation of the average SNR luminosity is that nearly all of the detected remnants in M82, at a distance of 3.6 Mpc, are more luminous than even the brightest remnant in NGC 300 at a distance of 1.9 Mpc (see Table 1). An additional piece of information comes from comparing the samples of Muxlow et al. (1994) with Fenech et al. (2008) for the remnants in M82. The latter are three times more sensitive than the former, and yet, comparing the two datasets we see that the average SNR luminosity decreases by just a factor of , from to . A detailed comparison of the luminosity function of detected SNRs in all galaxies in this sample would be useful both for exploring the density and magnetic field distribution of the ISM (§4.3), and for a more detailed understanding of the selection effects at low remnant luminosity. Finally, we note that an additional reason that the lowest luminosity SNRs correlate with is that detectable remnants must be brighter than the diffuse radio continuum of their host galaxy, which is larger in high- galaxies as a result of the Schmidt Law (; K98; ; Bouché et al. 2007) and the FIR-radio correlation.
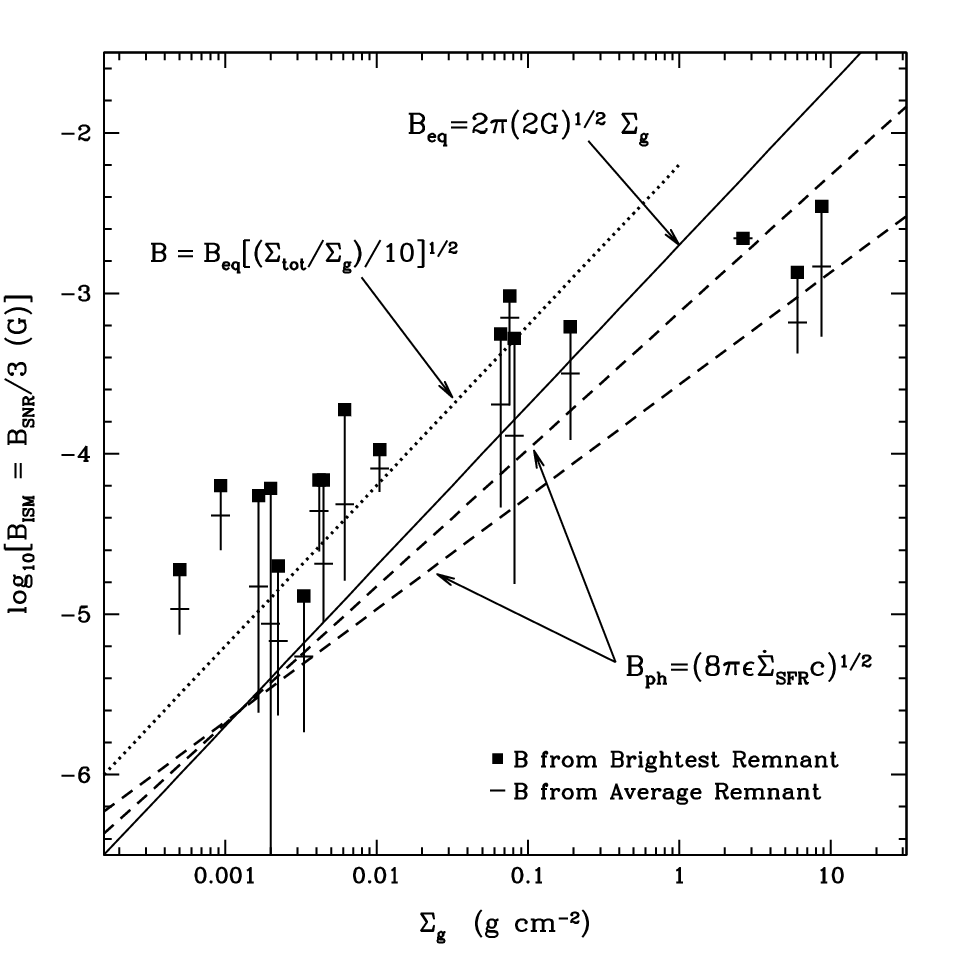
From the observed luminosities in Figure 2, we can infer the SNR magnetic field under the assumptions of equations (3) and (4). To compare this magnetic field estimate with other constraints on the ISM magnetic field, we plot these results in Figure 3 in terms of the ISM magnetic field strength , i.e., the ambient ISM field strength that would produce a SNR field strength of by flux freezing. The correlation in Figure 2 combined with equation (4) implies that and are strong functions of . A simple linear least-squares fit to the data points for the average SNRs (horizontal bars) gives
| (6) |
For the brightest SNRs the relation is similar, but with normalization and slope 0.52. Note that for larger assumed , the correlation between and flattens (see the discussion after eq. 4). Figure 3 demonstrates that for normal spirals the magnetic field strength inferred from the average-brightness SNR is comparable to or larger than the equipartition field, (dotted line), and larger than the minimum magnetic field strength (dashed line; eq. 2); this is true up to g cm-2, which characterizes starbursts such as NGC 253 and M82. For the densest, most luminous starbursts in our sample (Arp 299 and the nuclei of Arp 220), is below and — at least for Arp 220 — comparable to . At the other extreme, for the lowest density systems in our sample, NGC 300 and NGC 4736, Figure 3 tentatively implies a trend of larger at low .
Because of the paucity of systems at very high in Figures 2 and 3, we searched the literature for additional high resolution radio observations of local starbursts and ULIRGs. Unfortunately, the existing observations are not yet at sufficiently high spatial resolution to unambiguously imply that single SNRs have been detected. For example, Momjian et al. (2006) found 10 compact radio sources in the ULIRG IRAS 17208-0014. Most have deconvolved sizes at half maximum of pc. At a distance of Mpc (), it is unclear if these compact sources are indeed individual SNRs, rather than unresolved populations of multiple remnants. In addition, the spectral indices of these sources are unknown, and many may be bright HII regions. A single source is unresolved, with a linear scale pc. This is also the least luminous source with Jy. Given the gas surface density from K98 ( g cm-2), this individual source would lie above the single Arp 299 remnant (see Table 1) in Figure 2 by a factor of roughly two. Similarly, recent observations of IRAS 23365+3604 and IRAS 07251-0248 have been reported by Romero-Cañizales et al. (2008). They reveal a number of compact radio components. However, because these galaxies are at distances of and Mpc, respectively, the resolution of the observations is again insufficient to associate individual sources with single SNRs. Comparing with the observations of the nuclear sources in Arp 220 by Lonsdale et al. (2006), we expect that the sources detected by Romero-Cañizales et al. (2008) are likely to be collections of SNRs per source. Higher resolution studies can confirm or exclude this possibility. Taking the sources from Romero-Cañizales et al. (2008) at face value, and estimating the gas surface density of these ULIRGs from the literature, both systems would lie significantly above the solid line () in Figure 3, and they would deviate markedly from the trend seen in Figure 2.


4 Discussion
Figure 2 demonstrates that SNR luminosities are a strong, and fairly continuous, function of , the average (galaxy-wide) gas surface density of their host galaxy. There may be a change in the correlation for g cm-2, but more observations of SNRs in dense starbursts are required to assess this. In the following, we consider two plausible interpretations of this data: (1) the luminosity of a SNR is significantly larger in denser galaxies because the ambient magnetic field is significantly larger (as in Fig. 3), or (2) SNRs are brighter in denser galaxies because the magnetic field in the post-shock plasma scales as and is thus larger in galaxies with a denser ISM (larger ).
4.1 Field Amplification
Recall that (eq. 2, dashed lines in Fig. 3) is a lower limit to the true average ISM magnetic field strength because for IC losses dominate synchrotron losses and one expects a systematic deviation from the FIR-radio correlation at high FIR luminosities, which is not observed (T06). In addition, the magnetic field inferred from SNRs, (eq. 4, points in Fig. 3) is an approximate upper limit to because post-shock turbulence and instabilities can amplify magnetic fields in SNRs (Völk et al. 2002; Berezhko et al. 2006). It is striking that the upper and lower limits on coincide to within a factor of few for high starburst galaxies, particularly given the maximum equipartition magnetic fields these galaxies could support (, eq. 1). This correspondence implies that shock compression of is sufficient to power SNR radio emission in dense starburst galaxies.
For the specific case of Arp 220, our inferred ISM magnetic field strength of mG is also reasonably consistent with the direct Zeeman detections of Robishaw et al. (2008); thus three independent observational methods, each likely probing somewhat different phases of the ISM, all imply that a magnetic field of a few mG pervades the nuclear region of Arp 220. A corollary of this is that Figure 3 provides strong evidence for the interpretation of the radio point sources in Arp 220 as normal SNRs expanding into a highly-magnetized ISM; this alleviates the need for bona fide radio SNe to generate the very high luminosities observed (Smith et al. 1998; Rovilos et al. 2005; Parra et al. 2007; see also Chevalier & Fransson 2001).
In contrast to starbursts like Arp 220, in normal spirals independent observations constrain the ambient ISM magnetic field to be G (e.g., Beck 1982; Fitt & Alexander 1993; Beck & Krause 2005). Compressing this field by a factor of results in a magnetic field of sufficient strength to explain the typical radio SNR observed in normal spirals (Fig. 3); it appears, however, that the brightest remnants require fields that are a factor of few larger (and perhaps more at the lowest surface densities), either because the SNe explode in a region of larger-than-average or because of modest post-shock field amplification. Nonetheless, as in the case of starbursts, Figure 3 implies that significant post-shock magnetic field amplification (say ) is not required to explain the average radio luminosities of SNRs in spiral galaxies.
In our own Galaxy, there is some evidence for magnetic field amplification in young shell-type SNRs (e.g., Völk et al. 2002; Völk et al. 2005; Berezhko et al. 2006). In these models, individual Galactic SNRs are observed and modeled at a moment in their evolution, in contrast to the statistical approach taken here. For example, Völk et al. (2005) constrain G in Tycho’s SNR by fitting the broadband X-ray and radio emission simultaneously. Using in equation (4), and using only the radio data, we find that in the remnant is G.33 3 This is for an adopted distance to the Tycho SNR of 2.4 kpc (from the Green catalog; see Table 1). We have also compared the results from Völk et al. (2005) with our calculation for the SNRs RCW 86, SN 1006, and Cass A. We find that , 4, and 180 G, whereas Völk et al. find , , 500 G, respectively. The difference in the inferred SNR field between Völk et al. and this work lies partially in the assumptions about the energy in relativistic electrons, encapsulated in our parameter in equations (3) and (4). In order to not over-produce the radio luminosity with such a large , Völk et al. (2006) decrease the cosmic-ray electron-to-proton ratio, effectively using a small value of . In contrast, the normalization of the FIR-radio correlation, which we use here to normalize the emission from all individual SNRs, requires that when averaged over a suitably large number of remnants. We expect that shock accelerated electrons will have a total energy equivalent to by the onset of the Sedov-Taylor phase, when the shocked, swept-up mass is comparable to the ejecta mass. If shock acceleration only becomes efficient very late in a remnant’s evolution — or if the electrons rapidly diffuse out of the remnant on a timescale comparable to the Sedov-Taylor time — then the assumption of may be unreasonable for a typical remnant. Although more definitive calculations are required to assess these possibilities, we regard both of them as unlikely and thus conclude that the majority of observed remnants can be interpreted assuming . In this case, although individual remnants, at particular moments in time, may have fields larger than that due to compression alone, Figure 3 suggests that this is not a significant effect for SNRs in starbursts, or for the average SNR in most normal spirals.
A SNR could in principle generate magnetic fields in approximate equipartition with the post-shock thermal pressure of the gas: where is the density of the ISM in which the SN explodes and is the velocity of the SN shock at a given time (this assumption is often used in radio SNe and -ray burst models; e.g., Chevalier 1982; Meszaros & Rees 1997); see Figure 1 for estimates of the magnetic field strengths in SNRs if significant post-shock field amplification indeed occurs. In this interpretation, the higher remnant luminosities in denser galaxies (Fig. 2) are due to the post-shock scaling , rather than anything about the magnetic field in the ambient ISM.
Adopting the interpretation that post-shock magnetic field amplification is solely responsible for generating and the observed radio emission, Figures 2 and 3 have several interesting implications. Taking a constant gas scale height of pc for all galaxies, so that the average ISM density is , Figure 3 implies that , i.e., there is a constant characteristic Alfvén speed in all observed remnants.44 4 Although the assumption of constant gas scale height across all galaxies in the sample is a reasonable first approximation, they may have systematically smaller at higher , which would tend to flatten the function (see eq. 7). The left panel of Figure 4 shows this explicitly. Here, we have plotted as a function of , assuming a constant gas scale height. A fit to the average SNRs gives
| (7) |
For the brightest remnants, the normalization is higher () and the slope is flatter (). In Figure 4, is calculated assuming that the SNR density is , appropriate for a strong adiabatic () shock expanding into the ISM. If, as we discuss in §4.3, supernovae tend to sample low density regions of the ISM, the implied would increase, probably by a factor of . Despite uncertainty in the overall normalization for , the left panel of Figure 4 shows that the Alfvén speed within remnants is roughly the same for all observed SNRs in all galaxies; if magnetic field amplification is at work in SNRs, this finding is an important clue to the physics.
This result can equivalently be presented as a constraint on , the ratio of the post-shock magnetic energy density to the post-shock pressure (see Fig. 1). The right panel of Figure 4 shows our determination of for the SNRs in our sample as a function of the average ISM gas density. For the average SNRs, we find that
| (8) |
For the brightest remnants, the normalization is considerably higher () and the slope is yet flatter (). The value of is proportional to , so the near-constancy of with is not surprising given the results for in the left panel of Figure 4. As with , we emphasize that the precise value of depends sensitively on whether or not supernovae explode in gas at the average ISM density. If, as is more likely, most of the volume is filled with gas 10 to 100 times less dense than (§4.3), the typical inferred value of would be .
Because the observations do not definitively favor either SN shock compression of ISM field or post-shock field amplification, we are unable to unambiguously determine which of these two possibilities is correct. An important testable difference between these two hypotheses lies in the dependence of the radio emission on shock velocity or SNR diameter . For shock compression alone, should be independent of while if , . Another way to state this result is that the two models predict different SNR surface brightness-to-diameter relations (the relation). For shock compression alone, while for , (in both cases assuming ; see also, e.g., Berezhko & Völk 2004). Observations of SNRs in the Milky Way find (Case & Bhattacharya 1998), much closer to the flux-freezing prediction, while observations of SNRs in M82 find (Huang et al. 1994), closer to the predictions of the field amplification model (see Urosev̌ić et al. 2005). For M82, the recent work by Fenech et al. (2008) finds a best fit of . Updated observational samples, particularly those that characterize SNRs in high-density regions, and more sophisticated theoretical models are needed to fully understand the implications of the relation and its connection to the correlation presented in Figure 2.
4.2 The Dynamical Role of Magnetic Fields
Another important conclusion from Figure 3 is that in the most luminous starbursts. This implies that magnetic fields are not dynamically important for hydrostatic equilibrium on large scales in these systems, in sharp contrast with spiral galaxies like our own. One possible explanation for this difference is that the lifetime of intense starbursts ( yrs) is significantly shorter than that of the relatively continuous star formation in normal spiral galaxies; there may thus be less time for dynamo processes to amplify the average ISM magnetic field.
Figure 3 also suggests that the magnetic energy density is comparable to the photon energy density in a wide range of systems, with , depending on the form of the Schmidt Law adopted (compare the two dashed lines in Fig. 3). This result is not as surprising as it might first appear because massive stars determine both the radiation field of galaxies and the energy and momentum injected into their ISM. The latter “feedback” can generate turbulence in the ISM, amplifying the magnetic field. Thompson et al. (2005) and Thompson (2008) have suggested a direct connection between turbulence in dense starbursts and by positing that radiation pressure from the absorption and scattering of stellar light by dust grains dominates the overall pressure support. The rapid diffusion of infrared photons in starbursts causes the medium to be gravitationally unstable (Thompson 2008) and, even in the absence of self-gravity, generates magnetohydrodynamic instabilities that can amplify magnetic fields directly (Turner et al. 2007). In addition, the momentum supplied to the ISM by stellar winds and SN explosions is comparable to that in photons. There are thus a number of sources capable of generating turbulent motions that could amplify magnetic fields to the levels inferred here. It is also worth noting that although for luminous starbursts in Figure 3, this does not necessarily imply that radiation pressure is dynamically unimportant; the dense gas in starbursts is optically thick even in the far infrared and thus the energy density of photons in the densest gas is larger than that in equation (2) by a factor of the dust optical depth (see footnote 1), which can be (e.g., Thompson et al. 2005).
4.3 SNR Luminosity Function
As a final comment, we note that a more sophisticated understanding of the SNR luminosity function is needed to provide a more quantitative interpretation of the data in Figures 2 & 3. For example, although equation (3) suggests that is independent of time, the radio luminosity of a given SNR will peak at its Sedov time and then decline when the remnant cools and the shock loses energy (the radio luminosity can decline more quickly if is short or if the relativistic electrons rapidly diffuse out of the remnant; see, e.g., van der Laan 1962; Baring et al. 1999; Berezhko & Völk 2004). If the average ISM magnetic field is volume-filling, and if SNe sample the medium fairly, taking an average density of Arp 220 of cm-3 and a SN rate of yr-1, we estimate that SNRs should be visible in the radio, which is at odds with the SNRs identified (e.g., Lonsdale et al. 2006). However, there is an important set of mitigating effects. First, calculations of high Mach number isothermal turbulence imply that for the conditions of Arp 220 the average medium is filled with gas with cm-3 (e.g., LeMaster & Stone 2008). Second, although the synchrotron cooling time is longer for lower ambient density (because of an assumed smaller ), and one might thus expect to see more remnants, the SNRs at are also physically larger: for cm-3 a remnant expands to pc by . For Arp 220, this is large enough that the SNRs would overlap on the sky and be resolved out by current VLBI observations. The radio luminosity function of SNRs is thus a convolution of the spatial variation of the ISM conditions into which SNe explode (e.g., variations in and ), the time-dependence of an individual remnant, and the sensitivity and resolution of the observation. A careful study of these effects might provide important constraints on the nature of the ISM — the statistics of the density field and its magnetization — in external galaxies. In addition, it would more quantitatively determine the importance of post-shock magnetic field amplification in SNRs, and how the average (or maximum) SNR luminosity is related to the host galaxy’s volume-averaged ISM magnetic field strength.
Acknowledgments
We thank Anatoly Spitkovsky, Boaz Katz, Roger Chevalier, Heinrich Völk, and the anonymous referee for comments that improved this paper. T.A.T. thanks José L. Prieto, Mark Krumholz, Scott Gaudi, and Paul Martini for useful conversations, Axel Weiss for providing data from M82 used to compute the average column density, L. Maddox for detailed discussion on radio sources in M51, and the Aspen Center for Physics where a portion of this work was completed. E.Q. is supported in part by NASA grant NNG06GI68G and the David and Lucile Packard Foundation. N.M. is supported in part by a Canadian Research Chair in Astrophysics.
References
- Aharonian et al. (2005) Aharonian, F., et al. 2005, A&A, 437, L7
- Alberdi et al. (2006) Alberdi, A., Colina, L., Torrelles, J. M., Panagia, N., Wilson, A. S., & Garrington, S. T. 2006, ApJ, 638, 938
- Allen & Kronberg (1998) Allen, M. L., & Kronberg, P. P. 1998, ApJ, 502, 218
- Baring et al. (1999) Baring, M. G., Ellison, D. C., Reynolds, S. P., Grenier, I. A., & Goret, P. 1999, ApJ, 513, 311
- Beck (1982) Beck, R. 1982, A&A, 106, 121
- Beck & Krause (2005) Beck, R., & Krause, M. 2005, Astronomical Notes, 326, 414
- Bender et al. (2005) Bender, R., et al. 2005, ApJ, 631, 280
- Berezhko & Völk (2004) Berezhko, E. G., & Völk, H. J. 2004, A&A, 427, 525
- Berezhko et al. (2006) Berezhko, E. G., Ksenofontov, L. T., Völk, H. J. 2006, A&A, 452, 217
- Blandford & Eichler (1987) Blandford, R., & Eichler, D. 1987, Phys. Rep., 154, 1
- Bouché et al. (2007) Bouché, N., et al. 2007, ApJ, 671, 303
- Boulares & Cox (1990) Boulares, A., & Cox, D. P. 1990, ApJ, 365, 544
- Brogan et al. (2005) Brogan, C. L., et al. 2005, ApJL, 629, L105
- Burbidge (1956) Burbidge, G. R. 1956, ApJ, 124, 416
- Case & Bhattacharya (1998) Case, G. L., & Bhattacharya, D. 1998, ApJ, 504, 761
- (16) Chevalier, R., A., 1982, ApJ, 259, 302
- Chevalier & Fransson (2001) Chevalier, R. A., & Fransson, C. 2001, ApJL, 558, L27
- Chi & Wolfendale (1993) Chi, X., & Wolfendale, A. W. 1993, Nature, 362, 610
- Chomiuk & Wilcots (2009) Chomiuk, L., & Wilcots, E. 2009, arXiv:0901.2919
- Christopher et al. (2005) Christopher, M. H., et al. 2005, ApJ, 622, 346
- Colina et al. (2001) Colina, L., Alberdi, A., Torrelles, J. M., Panagia, N., & Wilson, A. S. 2001, ApJL, 553, L19
- Condon et al. (1991) Condon, J. J., et al. 1991, ApJ, 378, 65
- Condon (1992) Condon, J. J. 1992, ARAA, 30, 575
- Crutcher (1999) Crutcher, R. M. 1999, ApJ, 520, 706
- Downes & Solomon (1998) Downes, D., & Solomon, P. M. 1998, ApJ, 507, 615
- Draine & Woods (1991) Draine, B. T., & Woods, D. T. 1991, ApJ, 383, 621
- Duric & Dittmar (1988) Duric, N., & Dittmar, M. R. 1988, ApJL, 332, L67
- Fenech et al. (2008) Fenech, D. M., Muxlow, T. W. B., Beswick, R. J., Pedlar, A., & Argo, M. K. 2008, MNRAS, 391, 1384
- Filipović et al. (2005) Filipović, M. D., Payne, J. L., Reid, W., Danforth, C. W., Staveley-Smith, L., Jones, P. A., & White, G. L. 2005, MNRAS, 364, 217
- Fitt & Alexander (1993) Fitt, A. J., & Alexander, P. 1993, MNRAS, 261, 445
- Gallimore et al. (2004) Gallimore, J., Baum, S., & O’Dea, C. 2004, ApJ, 613, 794
- Gieren et al. (2005) Gieren, W., Pietrzyński, G., Soszyński, I., Bresolin, F., Kudritzki, R.-P., Minniti, D., & Storm, J. 2005, ApJ, 628, 695
- Gordon et al. (1999) Gordon, S. M., et al. 1999, ApJS, 120, 247
- Greve et al. (2002) Greve, A., Tarchi, A., Hüttemeister, S., de Grijs, R., van der Hulst, J. M., Garrington, S. T., & Neininger, N. 2002, A&A, 381, 825
- Greve et al. (2006) Greve, A., Neininger, N., Sievers, A., & Tarchi, A. 2006, A&A, 459, 441
- Ho & Ulvestad (2001) Ho, L. C., & Ulvestad, J. S. 2001, ApJS, 133, 77
- Huang et al. (1994) Huang, Z. P., et al. 1994, ApJ, 424, 114
- Hunt & Reynolds (2006) Hunt, L., & Reynolds, S. 2006, Astron. Nach., 327, 448
- Hyman et al. (2000) Hyman, S. D., et al. 2000, AJ, 119, 1711
- Israel (1988) Israel, F. P. 1988, A&A, 194, 24
- Israel (1997) Israel, F. P. 1997, A&A, 328, 471
- Kennicutt (1998) Kennicutt, R. C., Jr. 1998, ApJ, 498, 541 (K98)
- Kronberg et al. (2000) Kronberg, P. P., et al. 2000, ApJ, 535, 706
- Lemaster & Stone (2008) Lemaster, M. N., & Stone, J. M. 2008, ApJL, 682, L97
- Lenc & Tingay (2008) Lenc, E., & Tingay, S. J. 2008, arXiv:0811.0057
- Longair (1994) Longair, M. S. 1994, High Energy Astrophysics (2nd ed.; Cambridge: Cambridge Univ. Press)
- Lonsdale et al. (2006) Lonsdale, C. J., et al. 2006, ApJ, 647, 185
- Maddox et al. (2006) Maddox, L. A., et al. 2006, AJ, 132, 310
- Maddox et al. (2007) Maddox, L. A., et al. 2007, AJ, 133, 2559
- Mathewson et al. (1983) Mathewson, D. S., et al. 1983, ApJS, 51, 345
- Mathewson et al. (1984) Mathewson, D. S., Ford, V. L., Dopita, M. A., Tuohy, I. R., Mills, B. Y., & Turtle, A. J. 1984, ApJS, 55, 189
- Mauersberger et al. (1996) Mauersberger, R., Henkel, C., Wielebinski, R., Wiklind, T., & Reuter, H.-P. 1996, A&A, 305, 421
- Mauersberger et al. (1996) Mauersberger, R., Henkel, C., Whiteoak, J. B., Chin, Y.-N., & Tieftrunk, A. R. 1996, A&A, 309, 705
- Meszaros & Rees (1997) Meszaros, P., & Rees, M. J. 1997, ApJ, 476, 232
- Momjian et al. (2006) Momjian, E., Romney, J. D., Carilli, C. L., & Troland, T. H. 2006, ApJ, 653, 1172
- Muxlow et al. (1994) Muxlow, T. W. B., Pedlar, A., Wilkinson, P. N., Axon, D. J., Sanders, E. M., & de Bruyn, A. G. 1994, MNRAS, 266, 455
- Neff et al. (2004) Neff, S. G., Ulvestad, J. S., & Teng, S. H. 2004, ApJ, 611, 186
- Pannuti et al. (2000) Pannuti, T. G., Duric, N., Lacey, C. K., Goss, W. M., Hoopes, C. G., Walterbos, R. A. M., & Magnor, M. A. 2000, ApJ, 544, 780
- Parra et al. (2007) Parra, R., et al. 2007, ApJ, 659, 314
- Parker (1966) Parker, E. N. 1966, ApJ, 145, 811
- Payne et al. (2004) Payne, J. L., Filipović, M. D., Pannuti, T. G., Jones, P. A., Duric, N., White, G. L., & Carpano, S. 2004, A&A, 425, 443
- Read et al. (1997) Read, A. M., Ponman, T. J., & Strickland, D. K. 1997, MNRAS, 286, 626
- Reynolds & Chevalier (1981) Reynolds, S. P., & Chevalier, R. A. 1981, ApJ, 245, 912
- Riquelme & Spitkovsky (2008) Riquelme, M. A., & Spitkovsky, A. 2008, arXiv:0810.4565
- Robishaw et al. (2008) Robishaw, T., Quataert, E., & Heiles, C. 2008, ApJ, 680, 981
- Romero-Cañizales et al. (2008) Romero-Cañizales, C., Ángel Pérez-Torres, M., & Alberdi, A. 2008, arXiv:0812.0760
- Rovilos et al. (2005) Rovilos, E., et al. 2005, MNRAS, 359, 827
- Shklovskii (1960) Shklovskii, I. S. 1960, Soviet Astronomy, 4, 243
- Smith et al. (1998) Smith, H. E., et al. 1998, ApJL, 493, L17
- Tarchi et al. (2000) Tarchi, A., et al. 2000, A&A, 358, 95
- Thompson et al. (2005) Thompson, T. A., Quataert, E., & Murray, N. 2005, ApJ, 630, 167
- Thompson et al. (2006) Thompson, T. A., et al. 2006, ApJ, 645, 186 (T06)
- Thompson (2008) Thompson, T. A. 2008, ApJ, 684, 212
- Troland & Heiles (1986) Troland, T. H., & Heiles, C. 1986, ApJ, 301, 339
- Turner et al. (2007) Turner, N., Quataert, E., & Yorke, H. 2007, ApJ, 662, 1052
- Ulvestad & Antonucci (1991) Ulvestad, J. S., & Antonucci, R. R. J. 1991, AJ, 102, 875
- Ulvestad & Antonucci (1997) Ulvestad, J. S., & Antonucci, R. R. J. 1997, ApJ, 488, 621
- Urošević et al. (2005) Urošević, D., et al. 2005, A&A, 435, 437
- van der Laan (1962) van der Laan, H. 1962, MNRAS, 124, 125
- Vlemmings (2008) Vlemmings, W. H. T. 2008, arXiv:0804.1141
- Voelk (1989) Voelk, H. J. 1989, A&A, 218, 67
- Völk et al. (2002) Völk, H. J., Berezhko, E. G., Ksenofontov, L. T., & Rowell, G. P. 2002, A&A, 396, 649
- Völk et al. (2005) Völk, H. J., Berezhko, E. G., & Ksenofontov, L. T. 2005, A&A, 433, 229
- Weiler et al. (2002) Weiler, K. W., et al. 2002, ARAA, 40, 387
- Weiß et al. (2001) Weiß, A., Neininger, N., Hüttemeister, S., & Klein, U. 2001, A&A, 365, 571
- Wills et al. (1997) Wills, K. A., et al. 1997, MNRAS, 291, 517
- Yun et al. (2001) Yun, M., Reddy, N., & Condon, J. 2001, ApJ, 554, 803
| System | a | b | c | d | e | Freq.f | Beamg | Sensitivityh | Refs. | Refs. |
| Name | (Mpc) | (1.4 GHz) | (1.4 GHz) | (GHz) | SNRs | |||||
| (ergs s-1) | (ergs s-1) | |||||||||
| NGC 300 | 1.9p | 17 | 0.00050 | 33.4 | 33.7 | 1.45 | 60 Jy | 1 | 2 | |
| NGC 4736 | 4.4 | 10 | 0.00093 | 34.3 | 34.5 | 1.45 | …q | …q | 3 | 3 |
| LMC | 0.053 | 21 | 0.0017i | 33.6 | 34.4 | 0.48 | 4′.3 | few mJy | 4,5 | 6 |
| Milky Way | …n | 38o | 0.0020 | 33.2 | 34.5 | … | … | … | 7 | 8 |
| M33 | 0.84 | 51 | 0.0022 | 33.1 | 33.8 | 1.42 | 7″ | 50 Jy | 9 | 10 |
| SMC | 0.065 | 23 | 0.0033j | 32.9 | 33.5 | 2.37 | 40″ | 0.4 mJy | 11 | 6 |
| NGC 6946 | 5.6 | 15 | 0.0042 | 34.3 | 34.6 | 1.4 | 2″ | 20 Jy | 12 | 10 |
| NGC 1569 | 2.2s | 23 | 0.0044 | 33.8 | 34.6 | 1.49 | 21 Jy | 13 | 10 | |
| M51 | 6.5 | 37 | 0.0062 | 34.4 | 35.2 | 1.4 | 22.5 Jy | 14 | 10 | |
| M83 | 7.3 | 4 | 0.011 | 34.7 | 34.9 | 1.4 | r | Jyr | 15 | 10 |
| NGC 253 | 3.2 | 11 | 0.067k | 35.3 | 35.9 | 5.0 | 40 Jy | 16 | 10,17 | |
| NGC 2146 | 14.5 | 3 | 0.076 | 36.1 | 36.3 | 1.6 | 35 Jy | 18 | 10,19 | |
| M82 | 3.6 | 37 | 0.081l | 34.9 | 35.9 | 5.0 | mas | 17 Jy | 20 | 21 |
| NGC 4945 | 3.8 | 8 | 0.19m | 35.6 | 36.0 | 2.3 | mas | 75 Jy | 22 | 23 |
| Arp 299 | 41 | 1 | 2.6 | 36.6 | 36.6 | 35 Jy | 24 | 10 | ||
| Arp 220E | 78 | 20 | 6.0 | 36.1 | 36.5 | 1.65 | Jy | 25 | 26 | |
| Arp 220W | 78 | 29 | 8.7 | 36.6 | 37.1 | 1.65 | Jy | 25 | 26 |
aDistance in Mpc.
bNumber of supernova remnants.
cAverage gas surface density.
dMean SNR luminosity. Each SNR luminosity is calculated assuming .
eMaximum SNR luminosity.
fFrequency of quoted flux density in SNR reference used to calculate SNR luminosity.
gMeasure of beamsize quoted in SNR reference.
hMeasure of sensitivity quoted in SNR reference. Typically RMS sensitivity per beam.
iCalculated using a total gas mass of M⊙ (Israel 1997)
and kpc.
jCalculated using a total gas mass of M⊙ (Israel 1997)
and kpc.
kSurface density scaled to K98, but with the conversion factor
advocated in Mauersberger et al. (1996a).
lTotal gas mass of starburst region M⊙ (Weiss et al. 2001),
with diameter pc, adjusted for Mpc.
mTotal gas mass within a radius of 12″( pc at Mpc)
is taken as M⊙ (Mauersberger et al. 1996b).
nAll distances from Green (2006); see also Case & Bhattacharya (1998).
oFrom Green catalog. Only “S”-type sources with unambiguous distances are
included. For comparison, using a sub-sample of the 20 SNRs from Case & Bhattacharya (1998)
that overlap with the Green catalog, we have compared the highest and average SNR luminosities
using distances from the former and the latter, respectively.
Both the highest SNR luminosity (Cass A) and the average SNR luminosity are
unchanged: and ,
respectively. However, for the full Green catalog of 38 sources (listed above),
decreases to ,
a factor of lower than the smaller sample of Case & Bhattacharya (1998).
pDistance from Gieren et al. (2005).
qValues not listed in reference.
rSee Maddox et al. (2006), their Table 1. The four sources listed are those with confirmed optical counterparts.
sDistance from Israel (1988).
References: (1) Pannuti et al. (2000); see also Payne et al. (2004); (2) Read et al. (1997); (3) Duric & Dittmar (1988); (4) Mathewson et al. (1983); (5) Mathewson et al. (1984); (6) Israel (1997); (7) fluxes from Green, D. (2006) (see http://www.mrao.cam.ac.uk/surveys/snrs/); see also Case & Bhattacharya (1998); (8) Boulares & Cox (1990); (9) Gordon et al. (1999); (10) K98; (11) Filipović et al. (2005); (12) Hyman et al. (2000); (13) Chomiuk & Wilcots (2009); see also Greve et al. (2002); (14) Maddox et al. (2007), including all sources steeper than , excluding sources 53 (the nucleus) and 104 (background; Ho & Ulvestad 2001); (15) Maddox et al. (2006); (16) Ulvestad & Antonucci (1997), see also Ulvestad & Antonucci (1991); (17) Mauersberger et al. (1996a); (18) Tarchi et al. (2000); (19) Greve et al. (2006); (20) Fenech et al. (2008), but see also Kronberg et al. (1985), Huang et al. (1994), Muxlow et al. (1994); Wills et al. (1997), and Allen & Kronberg (1998); (21) Weiss et al. (2001); (22) Lenc & Tingay (2008) (23) Mauersberger et al. (1996b); (24) Neff et al. (2004); (25) Lonsdale et al. (2006), and see also Rovilos et al. (2005), Parra et al. (2007); (26) Downes & Solomon (1998)