Composition, structure, and stability of the rutile TiO2(110) surface: oxygen depletion, hydroxylation, hydrogen migration and water adsorption
Abstract
A comprehensive phase diagram of lowest-energy structures and compositions of the rutile TiO2(110) surface in equilibrium with a surrounding gas phase at finite temperatures and pressures has been determined using density functional theory in combination with a thermodynamic formalism. The exchange of oxygen, hydrogen, and water molecules with the gas phase is considered. Particular attention is given to the convergence of all calculations with respect to lateral system size and slab thickness. In addition, the reliability of semilocal density functionals to describing the energetics of the reduced surfaces is critically evaluated. For ambient conditions the surface is found to be fully covered by molecularly adsorbed water. At low coverages, in the limit of single, isolated water molecules, molecular and dissociative adsorption become energetically degenerate. Oxygen vacancies form in strongly reducing, oxygen-poor environments. However, already at slightly more moderate conditions it is shown that removing full TiO2 units from the surface is thermodynamically preferred. In agreement with recent experimental observations it is furthermore confirmed that even under extremely hydrogen-rich environments the surface cannot be fully hydroxylated, but only a maximum coverage with hydrogen of about 0.6–0.7 monolayer can be reached. Finally, calculations of migration paths strongly suggest that hydrogen prefers to diffuse into the bulk over desorbing from the surface into the gas phase.
pacs
68.43.Fg, 68.43.Bc, 68.47.Gh, 82.65.+rI Introduction
Over the past years, the (110) surface of TiO2 in the rutile structure has become one of the most popular model systems for fundamental surface science studies of transition metal oxides.[1] It is the thermodynamically most stable crystal face of TiO2 and therefore represents the dominating facet of rutile crystallites.[2] Stoichiometric, single crystal (11) surfaces may be easily prepared, and most experimental surface science techniques can be applied without difficulties.[1] The interest in TiO2(110) surfaces is furthermore driven by many technological applications of TiO2, ranging from pigments, coatings, electronic devices, implants, gas sensors, photochemical reactions to catalysis. In all of them, the surface properties of TiO2 play a crucial role.[1]
One of the most important properties of TiO2 is that it can be easily reduced. The reducibility is essential for many applications of TiO2 in heterogeneous catalysis. Oxide-supported metal-based catalysts with TiO2 as part of the support often show a so-called strong metal–support interaction (SMSI).[3] Here, the catalytic properties of the supported metal clusters are profoundly modified by an incorporation of partially reduced TiOx into the boundary areas of the metal particles.[4] In many cases, the TiOx-decorated metal particles exhibit a much higher catalytic activity for hydrogenation reactions than the pure metal itself.[5]
One way to reduce the TiO2(110) surface is to remove surface O atoms. By this process, formally two neighboring Ti4+ ions of a vacancy change to a Ti3+ oxidation state. In ultra-high vacuum (UHV) experiments O vacancies are easily created either by electron bombardment, sputtering, or simply by annealing. The presence of O vacancies strongly increases the reactivity of the surface. Among the many investigated processes, probably the best studied surface reaction is the dissociation of water, which has been shown to occur at O vacancies,[6, 7, 8, 9, 10] whereas on the stoichiometric, well-annealed parts of the surface the water molecules stay mostly intact.[11, 12, 13] There is, however, a limit to what extend the surface can be reduced. Oxygen vacancy concentrations are typically in the order of several percent,[15, 12] but it is not possible to remove all surface O atoms, in contrast to, for example, the rutile SnO2(101) surface.[16, 17]
Alternatively, the TiO2(110) surface can be reduced by hydroxylation of the surface O atoms via adsorption of hydrogen. While on unreducible oxides, such as MgO, a heterolytic dissociative adsorption of H2 with H+ adsorbing on O2- and H- on the metal cations is preferred, it is more favorable for reducible oxides, such as TiO2, to form only OH- groups. In the latter case the excess electrons are transferred to the cations, thus reducing Ti4+ to Ti3+.
The interaction of hydrogen with TiO2(110), however, has been much less intensively investigated by surface science studies than the reduction by O depletion. This is rather surprising in view of the importance of TiO2 as catalyst component for hydrogenation reactions and the prospective application of TiO2 as photocatalyst for the decomposition of water. It has been shown that molecular hydrogen does not interact strongly with TiO2(110),[18, 19] while atomic hydrogen readily sticks to the surface O atoms.[19, 20, 21, 22] No Ti–H vibrations could be detected with high resolution electron energy loss spectroscopy (HREELS).[22] Interestingly, also the reducibility of TiO2(110) with hydrogen is limited. Recent scanning tunneling microscopy (STM) measurements[22] revealed that even after very high exposures to atomic hydrogen the surface cannot be saturated. Only a maximum coverage of about 0.7 monolayers could be achieved. The scattering of thermal energy He atoms (HAS) showed that the hydroxyl groups do not form an ordered overlayer.[19] Performing a thermal desorption spectroscopy (TDS) experiment by monitoring the He atom reflectivity of the surface while increasing the temperature (He-TDS), two distinct changes in the reflectivity at 388 K and 626 K were observed, which indicate structural rearrangements of the surface.[19] These rearrangements must involve the loss of the hydrogen atoms, since afterwards the surface was H–free, as seen by HAS and HREELS. However, in conventional TDS no desorption of H2, and only a very small amount of H2O was detected,[22] even after heating the surface up to 650 K. This led to the conclusion that the H atoms rather diffuse into the bulk than desorb from the surface.[22]
As for experiment, also theoretical studies of reduced TiO2(110) have mainly focused on O deficient surfaces. While the properties of O vacancies on TiO2(110) have been investigated extensively[23, 24, 25, 26, 27, 28, 29, 30, 31, 32, 33, 34, 35] (see Ref. 36 for a recent review), we are aware of only two recent studies addressing specifically the adsorption of hydrogen.[22, 37] The determination of binding energies, adsorption sites and some reaction barriers, however, was restricted in both cases to slabs with a (11) periodicity, thus assuming H coverages of one and more H atoms per surface unit cell.
Finally, next to the formation of O vacancies and the hydroxylation of the surface by hydrogen adsorption, also the interaction with water has to be taken into account. The adsorption of water, either molecular or dissociative, does not lead to a reduction of the surface. But since water is always present, even in well-controlled UHV experiments, one has to account for residual hydroxyl groups which affect other adsorption and reaction processes.[1] Water adsorption on TiO2(110) has been investigated extensively both experimentally and theoretically. Among the experimental studies the common view is that at all coverages water adsorbs molecularly on the ideal terraces of the TiO2(110) surface and only dissociates at defects.[1, 11, 12, 13] However, it should be noted that in all these experiments always a small amount of dissociated water was present as seen by XPS and HREELS and indicated by a high-temperature tail in TDS. These signatures were naturally attributed to water molecules dissociated at O vacancies, but it would be difficult to distinguish them from a situation in which water initially would adsorb dissociatively at very low coverages and molecularly afterwards as suggested by some early studies.[11, 14] In contrast to the consensus among the experimental studies the results from theoretical calculations are very contradictorily. Early investigations predicted water dissociation at all coverages in complete disagreement with experiment. Only in some more recent calculations partial dissociated or molecular structures of water were found to be lower in energy. Overall, the theoretical studies are almost evenly divided whether molecular, dissociative or a partial dissociative adsorption of water (strongly depending on the coverage) is predicted as the energetically most stable state.[38, 39, 40, 41, 42, 43, 44, 45, 46, 47]
The aim of the present paper is to explore the competition between the reduction of the TiO2(110) surface via O vacancy formation or hydrogen adsorption and the non-reductive interaction of the surface with water in a comprehensive and systematic way. For a series of surface models with different O defect configurations and for a wide range of both hydrogen and water coverages we determine the total energies and the fully relaxed atomic structures using first-principles density functional theory (DFT). In order to extend the zero temperature and zero pressure DFT results to relevant environmental situations, such as UHV or reaction conditions in heterogenous catalysis, and to identify the thermodynamically most stable surface structures and compositions depending on the experimental conditions, we assume that the surfaces are in thermodynamic equilibrium with a surrounding gas phase at a given temperature and finite partial pressures . To account for the exchange of oxygen and hydrogen between the surface and the gas phase, appropriate chemical potentials and are introduced.[48, 49, 50, 51] By minimizing the Gibbs free surface energy as function of the chemical potentials, surface phase diagrams of the most stable surface structure and composition are constructed depending on both temperature and partial pressures.[48, 49, 50, 51]
Within this context the main focus of the present study will be on the hydroxylated surface. In addition to the thermodynamic considerations we investigate the kinetic behavior of hydrogen atoms and water molecules on the TiO2(110) surface. Energy barriers for various surface processes related to the migration and desorption of hydrogen and to the dissociation of water are calculated. Our results support the recently proposed suggestion that hydrogen atoms, instead of being desorbed from the surface at higher temperatures, migrate into the bulk. In addition, we find a rather small barrier for water dissociation. However, in contrast to some previous studies, our results indicate that the molecular adsorption of water is preferred over dissociation in the monolayer coverage limit.
II Computational Approach
The DFT calculations for the different TiO2(110) surface structures, as well as the bulk and molecular reference energies, have been carried out using the Car–Parrinello Molecular Dynamics (CPMD) code.[52, 53] The gradient-corrected Perdew–Burke–Ernzerhof functional[54] PBE was used to describe the exchange and correlation effects. Vanderbilt ultrasoft pseudopotentials[55] were employed together with a plane wave basis set to represent the Kohn-Sham orbitals. A plane wave cut-off energy of 25 Ryd was sufficient to get well converged results for structures and energetics. In particular, increasing the cut-off to 30 Ryd changed the adsorption energies for water molecules by less than 0.02 eV. The Ti pseudopotential was constructed from an ionic 3 4 configuration, and the 3 and 3 semicore electrons were treated as full valence states. Since very large supercells were used (see below), the –point sampling was restricted to the –point. Spin polarization was included for all systems with an odd number of electrons and for all calculations with oxygen vacancies. All configurations were relaxed by minimizing the atomic forces. Convergence was assumed when the maximum component of the residual forces on the ions was less than 0.01 eV/Å.
With this computational setup we find for the optimized TiO2 bulk lattice parameters values of = 4.649 Å, = 2.966 Å and = 0.305, which compares very well to previous GGA calculations[24, 31, 32, 39, 44, 56, 57] and to experiment ( = 4.594 Å, = 2.959 Å and = 0.305, see Ref. 60).


For the calculation of the energetics of O vacancy formation as well as hydrogen and water adsorption, the total energies of the isolated O2, H2 and H2O molecules are needed. While H2 and H2O are reasonably well described within PBE/DFT, it is a well-known deficiency of all local and semilocal functionals (such as PBE) that they strongly overbind the O2 molecule.[61, 50, 27, 29, 30, 36] In our setup we find an O2 binding energy of 5.87 eV, which is about 0.4 eV lower than the fully converged PBE value of 6.24 eV,[54, 62] which is in turn about 1 eV larger than the experimental value[63] of 5.26 eV (with zero point vibrational energy removed in the harmonic approximation).
In order to circumvent errors introduced by a poor description of the O2 molecule, we do not employ the total energy of the O2 molecule from the DFT calculation as reference, but deduce it via a thermodynamic cycle from the total energies of the H2 and H2O molecules together with the experimental value of 2.51 eV[63] for the formation energy of water from H2 and O2 (also taking into account the corrections due to zero point vibrations). With this reference energy for the gas phase O2 molecule we obtain a formation energy of bulk TiO2 from metallic bulk Ti and O2 of 9.60 eV, which is in excellent agreement with the experimental formation enthalpy of 9.73 eV.[63]
The second problem we have to address is how reliable can we expect the DFT calculations to be when describing the reduced state of an insulator/semiconductor.[64] It is a well-known shortcoming of LDA and all commonly used GGA functionals that band gaps are substantially underestimated due to the insufficient cancellation of the self-interaction energy. With our setup we find a band gap for bulk TiO2 of 1.86 eV, which is in very good agreement with previous DFT calculations,[65, 23, 24, 25, 56] but is much smaller than the experimental value of 3.03 eV,[66] as expected. Upon reduction, defect states are created, which typically appear in the band gap region. In DFT calculations, however, due to the underestimation of the band gap, they might be placed erroneously into the conduction band. In such a case, a delocalized conduction band state and not the localized defect state would be occupied with electrons. In particular, this is partially true for O vacancies on TiO2(110). Experiment indicates that the O vacancies are responsible for a defect state about 0.7–0.9 eV below the conduction band edge.[67, 14, 68] A careful survey of the available literature data[36] showed, however, that in well converged GGA/DFT calculations this defect level is pinned at the bottom of the conduction band, giving rise to a defect state which is too delocalized.
The problem of both, the band gap and the position of the defect levels, could be cured to a large extend by employing hybrid density functionals.[26, 33, 36, 69] Unfortunately, for extensive studies using large supercells as required for the present purpose, they are computationally still very demanding even if localized basis sets are used. On the other hand, the review Ref. 36 surprisingly reveals that despite the problem of the correct position of the defect level, GGA/DFT calculations give quite good results for the energetics of the defect formation. While the best estimate for the O vacancy formation energy using a cluster model and the B3LYP hybrid functional is 2.7 eV (which relies on extrapolations to account for the finite cluster size and the limited atomic relaxation in this calculation, thus adding some uncertainty to this value),[36] the converged DFT result (using the generalized gradient functionals PW91, PBE or RPBE) is 3.0 eV.[36] It is in particular noticeable that despite the underestimation of the band gap and the too strong delocalization of the defect state, the DFT calculation overestimates the vacancy formation energy and thus underestimate the reducibility of TiO2.
In recent experiments it was shown that the dissociative adsorption of water at O vacancies (thereby forming two neighboring OH groups on the surface) does not change significantly the O vacancy induced defect state in the band gap (which was seen 0.9 eV below the conduction band edge).[70] Also for this hydrogen reduced state of the TiO2(110) surface (which can be viewed as adsorbing an H2 molecule on the defect-free surface instead of dissociating a water molecules at an O vacancy), Di Valenti et al.[69] found that the defect state is not separated from the conduction band in GGA/DFT calculations. Nevertheless, despite this problem of accurately describing the electronic structure, we will argue in the present paper that the GGA/DFT calculations still give quite reliable results for the energetics of reduced surfaces via hydroxylation, similar as we have seen for the surface reduction via O vacancy formation. In particular in the regime of higher H coverages, when the defect states start to interact and a defect band is formed which will gradually hybridize with the conduction band, the DFT calculations will be less and less hampered by the band gap problem.
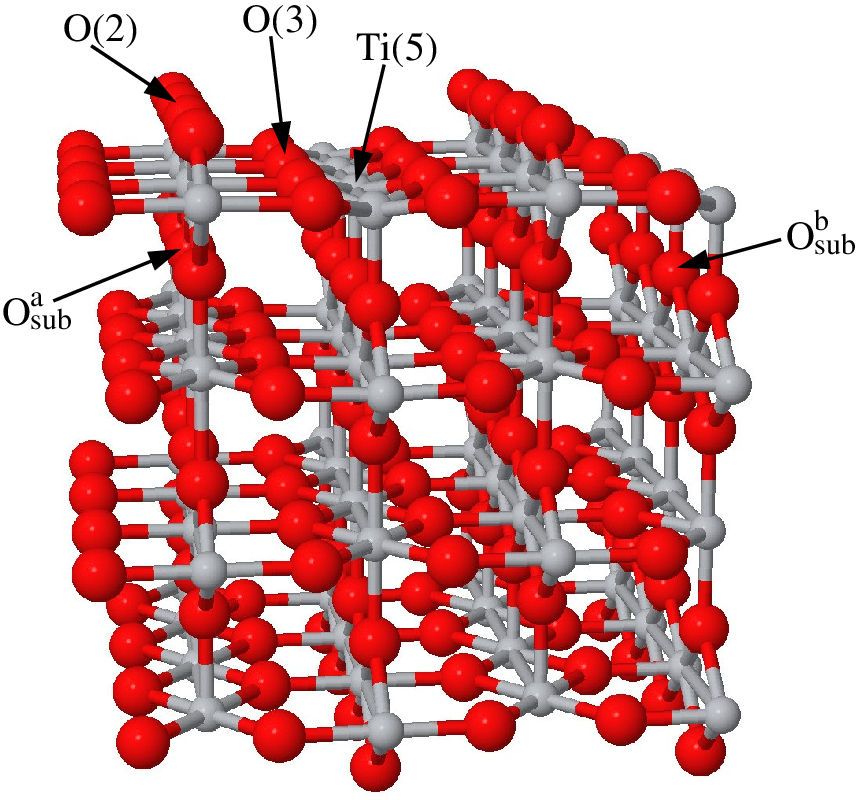
Figure 1 shows the atomic structure of the stoichiometric TiO2(110) surface. In our calculations all surface structures were modeled by periodically repeated slabs. Slabs for the stoichiometric (110) surface are built by a stacking sequence of trilayers with a composition of O–Ti2O2–O. In the bulk, the Ti and O ions are sixfold- and threefold-coordinated, respectively. At the surface this coordination is reduced and the characteristic feature of the (110) surface is the presence of rows of twofold-coordinated bridging O ions parallel to fivefold-coordinated Ti atom along the [001] direction. Using formal ionic charges of +4 and 2 for the Ti and O ions, respectively, the stoichiometric (110) surface would be charge neutral. From a more covalent point of view, the (110) surface, as shown in Fig. 1, is created by a cleavage of the crystal in which the minimum possible number of bonds has been broken.
The surface energy for the unrelaxed slabs converges very fast with slab thickness as shown in Fig. 2. After a full relaxation, however, the surface energy shows strong odd–even oscillations with the number of trilayers in the slab (see Fig. 2). A very large number of trilayers would be needed to get well converged results. These oscillations have been noted previously[2, 30, 56, 57, 58, 59] and are also present in plots of vacancy formation[29, 31, 58] and water adsorption energies.[44, 46, 47] The odd–even oscillations arise from the different symmetry of the slabs which leads to a significant change in the hybridization of the O 2 and Ti 3 states in the direction of the surface normal.[56] In slabs with an even number of trilayers the O–Ti hybridization causes a modulation of the coupling between the trilayers in such a way that a sequence of pairs of trilayers is formed in which the coupling of the trilayers within the pair is stronger than the interaction between pairs.[56] For slabs with an odd number of trilayers, in contrast, the atomic relaxations, which are associated with this pair formation, are suppressed by the central Ti2O2 mirror plane and the O–Ti hybrid orbitals become more delocalized over the whole slab.[56] The surface energy of the slabs with an odd number is higher and the convergence to the limit of infinite slab thickness is slower than when using an even number of trilayers. The odd–even oscillations can be largely reduced if not the full slab is allowed to relax. In Fig. 2 the surface energy is shown for a calculation in which the atoms in the bottom two trilayers were held fixed at their bulk positions. Using this setup, quite well converged results are already obtained with only four trilayers.
Based on this observation Thompson and Lewis[57] proposed to use such a slab setup of four trilayers with the bottom two layers fixed for any large scale calculation. However, the surface properties of a stoichiometric slab might be less influenced by the slab thickness than when it comes to reduced surface structures. States above the valence band (either defect states in the band gap or states from the lower edge of the conduction band) are more delocalized than the valence states and might be more sensitive to the truncation at the bottom of the slab. For example, Leconte et al.[37] have reported that for fully hydroxylated slabs with a thickness of two trilayers only 63% of the spin density is localized at the hydroxylated top surface layer, but 37% at the bottom of the slab. The fully hydroxylated surface is the highest reduced state which we will consider in our calculations (though, as we will show in Sec. III.2, this configuration is thermodynamically not stable). Even after fixing the atomic positions of the bottom two trilayers to the bulk positions, the hydrogen adsorption energy at monolayer coverage still shows a slow convergence and noticeable oscillations with slab thickness, as can be seen in Fig. 3.
Though TiO2 is a strong ionic insulator, the chemical bond has significant covalent contributions. It is therefore worth to think about the TiO2 surface in terms of broken surface bonds as one would do for covalent semiconductor surfaces.[71] Ti and O have four and six valence electrons, respectively. To fulfill the octet rule, each O atom receives 2/3 electrons from its three nearest Ti neighbors and Ti contributes 4/6 electrons to each of its six nearest-neighbor bonds. At the TiO2(110) surface the fivefold Ti and the twofold bridging O atoms have lost one of their nearest-neighbor atoms. Thus, dangling bonds are created which are occupied with 2/3 electrons for the fivefold Ti(5) and 4/3 electrons for the twofold O(2). At the stoichiometric surface the partial occupation of these dangling bonds is removed by autocompensation.[71] Alternatively, we saturate these broken bonds at the bottom of the slab by introducing artificial atoms with a nucleus charge of +4/3 and +2/3 which we place next to the Ti(5) and O(2) atoms, respectively, thus creating a more bulk-like environment for these surface atoms.[72] The distance between the pseudo-hydrogen and the surface atoms was determined by a geometry optimization in which all Ti and O atoms were kept fixed at the TiO2 bulk positions. The effect of saturating the broken surface bonds with the pseudo-hydrogen atoms on the electronic structure of the surfaces is illustrated in Fig. 4. Without saturation, the local density of states (LDOS) of the fixed Ti(5) and O(2) surface atoms (red dashed lines) deviates strongly from the bulk behavior (black solid lines). The surface band gap is reduced and strong changes and shifts in the LDOS peaks due to the autocompensation can be seen. After saturation of the broken surface bonds, however, the LDOS of the surface atoms (blue dashed-dotted lines) is almost indistinguishable from the bulk. With this saturation of the bottom of our slabs we find now also for reduced surface structures a much faster convergence of surface properties with slab thickness. The oscillations in the hydrogen adsorption energy in Fig. 3 have been reduced from 0.1 eV to about 0.02 eV per adsorbed hydrogen atom.
Based on these convergence tests we decided to use for all further calculations slabs with a thickness of four trilayers, including a saturation of the broken surface bonds at the bottom. The upper two trilayers were always fully relaxed while the atoms in the lower two layers were fixed at the bulk positions. A large (42) surface unit cell[73] was used in order to be able to study adequately the coverage dependence of hydrogen and water adsorption. The slab for the stoichiometric surface thus contained 208 atoms, including the artificial atoms for saturating the broken surface bonds at the bottom of the slab. The calculated equilibrium bulk values were taken for the lattice constants parallel to the surface. The slabs were separated by a vacuum region of about 13 Å thickness, which corresponds to the thickness of the slab itself. The surface relaxations of the stoichiometric surface are essentially the same as described by Thompson and Lewis[57]. As shown in Fig. 2, the relaxation energy of the surface is quite substantial. The unrelaxed surface energy is reduced by atomic relaxations from 1.64 eV (1.35 J/m2) by 1.21 eV to 0.43 eV per surface unit cell (0.36 J/m2). For comparison, the relaxation energy for the ZnO(100) surface amounts to only 0.37 eV per surface unit cell.[74] As we will see later on, these large surface relaxations have a strong impact on the coverage dependence of adsorption energies.
In order to analyze the thermodynamic stability of our different surface structures we assume that the surfaces can exchange O and H atoms with a surrounding gas phase. Assuming thermodynamic equilibrium, the most stable surface composition at a given temperature and pressure is given by the minimum of the Gibbs free surface energy .[48, 49, 50, 51] Since we are only interested in the relative stabilities of surface structures, we calculate directly the difference of the Gibbs free surface energy of the defective or adsorbate-covered and the stoichiometric, ideal surface according to
| (1) | |||||
where and are the Gibbs free energies of the modified and the stoichiometric reference surface configurations, respectively. is the surface area, , are the differences in the numbers of O and H atoms between the two surfaces, and , are chemical potentials representing the Gibbs free energy of the gas phase with which the O and H atoms are exchanged. According to this definition, is negative if the modified surface is thermodynamically more stable than the stoichiometric surface and positive otherwise. Assuming that all differences in entropy and volume contributions in are negligible,[50, 51] we approximate the Gibbs free energies and by their respective total energies of our DFT slab calculations as usual.[50, 51] Upper bounds for the chemical potentials and are given by the total energies of their most stable elemental phases,[49] that is, molecular oxygen and molecular hydrogen , respectively. These upper bounds are taken as new zero point of energy by introducing and . A lower bound for is given by minus half of the formation energy of bulk TiO2, i.e. (here and are the energies of one bulk unit cell of TiO2 and metallic Ti, respectively),[50, 51] for which we have taken the theoretical value of 4.80 eV from our PBE/DFT calculations. The chemical potential can be related to experimental temperature and pressure conditions by using experimental thermochemical reference data or by applying the ideal gas equation.[50, 51, 61]
| Vacancy type | singlet | triplet |
|---|---|---|
| O(2)–v | 3.07 | 3.02 |
| O(3)–v | 4.05 | 4.00 |
| TiO2–v | 1.03 |
The transition state search for the dissociation, desorption and migration processes was conducted with the nudged elastic band (NEB)[75] and the dimer method.[76, 77, 78, 79] Fully relaxed configurations were chosen as initial and final state of the NEB calculations. Throughout twelve images were used which were connected by springs with a fixed spring constant of about 20 eV/Å2. The two images in the dimer calculations were separated by 0.01 Å in configuration space and the trial steps for translation and rotation were 0.01 Å and 10∘, respectively. In all calculations first a good approximation of the transition path was determined with NEB which was then refined with a dimer method run for a precise location of the transition state.
III Results and Discussion
III.1 Oxygen Vacancies on TiO2(110)
We have investigated three different types of oxygen-related defects. Vacancies are created by removing a single bridging oxygen O(2) atom, a threefold-coordinated O(3) atom from the surface layer, or a full TiO2 unit of two neighboring bridging O(2) atoms and the underlying Ti cation, see Fig. 1. With our choice of (42) supercells this corresponds to a vacancy concentration of 1/8 monolayer and a defect separation of about 12 Å. The vacancy formation energies for the missing O(2) and O(3) atoms and the TiO2 unit are given by[80]
| (2) |
and
| (3) |
respectively, where , and are the total energies for the defective and the stoichiometric slab, respectively. The results in Table 1 show that the O(2) and O(3) vacancies are slightly more stable in the triplet than in the singlet state, in agreement with previous calculations.[25, 26, 29, 31] As one would expect from the local coordination, the formation of an O(2) defect is much more favorable than the O(3) vacancy. Our value for the O(2) vacancy formation energy of 3.02 eV is basically identical to the results of Rasmussen et al.[29] (3.03 eV) and Oviedo et al.[31] (3.07 eV, singlet state) who have both conducted extensive studies on the convergence of with defect concentration, slab thickness and the number of relaxed surface layers. Also Ganduglia-Pirovano et al.[36] came to the conclusion in their survey of the available literature data that the converged value for the formation energy of isolated O(2) vacancies in GGA/DFT calculations (using the PW91, PBE or RPBE functional) is about 3.0 eV. This supports that our choice of slab thickness, relaxation, bond saturation at the bottom of the slab, and size of surface unit cell is indeed appropriate to give well converged results.
In Fig. 5 the vacancy formation energies are plotted as function of the oxygen chemical potential of the environment. Assuming thermodynamic equilibrium of the surfaces with an O2 gas phase we have converted the chemical potential into a pressure scale for a temperature of 800 K and 1200 K using the ideal gas equation.[50, 51] Since we have neglected the entropy contributions to the Gibbs free energy of the defective and stoichiometric slabs, we cannot capture with our description the formation of thermal oxygen vacancies which are due to the gain in configurational entropy by the random distribution of the defects on the surface. Therefore, at lower temperatures we will always find the stoichiometric, defect-free surface to be the most stable one. We can only predict the appearance of structural vacancies which are formed if the gain in entropy by bringing oxygen into the gas phase outweighs the binding energy to the surface. Having this in mind we have to expect that we will overestimate the temperature at which significant amounts of O vacancies (in the percent range) will form. From Fig. 5 we see that at UHV conditions (base pressure of about 10-10 mbar) the onset for the formation of structural O(2) vacancies is around 1200 K (i.e., the chemical potential at which the vacancy formation energy becomes zero). This is in quite good agreement with experimental observations,[1] taking into account that an uncertainty of the vacancy formation energy of a few tenths of an eV from the DFT calculations translates into an error bar for this temperature in the range of 100–200 K. Rasmussen et al.[29] and Oviedo et al.[31] have shown that the interaction between the O(2) vacancies is strongly repulsive and that the O vacancy formation energy increases rapidly with higher defect concentrations. Thus, structures with higher O defect concentrations will appear farther to the left in the phase diagram Fig. 5 so that increasingly reducing conditions are needed to reach defect concentrations beyond a few percent.

On the other hand, quite surprisingly, we find that the formation energy for the TiO2 defects is much lower than for the O(2) and O(3) vacancies over a wide range of the O chemical potential. Already at temperatures around 800 K (at UHV conditions) it becomes thermodynamically more favorable to convert the O(2) vacancies into TiO2 defects. A similar result was recently obtained for the ZnO(100) surface,[80] where it was found that ZnO dimer vacancies are thermodynamically more stable than O vacancies for most experimental conditions. While for ZnO a strong suppression of O vacancies on the (100) surface can be expected, since Zn has a very low vapor pressure and can easily desorb from the surface (indeed, desorption of Zn is regularly observed in TDS experiments of ZnO), it is more difficult in the case of TiO2 to remove the Ti ions from the surface since the kinetics of the process will play a much larger role. However, one has to consider that the O vacancies, created on the TiO2(110) surface in UHV experiments by annealing, sputtering or electron bombardment, are only present due to kinetic limitations, and they will be eliminated under ambient conditions not only by a dissociative adsorption of O2 and water, but there is also a strong driving force to transform them into TiO2 vacancies, for example, by a mechanism in which Ti interstitials are created.[81]
| Config | E | Config | E | ||
|---|---|---|---|---|---|
| 1 | O(2) | 0.563 | 5 | 5H | 0.229 |
| O(3) | 0.062 | ||||
| Ti(5) | 2.217 | 6 | 6Ha | 0.143 | |
| 2 | O(2)+O(2) | 0.400 | 6Hb | 0.127 | |
| O(2)+O(3) | 0.142 | ||||
| O(2)+Ti(5) | 0.147 | 8 | 8O(2) | 0.033 | |
| 4 | 4Ha | 0.280 | 7O(2)+O(3) | 0.007 | |
| 4Hb | 0.215 | 7O(2)+Ti(5) | 0.013 | ||
| 4Hc | 0.211 | 7O(2)+O | 0.009 | ||
| 4Hd | 0.202 | 7O(2)+O | 0.012 | ||
| 4He | 0.128 |

III.2 Hydrogen Adsorption on TiO2(110)
In order to investigate the interaction of hydrogen with the TiO2(110) surface we have calculated the total energies of various hydroxylated TiO2(110) surface structures taking into account both, different hydrogen coverages and adsorption sites for the H atoms. Our results for the hydrogen adsorption energies per H atom
| (4) |
where is the total energy of the slab calculation with adsorbed H atoms, are summarized in Table 2. Single H atoms adsorb preferentially ontop of the bridging O(2) atoms, whereas the O(3) and Ti(5) sites are significantly higher in energy. The OH groups, which form upon H adsorption, do not remain upright but break the mirror symmetry of the surface by tilting about 20∘ (isolated OH groups) and up to 50∘ (hydroxylation of all bridging O atoms) with respect to the surface normal.
For pairs of H atoms we find that the homolytic adsorption on two neighboring O(2) sites (thereby reducing the surface) is more stable than the heterolytic adsorption on O(2) and Ti(5) (for the atomic configurations, see Fig. 6a). The heterolytic adsorption is even energetically unstable towards desorption of H2. This preference of the homolytic adsorption of hydrogen is expected for an easily reducible oxide. Table 2 also shows that the interaction between neighboring OH groups is repulsive. The adsorption energy per H atom decreases from 0.56 eV for isolated OH groups to 0.40 eV for neighboring OH pairs.
By comparing the energy of the surface structure with two neighboring OH groups to the structure with an O(2) vacancy, we can directly deduce the energy gain for dissociatively adsorbing a water molecule at isolated O(2) defects by applying a thermodynamic cycle. For the water adsorption energy at O(2) vacancies we find a value of 1.31 eV, which is slightly larger than previously reported results (0.94, 0.97 and 1.10 eV according to Refs. 7, 88, 8, respectively), but agrees well with an estimated value of about 1.4 eV deduced by a Redhead analysis[82] of a water desorption peak at 520 K in TDS experiment which was assigned to the recombination of neighboring OH groups.[70] According to our NEB calculations this process is without barrier[89] so that the activation energy for desorption is given by the adsorption energy. Since the previous calculations of Refs. 7, 88, 8 were done with (22) surface unit cells for which there is still significant interaction between O vacancies and pairs of hydroxyl groups (which can be seen, for example, from our results in Table 2), we attribute our slightly higher value for the binding energy of water at O vacancies to our larger (42) surface unit cell which represent better converged results with respect of describing isolated defects and OH pairs. It is interesting to see that we underestimate the binding energy of water in the O vacancies. Since the PBE/DFT calculations tend to overestimate the O vacancy formation energy,[36], this means that also the energy of the reduced surface via hydroxylation is slightly too high. Thus, as in the case of surface reduction via O depletion, also the reducibility of TiO2 via hydrogen adsorption is underestimated in the PBE/DFT calculations.

With increasing hydrogen coverage, O(2) remains the preferred adsorption site up to the coverage of a full monolayer. No significant amounts of H atoms will be adsorbed on O(3) and Ti(5) sites. Neighboring OH groups in the [001] direction tend to tilt in opposite directions (see Fig. 6a), whereas the coupling between [001] rows (concerning the tilt direction of the OH groups) is relatively weak (with a minor preference of the same tilt direction of OH groups in [10] rows). The ground state configuration of the fully hydroxylated surface, therefore, will have a (21) symmetry. However, since the barrier for flipping the orientation of an OH group is very small, they will be fully orientally disordered at room temperature.
Though O(2) remains to be the preferred adsorption site also with increasing H coverage, the adsorption energy per H atom, i.e. the feasibility to further reduce the TiO2(110) surface, decreases strongly upon adsorption of more hydrogen (see Fig. 7). At full monolayer coverage is still positive. However, if the interaction energy of hydrogen with the TiO2(110) surface is not expressed as binding energy per H atom but as energy gain per surface area it becomes obvious from the phase diagram Fig. 8 that the fully hydroxylated surface is thermodynamically unstable. The Gibbs free surface energy for a hydrogen monolayer (this also applies for the 0.75 ML coverage) is higher than the surface energies of lower coverages over the whole range of the hydrogen chemical potential. I.e., the energy of the fully hydroxylated surface can be always lowered by desorbing H2 molecules and reducing the H coverage. The highest coverage that can be reached in thermodynamic equilibrium in the limit of zero hydrogen chemical potential (i.e. at low temperature and high hydrogen partial pressure) is around 60%–70%. This is in excellent agreement with recent experimental observations where by exposing the TiO2(110) surface to atomic hydrogen no H coverage beyond 70% could be obtained.[22] The experimental setup of exposing the surface to atomic hydrogen is an almost ideal realization of the theoretical assumption underlying the calculation of the phase diagram Fig. 8, namely that the surface is in thermodynamic equilibrium with a surrounding H2 gas phase: no kinetic limitations are present and H atoms can adsorb and desorb without encountering any barrier.
In conclusion, this remarkable agreement between theory and experiment suggests that despite the problem of the band gap and the correct position of the defect levels (which we analyzed and discussed in Sec. II), the PBE/DFT calculations seem to be quite able to capture accurately the subtle balance between the energy cost to dissociate H2 molecules versus that of reducing the TiO2(110) surface.

III.3 Migration of Hydrogen Atoms
Upon heating the hydroxylated TiO2(110) surface a quite unexpected behavior was observed.[19, 22] Monitoring the He atom reflectivity of the surface revealed two distinct maxima at 388 K and 625 K (with a small shoulder at 560 K) at which the surface undergoes structural rearrangements. These rearrangements must involve the loss of H atoms since the surface is H–free above 650 K. When the Redhead formula[82, 83] with a frequency prefactor of 10-13 s-1 is applied, the two temperatures can be translated (with an uncertainty of about 20%) into activation barriers of 1.03 eV and 1.68 eV, respectively, for the processes which are involved in the structural changes. In a first assignment the two processes were assumed to be the desorption of hydrogen from the Ti(5) and O(2) sites[19], respectively. Based on our results on the hydrogen adsorption energy for the different surface sites, however, this interpretation can be clearly ruled out. Surprisingly, in a subsequent conventional TDS measurement, no desorption of H2 at all and only a very small amount of water could be detected. This led the authors to the conclusion that instead of desorption taking place, the H atoms migrate into the bulk.[22]
| Migration Path | ||
|---|---|---|
| O(2) O | 2.56 | |
| O(3) O | 0.93 | |
| Ti(5) O | 1.52 | |
| O(2) O(3) | 0.63 | |
| O(2) Ti(5) | 1.54 | |
| O(2) O(2) | 1.21 | |
| 2*O(2) H2(gas) | 1.85 |
Aiming at identifying the processes which lead to the structural changes of the surface and the loss of the H atoms we have calculated the activation barriers for different migration paths of H atoms on the hydroxylated TiO2(110) surface. Some of these migration paths have been considered already in a previous DFT study by Yin et al.,[22] in which, however, only the smallest possible (11) surface unit cell with two adsorbed H atoms was used. In our calculations we start from the fully hydroxylated surface with eight H atoms adsorbed ontop of the bridging O(2) atoms in a (42) surface unit cell. In the first step we examine how much the energy increases if one of the H atoms from the O(2) sites is placed ontop O(3), Ti(5), or subsurface. As we can see from Table 2 all three sites are energetically almost degenerate and only about 0.3 eV higher in energy than the O(2) site (note that the values in Table 2 are adsorption energies per H atom. Therefore, to get the energy difference between two structures with different arrangement of the H atoms, the values have to be multiplied by the number of adsorbed H atoms, i.e. eight, before subtracting the energies). This energy difference between the adsorption sites increases when the H coverage decreases. At 1/4 monolayer H coverage the O(3) and Ti(5) sites are higher in energy by 0.52 eV and 1.09 eV than the O(2) site, respectively (see Table 2).
Returning back to the fully hydroxylated surface we find that the transition barrier for migration of an H atom directly from an O(2) site to a subsurface O atom is quite high (see Table 3), whereas diffusion to the O(3) and Ti(5) sites is much more favorable. On the other hand, the activation energies for transferring an H atom from O(3) and Ti(5) to a subsurface O atom are moderate. Overall, the energetically most favorable migration path is from O(2) via O(3) to a subsurface site with barriers of only 0.63 eV and 0.93 eV, respectively. In contrast, we find for the desorption of H atoms from two neighboring O(2) sites via recombination and formation of H2 molecules an activation barrier of 1.85 eV. This implies that it is indeed much easier for the H atoms to diffuse into the bulk instead of desorbing from the surface. The activation barrier of 0.93 eV also corresponds nicely to the temperature of 388 K at which the onset of structural changes of the hydroxylated TiO2(110) surface was observed in the HAS experiments.[19] Altogether our results fully support the conclusions of Yin et al.[22] that H atoms from a hydroxylated TiO2(110) surface do not desorb but prefer to migrate into the bulk instead.
| Functional | Reference | mol | mix | diss |
|---|---|---|---|---|
| BP86[84, 85] | Ref. 38, 39 | 0.82 | 1.08 | |
| PW91[86] | Ref. 40 | 1.13 | 0.98 | |
| PW91[86] | Ref. 41 | 0.99 | 1.10 | 0.91 |
| RPBE[87] | Ref. 44 | 0.64 | 0.37 | |
| RPBE[87] | Ref. 45 | 0.52 | 0.53 | 0.34 |
| PW91[86] | Ref. 46 | 1.09 | 1.05 | 0.91 |
| PW91[86] | Ref. 47 | 1.01 | 0.95 | 0.90 |
| PBE[54] | this work | 0.82 | 0.77 | 0.63 |
| Functional | unit cell | Reference | mol | diss | |
|---|---|---|---|---|---|
| RPBE[87] | (22) | Ref. 7 | 0.56 | 0.23 | +0.79 |
| RPBE[87] | (22) | Ref. 45 | 0.36 | 0.56 | 0.20 |
| PW91[86] | (22) | Ref. 46 | 0.83 | 0.71 | +0.12 |
| PBE[54] | c(42) | Ref. 88 | 0.76 | 0.66 | +0.10 |
| RPBE[87] | (22) | Ref. 8, 9 | 0.66 | 0.79 | 0.13 |
| PBE[54] | (22) | this study | 0.82 | 0.75 | +0.07 |
| PBE[54] | (42) | this study | 0.93 | 1.04 | 0.11 |
III.4 Water Adsorption on TiO2(110)
From the experimental point of view there is a wide consensus that water adsorbs molecularly on defect-free terraces of the TiO2(110) surface.[1, 11, 12, 13] In XPS[11] and HREELS[12] measurements only small amounts of dissociated water could be detected under UHV conditions, which may be naturally linked to the presence of residual defects. In TDS[11, 12, 13] an intense desorption peak is observed at 270 K which could be attributed to the desorption of a full monolayer of molecularly adsorbed water molecules at Ti4+ sites based on XPS, HREELS and work function measurements. Interestingly, the peak position shifts to higher temperatures if the initial water coverage is lowered, indicating a repulsive interaction between the adsorbate molecules. This is unusual since for water molecules one would expect an attractive interaction due to the formation of hydrogen bonds, but the same behavior is also observed for the anatase (101) surface.[91] The TDS data could be best described by fitting them to a first-order kinetics model. Activation energies for desorption of (0.740.09 ) eV[11] and (0.730.07 ) eV[12] were obtained, whereas from a modulated molecular beam study[13] a value of (0.830.36 ) eV was deduced.
On the other hand, over the past years theoretical studies on the adsorption behavior of water on TiO2(110) came to very contradictory conclusions. In early GGA/DFT studies a much lower adsorption energy for molecular than for dissociative adsorption[38, 39] (at full monolayer coverage) was obtained (it should be noted, however, that the binding energy for the molecular adsorption was underestimated since only a symmetric adsorption of the molecules was considered, which is not the most stable geometry, see Fig. 9). Subsequently, Bates et al.[40] found a slightly higher adsorption energy for molecular monolayers, whereas Lindan et al.[41, 44, 45] proposed a mixed molecular/dissociated structure as the most stable state. In a Car–Parrinello molecular dynamics study[43] it was observed that water does not dissociate on the perfect surface, suggesting that the dissociation is hindered by a larger dissociation barrier. Later static calculations of the activation energy for water dissociation supported this point of view.[45] In a quite recent study, however, again molecular adsorption was found to be the most stable adsorption mode not only for water monolayers but even at lower water coverages.[46]
| Config | E | Config | E | ||
|---|---|---|---|---|---|
| 1 | single water | 4 | double pairs along [001] | ||
| Dd | 1.04 | 2 (Dd Du)–(22) | 0.67 | ||
| Md | 0.93 | 2 (Dd Dd)–(12) | 0.64 | ||
| 2 | single water | 2 (Dd Mu)–(22) | 0.81 | ||
| 2 Dd – c(42) | 0.97 | 2 (Dd Md)–(22) | 0.80 | ||
| 2 Dd – p(41) | 0.96 | 2 (Md Mu)–(22) | 0.84 | ||
| 2 Dd – p(22) | 0.75 | 2 (Md Md)–(12) | 0.86 | ||
| 2 Md – c(42) | 0.83 | ||||
| 2 Md – p(41) | 0.82 | ||||
| 2 Md – p(22) | 0.80 | ||||
| water pairs | 8 | quadruple pairs | |||
| (Dd Du) | 0.94 | 4 (Dd Du)–(21) | 0.61 | ||
| (Dd Dd) | 0.90 | 4 (Dd Dd)–(11) | 0.63 | ||
| (Dd Mu) | 0.97 | 4 (Dd Mu)–(21) | 0.77 | ||
| (Dd Md) | 0.96 | 4 (Dd Md)–(21) | 0.77 | ||
| (Md Du) | 0.90 | 4 (Md Mu)–(21) | 0.80 | ||
| (Md Dd) | 0.88 | 4 (Md Md)–(11) | 0.82 | ||
| (Md Mu) | 0.88 | ||||
| (Md Md) | 0.90 | ||||
The binding energies from these studies for molecular, mixed molecular/dissociative, and full dissociative adsorption at monolayer coverage are summarized in Table 4. The situation becomes even more confused if the published results for the adsorption of ‘isolated’ water molecules are compared (see Table 5). A survey of the publications shows that the results for the water binding energies depend sensitively on the computational setup, in particular the slab thickness and how the results are extrapolated to the limit of infinite thick slabs, as well as on the GGA functional which was used in the calculations (though the result reported in Ref. [7] on the dissociative water adsorption is probably due to an error in the calculations since it was never reproduced in more recent studies). From embedded cluster calculations using wave function based methods (Hartree–Fock, B3LYP and MP2) it has been suggested that overall GGA/DFT might overestimate the stability of the dissociated state of the water molecules compared to a molecular adsorption.[42] However, embedded cluster calculations have to be taken with considerable caution. As we will see below, surface re-relaxations, not only of the nearest neighbor atoms of the adsorption site but also including atoms in the next surface unit cells, make up a major contribution to the binding energy of the molecules, in particular for the dissociated state. Due to the limited cluster size it is questionable how well such structural effects have been captured in this study since the hydroxylated bridging O atoms created by the dissociation of a water molecule were already located at the boundary of the cluster.[42]

The main intention of our study is not to resolve the controversy between the different DFT studies on the molecular or dissociative nature of the adsorption of water, but to evaluate the relative stability of surface hydroxyl groups created by the non-reductive dissociation of water compared to both molecular water adsorption and to hydroxylation of the surface by reductive hydrogen adsorption which we will represent in terms of a phase diagram. The general features of the phase diagram and the qualitative position of the phase boundaries only depend on the overall interaction strength of the water molecules with the TiO2(110) surface but not, in cases where the energy difference between molecular and dissociative adsorption is small as for single, isolated water molecules, whether the molecular or the dissociate state turns out to be more stable. However, since our calculational setup with a large surface unit cell and a passivated slab seems to be quite reliable to give well converged results, we explored the question whether water dissociates on the ideal terraces of the TiO2(110) surface or not a little bit further than it would have been necessary for the construction of our surface phase diagram.
The most favorable adsorption site for water molecules and hydroxyl groups is ontop of the fivefold-coordinated Ti(5) cations, thereby restoring their sixfold-coordination as in the bulk. Water molecules lie relatively flat on the surface and form a weak hydrogen bond to one of the bridging O(2) atoms. Hydroxyl groups take a more upright position and orient themselves along a Ti(5)–O(3) bond, as long as they cannot form a hydrogen bond to an adsorbed molecule on a neighboring Ti(5) site (see Fig. 9).
For single water molecules in a (42) surface unit cell we find that dissociative adsorption is preferred compared to the molecular state by 0.11 eV, as can be seen from the compiled results in Table 6. This is in contrast to the results of Ref. 7, 46, 88, but in agreement with Ref. 45, 8, 9. On the other hand, at full monolayer coverage molecular adsorption is found to be 0.05 eV and 0.19 eV per water molecule more stable than partial or full dissociation, respectively. In view of the very contradictory results from previous DFT calculations in the literature on the relative stability of molecular and dissociative adsorption of water on TiO2(110), we have carefully re-evaluated the convergence of our computational setup. From the surveil of the literature it appears that the slab thickness and the degree of atomic relaxation of the slabs are the most crucial parameters. Therefore we have recalculated the energy difference between molecular and dissociative adsorption of water as a function of slab thickness. In the first set of calculations we have considered a full monolayer water coverage as represented by one water molecule in a (11) surface unit cell. As shown in Fig. 10, the molecular and dissociative adsorption energy and , respectively, exhibit the well-known strong odd–even oscillations if the water molecules are adsorbed symmetrically on both sides of the slab and a full atomic relaxation is performed. These oscillations are even present in the energy difference =. Switching to our standard setup in which we adsorb water only on one side of the slab, fix the atoms in the two bottom layers at the bulk positions and saturate the broken surface bonds at the bottom with pseudo-hydrogen atoms, the odd–even oscillations are almost completely removed (see Fig. 10). For we find only a small increase from 0.19 eV for the four trilayer slab to 0.23 eV in the limit of infinite slab thickness. In the second set of calculations we repeated the calculations for a single water molecule in a (42) surface unit cell with our passivated slabs for slab thicknesses up to seven trilayers. In the seven trilayer calculation the supercell contained 355 atoms. Also in this case, as shown in Fig. 10, there are almost no odd–even oscillations visible in the water adsorption energy and the energy difference between the molecular and dissociative adsorption increases only slightly from 0.11 eV for four trilayers to 0.06 eV in the six and seven trilayer calculation. Since in general such small energy differences depend sensitively on the quality of the pseudopotentials and the functional which are used in the computations, we only conclude that molecular and dissociative adsorption become energetically degenerate in the limit of single, isolated water molecules.

When comparing our results on the adsorption of isolated water molecules with the literature surveil in Table 5 it has to be taken into account that in the previous calculations for ‘single’ water molecules smaller surface unit cells with effective water coverages of 1/4 monolayer were used, compared to 1/8 monolayer in our study. As can be seen from our results in Table 6, at 1/4 monolayer coverage there is already a significant interaction between the water molecules. For two water molecules in the (42) surface unit cell the water binding energy is clearly reduced compared to a single molecule. The reason is, as we will point out below, the large contribution of the surface relaxations to the binding energy, which is now smaller since less degrees of freedom are associated with each molecule. In particular, for a (22) arrangement of water molecules, which was used in basically all previous calculations as setup for ‘isolated’ molecules, we find already a preference for molecular adsorption. Clearly, the 1/4 monolayer coverage does not represent isolated water molecules, and in principle, it would have to be checked if our 1/8 monolayer truly represents the limit of independent molecules. This implies that also in the embedded cluster approach large clusters are needed to take these contributions from the atomic relaxations appropriately into account.
Our result that for isolated water molecules molecular and dissociative adsorption is energetically degenerate is not in agreement with the common view expressed in most experimental studies that water only dissociates at defect sites. Since our calculations are very well converged, this might point towards a deficiency of the pseudopotential approximation or, in general, PBE/DFT calculations. However, it also has to be taken into account that all experiments have shown a certain amount of dissociated molecules and it is very difficult to distinguish whether they only stem from dissociation at defects or if some initial dissociation at very low coverages has taken place.
Comparing the water binding energies of two water molecules in a c(42) with the p(41) arrangement we find that the interaction of water molecules between different [001] rows is rather weak since the relative position of the water molecules within the [001] rows does not matter. This is very different from the situation when both water molecules are placed into the same [001] row (as in the p(22) configuration), where the changes in the surface relaxation lead to a strong repulsion between dissociated molecules. This repulsion has also been reported by Lindan et al.,[45] although with a slightly smaller magnitude. The repulsion can be compensated by adsorbing the two water molecules on neighboring Ti(5) sites, since now a hydrogen bond between the molecules is formed. We have considered all possible pairs of dissociated and undissociated water molecules with ‘upward’ and ‘downward’ orientation as illustrated in Fig. 9. As can be inferred from the binding energies in Table 6, all these configurations are almost equivalent, with a slight preference of pairs of dissociated/undissociated molecules in which the donating molecule of the hydrogen bond stays intact and the receiving molecule dissociates. Furthermore, we can see that the relative orientation of the molecules within the pair (‘upward’ or ‘downward’) does not matter, which will be also true at higher water coverages.
We take now these water pairs as building blocks to form higher water coverages. First we put two water pairs in the same [001] row to built structures of alternating full and empty [001] lines. The molecular adsorption is now the most stable one. The half-dissociated structure of Lindan et al.[41] is only slightly lower in energy. The fully dissociated structure, however, has become clearly unfavorable. Since the interaction of the water molecules between [001] rows is weak, as already pointed out above, this result remains unchanged when all [001] rows are filled with water molecules and the full monolayer coverage is reached.
For the length of the Ti(5)–Owater bond we obtained values between 2.246 Å and 2.306 Å for isolated water molecules and at full monolayer coverage, respectively. In a recent quantitative analysis of photoelectron diffraction experiments[92] a value for this bond length of 2.210.02 Å was determined. Taking into account that GGA typically overestimates bond length by 1–2%, our result for isolated water molecules agrees quite well with the experimental value, but overestimate it slightly in the limit of full monolayer coverage.
In conclusion, we find that in the limit of very low coverages the molecular and dissociative adsorption of water is almost degenerate. For single, isolated water molecules we find a small preference for dissociation, however, already at coverages when water pairs can form, mixed dissociated/molecular structures are more favorable than full dissociation. Finally, in the full monolayer coverage limit the molecular adsorption is the most stable configuration. Based on these results one would expect that if water islands are formed upon adsorption, almost all water molecules stay intact and only those molecules at the boundary of the water patch which do not have a neighbor to which they can form a hydrogen bond may dissociate. It is interesting to see the difference in the role of donated and accepted hydrogen bonds for the stability of water molecules between the TiO2(110) and ZnO(100) surface. On ZnO(100), water molecules also show a tendency to dissociate.[93, 94, 95] But while on ZnO(100) isolated water molecules stay intact and only start to dissociate when they receive an hydrogen bond, isolated water molecules on TiO2(110) are found to be close to dissociation and recombination is preferential when they can donate a hydrogen bond.
Our results for the water binding energies are throughout slightly lower than the previous results obtained with the PW91 functional,[40, 41, 46, 47] but significantly higher than what has been found in RPBE calculations[7, 8, 9, 44, 45, 88] (see also Tables 4 and 5). In order to compare our water binding energy of 0.82 eV at full monolayer coverage with experiment, we have furthermore calculated the corrections due to the zero-point vibration energy (ZPE). The vibration frequencies of the surface with and without the molecular water monolayer were obtained in harmonic approximation by a finite difference scheme. Only the atoms in the adsorbate and the first surface layer were displaced by 0.01 Å in the three cartesian directions. For the ZPE we obtain 0.12 eV so that we arrive at a ZPE-corrected water binding energy at monolayer coverage of 0.70 eV, which is in excellent agreement with the results of the TDS experiments of 0.65 eV[11] and 0.66 eV[12]. The minor overbinding of the water molecules is typical for PBE calculations and has also been observed for the adsorption of water on ZnO(100), where PBE calculations gave a water binding energy of 1.13 eV (without ZPE corrections) compared to the TDS/Redhead analysis of 1.03 eV.[93]
Looking at the qualitative trend of the adsorption energy with water coverage of the surface it is interesting to see in Table 6 that overall the binding energy decreases with water saturation. This contradicts the results of Ref. 46, whereas it is in full agreement with the RPBE calculations of Lindan et al.[44, 45] and, in addition, to the experimental observation in the TDS measurements. This is a rather unusual behavior since one would expect an increase in the binding energy with water coverage due to the formation of hydrogen bonds. In order to gain deeper insights into the origin of this behavior we have decomposed the process of desorbing the water molecules into four steps. Starting from the fully relaxed adsorbate structure we detach in the first step the water layer from the surface without relaxing the atoms. Then we separate the water molecules in order to obtain the hydrogen bond strength. Finally, we allow the TiO2(110) surface and the water molecules to relax to obtain the relaxation energies of the systems (see Ref. [95] for a similar analysis of the water adsorption energy on ZnO(100) ). For structures with neighboring water molecules we find indeed that hydrogen bonds are formed which increases the water binding energy. This gain in adsorption energy, however, is overcompensated at higher coverages by a loss in relaxation energy of the substrate per adsorbate molecule. Why are the surface relaxations so much more important for the TiO2(110) surface than, for example, ZnO(100)? As we have seen in Sec. II, the surface relaxation energy of the stoichiometric, ideal surface is quite large, 1.21 eV per surface unit cell compared to 0.37 eV for ZnO(100). Thus, re-relaxations induced by the restoration of the cation bulk coordination upon water adsorption will have a much stronger impact on the binding energy of the molecules than for ZnO(100).
Lindan et al.[45] have suggested that the dissociation of water at low coverages has not been observed experimentally because the dissociation of the molecules is hindered by a significant dissociation barrier which is difficult to overcome on the time scale of the experiments. Using NEB with a subsequent refinement of the transition state with the dimer method we have calculated the activation barrier for water dissociation for two cases: an isolated water molecule in a (42) surface cell and a single water molecule within a molecularly adsorbed water layer (also employing a (42) supercell). Our results of 0.16 eV and 0.14 eV, respectively, are significant lower than the activation barriers reported by Lindan et al.[45] of 0.45 eV (single water molecule in a (41) cell) and 0.26 eV (dissociation of every second water molecule in a full monolayer) and show a much weaker dependence on the water coverage. Therefore, based on our results, we cannot confirm that the dissociation of water molecules at low coverages is prevented by a large dissociation barrier.
III.5 Surface Phase Diagram
Finally we combine the results of all previous sections to construct a two-dimensional phase diagram. We assume that the TiO2(110) surface is simultaneously in thermodynamic equilibrium with reservoirs with which it can exchange O and H atoms, for example, a surrounding O2 and H2 gas phase. The surface free energy of the different TiO2(110) surface structures now depends on both chemical potentials, and . By indicating the most stable structure and composition of the TiO2O(110) surface as a function of the two chemical potentials we obtain the phase diagram which is shown in Fig. 11.
The surface phase diagram of Fig. 11 summarizes in a condensed fashion the results of our study on the relative stability of the different surface compositions which we have considered. The phase diagram is dominated by four different types of surface structures: the stoichiometric, ideal surface, the water saturated, oxidized surface and the reduced surface structures by O depletion and H adsorption. For ambient conditions ( eV) we find that the TiO2(110) surface is saturated with molecularly adsorbed water. The water can be gradually removed by lowering the O and H chemical potentials (i.e., by heating or lowering the partial pressures). Passing through a transition region with low water coverages in which dissociated water molecules may appear, the stoichiometric, ideal surface structure is reached. It is the most stable surface structure at UHV conditions for a wide range of temperatures ( eV, eV at room temperature). By heating the surface in UHV, the surface can be reduced by removing bridging oxygen atoms and creating structural O vacancies. At hydrogen rich and oxygen poor conditions the surface is reduced by hydrogen adsorption. However, the surface cannot be fully hydroxylated, but only a maximum H coverage of about 60% can be reached.
Overall the surface phase diagram shows a quite expected behavior of the TiO2(110) surface and does not yield any new surprises. Under UHV conditions the stoichiometric and the O reduced surface structures are the most important ones. On the other hand, under wet conditions or at high hydrogen partial pressures, as it is typical in catalytic or photochemical applications, the surface is water covered or reduced via hydroxylation.

IV Summary and Conclusions
Using density functional theory we have investigated in detail the formation of oxygen-related vacancies as well as the interaction of hydrogen and water with the TiO2(110) surface in terms of a comprehensive surface phase diagram. Careful convergence tests have shown that a computational setup of using slabs consisting of four trilayers in conjunction with saturating the surface bonds at the bottom with artificial hydrogen-like atoms with effective nuclear charges of +4/3 and +2/3 and fixing the atoms in the bottom two trilayers at their bulk positions almost completely eliminates the otherwise pronounced odd-even oscillations of surface and adsorption energies as a function of slab thickness. Using this procedure, the relaxation energy of the stoichiometric surface as well as the H and H2O adsorption energies at full monolayer coverage are within 0.06 eV per surface unit cell, 0.02 eV per H atom and 0.04 eV per H2O molecules, respectively, of the extrapolated results for infinitely thick slabs. Thus, very well converged results with slab thickness are obtained without relying on somewhat questionable extrapolation schemes such as the “25% rule”[46] or averaging four and five trilayer results,[31] as proposed previously in the literature.
It is also demonstrated that the contribution of surface relaxations to both binding and formation energies of molecules and defects, respectively, are substantial. Both adsorbate- and defect-induced relaxations are not limited to one surface unit cell, but contributions to the relaxation energy from more neighboring surface cells have to be taken into account. This leads to substrate-mediated interactions between defects and adsorbate molecules which can extend over several lattice constants. Consequently, large surface unit cells have to be used when properties of isolated defects or adsorbed molecules are studied. The same arguments apply for embedded cluster studies where clusters have to be large enough to be able to take the relaxations of the relevant environment appropriately into account.
In general, GGA/DFT calculations of reduced TiO2 structures are hampered by the underestimation of the TiO2 band gap of about 1.0 eV. For isolated O vacancies and pairs of OH groups on the TiO2(110) surface it has been shown that in GGA/DFT calculations the defect level lies at the bottom of the conduction band[36, 69] instead of 0.7–0.9 eV below. Naively one would therefore expect that GGA/DFT calculations should underestimate the energy of reduced TiO2 structures and thus overestimate the reducibility of TiO2 since defect states will tend to be too delocalized. In contrast to this expectation, a survey of the literature data showed instead that GGA/DFT overestimates the O vacancy formation energy. Furthermore we found in the present study that the dissociation energy of water at O vacancies is slightly too low in the PBE/DFT calculations and also the predicted maximum coverage of the TiO2(110) surface with hydrogen atoms is found to be slightly smaller than observed in experiment. This implies that in all three cases the GGA/DFT calculation have underestimated the reducibility of the TiO2(110) surface. However, the presumable error in the total energies is small: about 0.3 eV for the O defect formation energy and a tenth of an eV in the other two cases. Based on this analysis we conclude that the energetics is quite reliably described by GGA/DFT despite the problem of such calculations to obtain accurately the underlying electronic structure of the corresponding reduced TiO2 surfaces. It might be argued that the energetics of reduced TiO2 is well described because although the defect level of O vacancies and OH pairs is at the bottom of the conduction band instead of 0.7–0.9 eV below, its energy difference with respect to the top of the valence band is almost right. This might be correct for single, isolated O vacancies and OH pairs. However, in the case of an increasing hydroxylation of the surface when the defect states start to interact and to hybridize with the conduction band the whole defect band is now more easily accessible due to the underestimation of the band gap, but still the overall energetics is quite reliable with a tendency to underestimate the reducibility of TiO2.
After having clarified these crucial convergence and accuracy issues, we have compared the relative stability of surfaces with oxygen vacancies or adsorbed hydrogen atoms and water molecules by combining our DFT calculations with a thermodynamic formalism. Lowest-energy structures were determined by assuming that the surfaces are in thermodynamic equilibrium with oxygen and hydrogen reservoirs. The exchange of O and H atoms with the reservoirs is described by introducing appropriate chemical potentials which can be related to experimental temperature and pressure conditions. This allows us to extend the zero-temperature and zero-pressure DFT calculations to more realistic environmental conditions such as in UHV surface science experiments or in catalytic and photochemical applications.
The central result of this approach is the phase diagram depicted in Fig. 11. For ambient conditions we find that the non-reductive adsorption of water prevails. A full monolayer of molecular adsorbed water is predicted as the most stable adsorbate structure in agreement with experimental observations. In the low coverage limit molecular and dissociative adsorption becomes energetically degenerate. In addition, according to our calculations the dissociation barrier for molecularly adsorbed water molecules is not large enough to prevent their dissociation even at low temperatures.
At strongly reducing, oxygen-poor conditions structural O vacancies are formed on the TiO2(110) surface in thermodynamic equilibrium. However, for a wide range of temperature and pressure conditions it is found that removing full TiO2 units is thermodynamically more favorable instead. In the case of reduction of the surface via hydrogen adsorption we observed that the surface cannot be fully hydroxylated in thermodynamic equilibrium. A maximum coverage of about 60% is predicted from our thermodynamical analysis. Furthermore, our calculated energy barriers for hydrogen migration indicate than hydrogen atoms rather migrate into the bulk than desorbing from the surface. Both observations are supported by recent experiments in which a maximum saturation of the surface with hydrogen of 70% is reported, whereas no desorption of H2 could be observed in TDS.[22]
Acknowledgements.
The authors thank Christof Wöll, Monica Calatayud, and Ulrike Diebold for fruitful discussions. This work has been supported by the German Research Foundation (DFG) via the Collaborative Research Center SFB 558 “Metal-Substrate Interactions in Heterogeneous Catalysis”. Computational resources were provided by Bovilab@RUB (Bochum).References
- [1] U. Diebold, Surf. Sci. Rep. 48, 53 (2003).
- [2] M. Ramamoorthy, D. Vanderbilt, and R.D. King-Smith, Phys. Rev. B 49, 16721 (1994).
- [3] S.J. Tauster, S.C. Fung, and R.L. Garten, J. Am. Chem. Soc. 100, 170 (1978).
- [4] S.J. Tauster, Acc. Chem. Res. 20, 389 (1987).
- [5] M.A. Vannice and C. Sudhakar, J. Phys. Chem. 88, 2429 (1984).
- [6] I.M. Brookes, C.A. Muryn, and G. Thornton, Phys. Rev. Lett. 87, 266103 (2001).
- [7] R. Schaub, P. Thostrup, N. Lopez, E. Lægsgaard, I. Stensgaard, J.K. Nørskov, and F. Besenbacher, Phys. Rev. Lett. 87, 266104 (2001).
- [8] S. Wendt, R. Schaub, J. Matthiesen, E.K. Vestergaard, E. Wahlström, M.D. Rasmussen, P. Thorstrup, L.M. Molina, E. Lægsgaard, I. Stensgaard, B. Hammer, and F. Besenbacher, Surf. Sci. 598, 226 (2005).
- [9] S. Wendt, J. Matthiesen, R. Schaub, E.K. Vestergaard, E. Lægsgaard, F. Besenbacher, and B. Hammer, Phys. Rev. Lett. 96, 066107 (2006).
- [10] O. Bikondoa, C.L. Pang, R. Ithnin, C.A. Muryn, H. Onishi, and G. Thornton, Nature Mat. 5, 189 (2006) 189.
- [11] M.B. Hugenschmidt, L. Gamble, and C.T. Campbell, Surf. Sci. 302, 329 (1994).
- [12] M.A. Henderson, Surf. Sci. 355, 151 (1996).
- [13] D. Brinkley, M. Dietrich, T. Engel, P. Farrall, G. Gantner, A. Schafer, and A. Szuchmacher, Surf. Sci. 395, 292 (1998).
- [14] R.L. Kurtz, R. Stockbauer, T.E. Madey, E. Roman, and J.L. De Segovia, Surf. Sci. 218, 178 (1989).
- [15] J.-M. Pan, B.L. Maschhoff, U. Diebold, and T.E. Madey, J. Vac. Sci. Technol. A 10, 2470 (1992).
- [16] M. Batzill, K. Katsiev, J.M. Burst, U. Diebold, A.M. Chaka, B. Delley, Phys. Rev. B 72, 165414 (2005).
- [17] K. Katsiev, M. Batzill, U. Diebold, A. Urban, and B. Meyer, Phys. Rev. Lett. 98, 186102 (2007).
- [18] V.E. Henrich and R.L. Kurtz, Phys. Rev. B 23, 6280 (1981).
- [19] M. Kunat, U. Burghaus, and Ch. Wöll, Phys. Chem. Chem. Phys. 6, 4203 (2004).
- [20] S. Suzuki, K.I. Fukui, H. Onishi, and Y. Iwasawa, Phys. Rev. Lett. 84, 2156 (2000).
- [21] T. Fujino, M. Katayama, K. Inudzuka, T. Okuno, and K. Oura, Appl. Phys. Lett. 79, 2716 (2001).
- [22] X.-L. Yin, M. Calatayud, H. Qiu, Y. Wang, A. Birkner, C. Minot, and Ch. Wöll, ChemPhysChem 9, 253 (2008).
- [23] M. Ramamoorthy, R.D. King-Smith, and D. Vanderbilt, Phys. Rev. B 49, 7709 (1994).
- [24] P.J.D. Lindan, N.M. Harrison, M.J. Gillan, and J.A. White, Phys. Rev. B 55, 15919 (1997).
- [25] A.T. Paxton and L. Thien-Nga, Phys. Rev. B 57, 1579 (1998).
- [26] T. Bredow and G. Pacchioni, Chem. Phys. Lett. 355, 417 (2002).
- [27] A. Vijay, G. Mills, and H. Metiu, J. Chem. Phys. 118, 6536 (2003).
- [28] X. Wu, A. Selloni, M. Lazzeri, and S.K. Nayak, Phys. Rev. B 68, 241402(R) (2003).
- [29] M.D. Rasmussen, L.M. Molina, and B. Hammer, J. Chem. Phys. 120, 988 (2004).
- [30] X. Wu, A. Selloni, and S.K. Nayak, J. Chem. Phys. 120, 4512 (2004).
- [31] J. Oviedo, M.A. San Miguel, and J.F. Sanz, J. Chem. Phys. 121, 7427 (2004).
- [32] S.-G. Wang, X.-D. Wen, D.-B. Cao, Y.-W. Li, J. Wang, and H. Jiao, Surf. Sci. 577, 69 (2005).
- [33] Y.-F. Zhang, W. Lin, Y. Li, K.-N. Ding, and J.-Q. Li, J. Phys. Chem. B 109, 19270 (2005).
- [34] K. Hameeuw, G. Cantele, D. Ninno, F. Trani, and G. Iadonisi, phys. stat. sol. (a) 203, 2219 (2006).
- [35] T. Pabisiak and A. Kiejna, Solid State Comm. 144, 324 (2007).
- [36] M.V. Ganduglia-Pirovano, A. Hofmann, and J. Sauer, Surf. Sci. Rep. 62, 219 (2007)
- [37] J. Leconte, A. Markovits, M.K. Skalli, C. Minot, and A. Belmajdoub, Surf. Sci. 497, 194 (2002).
- [38] J. Goniakowski and M.J. Gillan, Surf. Sci. 350, 145 (1996).
- [39] P.J.D. Lindan, N.M. Harrison, J.M. Holender, and M.J. Gillan, Chem. Phys. Lett. 261, 246 (1996).
- [40] S.P. Bates, G. Kresse, and M.J. Gillan, Surf. Sci. 409, 366 (1998).
- [41] P.J.D. Lindan, N.M. Harrison, and M.J. Gillan, Phys. Rev. Lett. 80, 762 (1998).
- [42] E.V. Stefanovich and T.N. Truong, Chem. Phys. Lett. 299, 623 (1999).
- [43] W. Langel, Surf. Sci. 496, 141 (2002).
- [44] C. Zhang and P.J.D. Lindan, J. Chem. Phys. 118, 4620 (2003).
- [45] P.J.D. Lindan and C. Zhang, Phys. Rev. B 72, 075439 (2005).
- [46] L.A. Harris and A.A. Quong, Phys. Rev. Lett. 93, 086105 (2004); Comment: P.J.D. Lindan and C. Zhang, Phys. Rev. Lett. 95, 029601 (2005); Reply: L.A. Harris, and A.A. Quong, Phys. Rev. Lett. 95, 029602 (2005).
- [47] H. Perron, J. Vandenborre, C. Domain, R. Drot, J. Roques, E. Simoni, J.-J. Ehrhardt, and H. Catalette, Surf. Sci. 601, 518 (2007).
- [48] E. Kaxiras, Y. Bar-Yam, J.D. Joannopoulos, and K.C. Pandey, Phys. Rev. B 35, 9625 (1987).
- [49] G.-X. Qian, R.M. Martin and D.J. Chadi, Phys. Rev. B 38, 7649 (1988).
- [50] K. Reuter and M. Scheffler, Phys. Rev. B 65, 035406 (2001).
- [51] B. Meyer, Phys. Rev. B 69, 045416 (2004).
- [52] R. Car and M. Parrinello, Phys. Rev. Lett. 55, 2471 (1985).
- [53]
D. Marx and J. Hutter, in: Modern Methods and Algorithms of
Quantum Chemistry, edited by J. Grotendorst, NIC, FZ Jülich,
p. 301 (2000);
see: www.theochem.rub.de/go/cprev.html;
CPMD code: J. Hutter et al., see: www.cpmd.org. - [54] J.P. Perdew, K. Burke, and M. Ernzerhof, Phys. Rev. Lett. 77, 3865 (1996); Erratum: Phys. Rev. Lett. 78, 1396 (1997).
- [55] D. Vanderbilt, Phys. Rev. B 41, 7892 (1990).
- [56] T. Bredow, L. Giordano, F. Cinquini, and G. Pacchioni, Phys. Rev. B 70, 035419 (2004).
- [57] S.J. Thompson and S.P. Lewis, Phys. Rev. B 73, 073403 (2006).
- [58] K.J. Hameeuw, G. Cantele, D. Ninno, F. Trani, and G. Iadonisi, J. Chem. Phys. 124, 024708 (2006).
- [59] A. Kiejna, T. Pabisiak, and S.W. Gao, J. Phys.: Condens. Matter 18, 4207 (2007).
- [60] S.C. Abrahams and J.L. Bernstein, J. Chem. Phys. 55, 3206 (1971).
- [61] I.G. Batyrev, A. Alavi, and M.W. Finnis, Phys. Rev. B 62, 4698 (2000).
- [62] This deviation is due to the O pseudopotential. By decreasing the cut-off radius, making the local part of the potential more attractive and adding -projectors, the converged all-electron result for the O2 binding energy can be systematically approached. However, such pseudopotentials are usually much harder and require a larger plane wave cut-off energy.
- [63] NIST Chemistry WebBook, edited by P.J. Linstrom and W.G. Mallard, NIST Standard Reference Database No. 69 (National Institute of Standards and Technology, Gaithersburg MD, 2001), see: http://webbook.nist.gov
- [64] G. Pacchioni, J. Chem. Phys. 128, 182505 (2008).
- [65] K.M. Glassford and J.R. Chelikowsky, Phys. Rev. B 46, 1284 (1992).
- [66] J. Pascual, J. Camassel, and H. Mathieu, Phys. Rev. Lett. 39, 1490 (1977); Phys. Rev. B 18, 5606 (1978).
- [67] W. Göpel, J.A. Anderson, D. Frankel, M. Jaehnig, K. Phillips, J.A. Schäfer, and G. Rocker, Surf. Sci. 139, 333 (1984).
- [68] M.A. Henderson, Surf. Sci. 400, 203 (1998).
- [69] C. Di Valentin, G. Pacchioni, and A. Selloni, Phys. Rev. Lett. 97, 166803 (2006).
- [70] M.A. Henderson, W.S. Epling, C.H.F. Peden, and C.L. Perkins, J. Phys. Chem. B 107, 534 (2003).
- [71] M. Lannoo and P. Friedel, Atomic and Electronic Structure of Surfaces, Springer Verlag, Berlin (1991).
- [72] B. Meyer and D. Marx, Phys. Rev. B 69, 235420 (2004).
- [73] We follow here the notation of Ref. [1]: a () cell is built by repeating the primitive surface unit cell and times along the bulk [001] and [10] directions, respectively. It has dimensions of . In some other publications the order of and is reversed.
- [74] B. Meyer and D. Marx, Phys. Rev. B 67, 035403 (2003).
- [75] H. Jónsson, G. Mills, and K.W. Jacobsen, in: Classical and Quantum Dynamics in Condensed Phase Simulations, edited by B.J. Berne, G. Ciccotti, and D.F. Coker, World Scientific, Singapore, p. 385 (1998).
- [76] G. Henkelman and H. Jónsson, J. Chem. Phys. 111, 7010 (1999).
- [77] G. Henkelman, B.P. Uberuaga, and H. Jónsson, J. Chem. Phys. 113, 9901 (2000).
- [78] G. Henkelman and H. Jónsson, J. Chem. Phys. 113, 9978 (2000).
- [79] A. Heyden, A.T. Bell, and F.J. Keil, J. Chem. Phys. 123, 224101 (2005).
- [80] R. Kováčik, B. Meyer, and Dominik Marx, Angew. Chem. 119, 4980 (2007); Angew. Chem. Int. Ed. 46, 4894 (2007).
- [81] S. Wendt, P.T. Sprunger, E. Lira, G.K.H. Madsen, Z. Li, J.Ø. Hansen, J. Matthiesen, A. Blekinge-Rasmussen, E. Lægsgaard, B. Hammer, and F. Besenbacher, Science 320, 1755 (2008).
- [82] P.A. Redhead, Vacuum 12, 203 (1962).
- [83] K. R. Paserba and A. J. Gellman, Phys. Rev. Lett. 86, 4338 (2001).
- [84] A.D. Becke, Phys. Rev. A 38, 3098 (1988).
- [85] J.P. Perdew, Phys. Rev. B 33, 8822 (1986); Erratum: Phys. Rev. B 34, 7406 (1986).
- [86] J.P. Perdew, J.A. Chevary, S.H. Vosko, K.A. Jackson, M.R. Pederson, D.J. Singh, and C. Fiolhais, Phys. Rev. B 46, 6671 (1992); Erratum: Phys. Rev. B 48, 4978 (1993).
- [87] B. Hammer, L.B. Hansen, and J.K. Norskov, Phys. Rev. B 59, 7413 (1999).
- [88] A. Tilocca, C. Di Valentin, and A. Selloni, J. Phys. Chem. B 109, 20963 (2005).
- [89] In the calculation of the transition path for water dissociation at O vacancies we have not pre-adsorbed the water molecules in the defect and then searched for a subsequent dissociation barrier as it was done in Ref. 90 but have started from a water molecule in the gas phase.
- [90] S. Kajita, T. Minato, H.S. Kato, M. Kawai, and T. Nakayama, J. Chem. Phys. 127, 104709 (2007).
- [91] G.S. Herman, Z. Dohnálek, N. Ruzycki, and U. Diebold, J. Phys. Chem. B 107, 2788 (2003).
- [92] F. Allegretti, S. O’Brien, M. Polcik, D.I. Sayago, and D.P. Woodruff, Phys. Rev. Lett. 95 226104 (2005).
- [93] B. Meyer, D. Marx, O. Dulub, U. Diebold, M. Kunat, D. Langenberg, and Ch. Wöll, Angew. Chem. 116, 6809 (2004); Angew. Chem. Int. Ed. 43, 6641 (2004).
- [94] O. Dulub, B. Meyer, and U. Diebold, Phys. Rev. Lett. 95, 136101 (2005).
- [95] B. Meyer, H. Rabaa, and D. Marx, Phys. Chem. Chem. Phys. 8, 1513 (2006).