Probing Star Formation at Low Metallicity: The Radio Emission of Super Star Clusters in SBS 0335052
Abstract
We present high-resolution radio continuum observations of the nascent starburst in the metal-poor galaxy SBS 0335052. These radio data were taken with the Very Large Array and include observations at 0.7 cm, 1.3 cm, 2 cm, 3.6 cm, and 6 cm. These observations enable us to probe the thermal radio nebulae associated with the extremely young star-forming regions in this galaxy. Two discrete and luminous star-forming regions are detected in the south of the galaxy that appear to be associated with massive star clusters previously identified at optical wavelengths. However, the remaining optically-identified massive star clusters are not clearly associated with radio emission (either thermal or non-thermal) down to the sensitivity limits of these radio data. The spectral energy distributions of the two radio-detected clusters are consistent with being purely thermal, and the entire region has an inferred ionizing flux of s-1, which is equivalent to “typical” O-type stars (type O7.5 V). The observations presented here have resolved out a significant contribution from diffuse non-thermal emission detected previously, implying a previous episode of significant star formation. The current star formation rate (SFR) for this southern region alone is M⊙yr-1, or M⊙yr-1kpc-2, which is nearing the maximum starburst intensity limit. This SFR derived from thermal radio emission also suggests that previous optical recombination line studies are not detecting a significant fraction of the current star formation in SBS 0335052. From model fits to the radio spectral energy distribution, we infer a global mean density in the two youngest clusters of n cm-3. In addition, a comparison between the compact and diffuse radio emission indicates that up to % of the ionizing flux could be leaking out of the compact Hii regions; this in is agreement with previous work which suggests that the interstellar medium surrounding the natal clusters in SBS 0335052 is porous and clumpy.
Subject headings
galaxies:individual(SBS 0335-052) – galaxies: star clusters – galaxies: starburst – HII regions – stars: formationI. Introduction

Super star clusters (SSCs) are the most massive and dense type of young stellar clusters, and represent the most extreme mode of star formation in the local universe. SSCs are common in vigorous star formation episodes [25, 37], apparently requiring high pressure and interstellar gas column density for their formation [14, 5, e.g.,]. A large amount of evidence collected since the launch of the Hubble Space Telescope suggests that at least some SSCs are the progenitors of globular clusters; they have similar masses, sizes, and stellar density, and evolutionary models suggest that evolved SSCs, if gravitationally bound, would have properties very similar to present-day globulars [2, 54, 17, 45, 89]. However, despite these strong links between globular clusters and SSCs, we do not know how the extremely low metallicity in the early universe affected massive star cluster formation. A low metal content may affect star formation in a variety of ways, including cooling and pressure in the birth cloud, hardness of the stellar spectra, and evolution of the stars themselves [69, 73, 82, 3, e.g.]. One way to approach this question is to study SSC formation in extremely low-metallicity systems in the local universe.
SBS 0335052 is a unique blue compact dwarf galaxy (BCD) in the nearby universe because of its very high star formation rate (SFR) and its extremely low metallicity; it is thus ideal for our study. It was discovered in the Second Byurakan Survey by Izotov et al. [29] who noted its particularly low oxygen abundance of , confirmed by subsequent studies [53, 28]. SBS 0335052 is the most metal-poor galaxy known with a SFR 1 yr-1, 20 times higher than in I Zw 18 [15, 22]. SBS 0335052 is associated with an Hi condensation within the same large Hi cloud (64 kpc24 kpc) as SBS 0335052W, which is located at a second Hi peak about 22 kpc to the west [63]. The neutral gas in SBS 0335052 is evidently not pristine, having roughly the same oxygen abundance as the ionized gas [80]. Analyses of the broadband colors and spectral models of SBS 0335052 suggest that it may be a local analog to primordial star forming sites in the early universe [79, 30, 59, 64].
| Antenna | Date | Obs. Time | Flux | Program | |
|---|---|---|---|---|---|
| (cm) | Config. | Observed | (hours) | Calibrator(s) | Code |
| 6 | A-array | 2003 Jun 03 | 2 | 3C48, 3C147 | AJ299 |
| 6 | A-arrayPT | 2004 Oct 14 | 5 | 3C286 | AJ313 |
| 3.6 | A-array | 2003 Jun 03 | 2 | 3C48, 3C147 | AJ299 |
| 3.6 | A-arrayPT | 2004 Oct 14 | 5 | 3C286 | AJ313 |
| 2 | B-array | 2003 Oct 29 | 7 | 3C48, 3C147 | AJ299 |
| 2 | B-array | 2004 Jan 02 | 5 | 3C48, 3C147 | AJ299 |
| 2 | B-array | 2004 Jan 07 | 4.5 | 3C48, 3C147 | AJ299 |
| 2 | A-array | 2004 Oct 11 | 4 | 0410+769 | AJ313 |
| 2 | A-array | 2004 Nov 30 | 3 | 0713+438 | AJ313 |
| 2 | A-array | 2005 Jan 09 | 6.5 | 0410+769, 0713+438 | AJ313 |
| 1.3 | B-array | 2004 Jan 04 | 6.5 | 3C48, 0410+769, 0713+438 | AJ299 |
| 1.3 | B-array | 2004 Jan 05 | 6 | 0410+769, 0713+438 | AJ299 |
| 1.3 | B-array | 2004 Jan 06 | 7 | 3C48, 0410+769, 0713+438 | AJ299 |
| 1.3 | A-array | 2004 Oct 12 | 7 | 3C286, 0410+769, 0713+438 | AJ313 |
| 1.3 | A-array | 2004 Oct 16 | 7 | 3C286, 0410+769, 0713+438 | AJ313 |
| 1.3 | A-array | 2004 Nov 30 | 3 | 0410+769, 0713+438 | AJ313 |
| 0.7 | B-array | 2005 Mar 20 | 9 | 3C84, 3C286 | AJ313 |
| 0.7 | B-array | 2005 Apr 03 | 7 | 3C84, 0410+769, 0319+415 | AJ313 |
| 0.7 | B-array | 2005 Apr 23 | 3.5 | 3C84, 3C286, 0410+769, 0713+438 | AJ313 |
| 0.7 | B-array | 2005 May 03 | 9 | 3C84, 3C286, 0410+769, 0713+438 | AJ313 |
| 0.7 | B-array | 2005 Jun 03 | 4.5 | 3C84, 3C286, 0410+769, 0713+438 | AJ313 |
| 0.7 | B-array | 2005 Jun 04 | 4.5 | 3C84, 3C286, 0410+769, 0713+438 | AJ313 |
| 0.7 | C-array | 2005 Aug 11 | 4 | 3C84, 0410+769, 0713+438 | AJ313 |
| 0.7 | C-array | 2005 Aug 12 | 9 | 3C84, 0410+769, 0713+438 | AJ313 |
| 0.7 | C-array | 2005 Aug 13 | 9 | 3C84, 0410+769 | AJ313 |
| 0.7 | C-array | 2005 Aug 14 | 4 | 3C84, 0410+769, 0713+438 | AJ313 |
The star formation in SBS 0335052 is concentrated mainly in six SSCs11 1 Based on observations made with the Hubble Space Telescope, obtained from the Data Archive at the Space Telescope. Science Institute, which is operated by the Association of Universities for Research in Astronomy, Inc., under NASA contract NAS 5-26555. These observations are associated with program #10575. (shown in Fig. 1), surrounded by a very blue underlying envelope [79, 59]. Toward the north, the filamentary and irregular structure of the emission suggests a shell carved out by supernovae (SNe). The SSCs (1-6, according to the notation of Thuan et al. 79) are roughly aligned in the southeast to northwest direction. Reines, Johnson, & Hunt [65] confirm an age gradient of the clusters across the galaxy (with the northern-most clusters being the oldest) that is consistent with a large-scale disturbance crossing the galaxy at a speed of km s-1 and triggering star formation en route.
Although the optical colors of the two youngest SSCs 12 are relatively blue, they are also strong infrared (IR) emitters [81, 24, 12, 62, 20, 65]. Extinction estimates around these two clusters vary greatly depending on the wavelengths of the observations used. Low extinctions (A mag) are derived from optical observations [30, 65, e.g.,] whereas mid-IR observations indicate high extinction (A12 mag) regions surrounding the young clusters [81, 62, 21, 20, e.g.,]. Reines, Johnson, & Hunt [65] find evidence for a porous and clumpy ISM surrounding the young clusters, which can naturally account for the apparently discrepant extinction estimates found in the literature. Dense dust clumps heated by the impinging UV stellar continuum provide the high extinction estimates from mid-IR observations, whereas diffuse inter-clump regions sampled by optical observations yield low measured extinctions.
Previous low-resolution radio observations of SBS 0335052 showed free-free absorption on a global scale, and a significant non-thermal component [23]. However, the beam size of those images was insufficient to disentangle the spatial distribution of the thermal and non-thermal emission. In this paper, the radio continuum properties of SBS 0335052 are re-examined at significantly higher resolution with the goal of probing individual star-forming regions. We present new high-resolution radio continuum observations of SBS 0335052 to better separate the different emission mechanisms spatially, and probe the thermal radio nebulae. We describe our observations in in 2, discuss the morphology of the natal clusters in 3, and analyze the physical properties of the clusters in 4. The relationship between the clusters and the overall galaxy are presented in 5, and 6 provides a general summary of the results. We adopt a distance of 55.7 Mpc to SBS 0335052, which assumes km s-1 Mpc-1, and correction to the CMB reference frame as described in Hunt et al. [21]. This corresponds to a spatial scale of 270 pc arcsec-1.
II. Observations
High-resolution radio observations of SBS 0335052 were obtained with the Very Large Array (VLA)22 2 The National Radio Astronomy Observatory is a facility of the National Science Foundation operated under cooperative agreement by Associated Universities, Inc. from 2003 June to 2005 August. Observations were obtained at C-band (5 GHz, 6 cm), X-band (8 GHz, 3.6 cm), U-band (15 GHz, 2 cm), K-band (22 GHz, 1.3 cm), and Q-band (43 GHz, 0.7 cm); these are summarized in Table 1. The high-frequency observations at K-band and Q-band utilized fast-switching to a nearby phase calibrator with cycle times of minutes in order to mitigate the effect of atmospheric changes.
These radio data were reduced and calibrated using the Astronomical Image Processing System (AIPS). When available, models of the flux calibrators were used in order to exploit the full coverage of these sources. Most of the data sets included observations of more than one flux calibrator in order to cross check the calibration solutions. We estimate that the absolute uncertainty in flux calibration is %, based on scatter in the VLA Flux Density Calibrator database for the calibrators used in this program.
Because our aims depend on relative flux densities at different frequencies, care was taken to obtain the best-matched coverage possible at each frequency. Each frequency was observed in two separate array configurations chosen to obtain relatively well-matched synthesized beams. Additionally, all of the combined data sets were trimmed to have an identical minimum spacing of 30 k in order to roughly match their sensitivity to extended structure, and the “robust” parameter was varied between -1 and 1 (slightly uniform to slightly natural) in order to obtain better matched synthesized beams. Nevertheless, the coverage at each frequency cannot be perfectly matched, and thus there may be slight variations between the sensitivity to different spatial scales at each frequency. An additional set of images was also made using the greatest possible sensitivity at each frequency using purely natural weighting (robust=5) and no restrictions in coverage. The resulting imaging parameters are listed in Table 2.
Unfortunately, the highest frequency observations at Q-band were consistently plagued by bad weather and instrumental problems. As a result the rms noise in the combined Q-band data set is too high to be useful for the purposes of this project, and is not analyzed further in this paper. However, in the final data sets obtained in August 2005, a luminous transient object appeared, which will be discussed in a separate paper.
Determining the flux densities of non-point-like sources observed with an interferometer amid complex backgrounds is notoriously prone to large uncertainties. In order to obtain the most accurate values possible, we employed several techniques to measure the flux densities. First, the peak flux densities were measured in mJy/beam; if the objects are point-like, this is equal to their total flux density in mJy. Second, aperture photometry was performed on each wavelength using a variety of identical (irregular) apertures and annuli using the AIPS++ viewer tools. Finally, the sources were fit with Gaussian profiles using the AIPS task JMFIT. The quoted flux densities and uncertainties in Table 3 reflect these results. In addition, photometry was performed on the high-sensitivity images using a radius aperture ( pc) centered on the entire region of radio emission “region S”, and these results are also quoted in Table 3.
| Weighting | Synth. Beam | P.A. | rms | |
|---|---|---|---|---|
| (cm) | robust value | () | () | (Jy/beam) |
| 6 | -1 | 25 | 18 | |
| 6 | 5 | -1 | 10 | |
| 3.6 | 0 | 9 | 12 | |
| 3.6 | 5 | -14 | 10 | |
| 2.0 | 0.5 | 17 | 17 | |
| 2.0 | 5 | 6 | 15 | |
| 1.3 | 1 | 3 | 12 | |
| 1.3 | 5 | 2 | 11 | |
| 0.7 | 5 | 34 | 40 |
| Source | ( Jy) | ( Jy) | ( Jy) | ( Jy) |
|---|---|---|---|---|
| S1 | ||||
| S2 | ||||
| Region SaaRegion S corresponds to an aperture of radius centered on the radio emitting region that encompasses S1 and S2. |
III. Location and Morphology of the Radio Emission


The compact radio emission in SBS 0335052 is resolved into two dominant sources S1 and S2 located in the southern region of the galaxy that appear to be associated with two SSCs 1 and 2 identified by Thuan et al. [79]. The radio emission at 1.3 cm, 2 cm, 3.6 cm, and 6 cm is shown overlaid on an HST/ACS F550M image in Figure 2.
The exact location of the radio sources relative to the optical SSCs is difficult to pinpoint precisely because of the uncertainty in the HST astrometry. The astrometry for the VLA images is accurate to within 01 and is considered absolute by comparison. We started first with the same HST image as in Hunt et al. [23], astrometrically calibrated with five stars in the USNOA2.0. The astrometric rms uncertainty is 054, roughly twice the size of the highest resolution synthesized beams of the radio data presented here. Using the nominal astrometry, the southernmost radio peak lies 04 south of the two brightest SSCs.
We then attempted to improve the relative pointing uncertainty between the optical and radio images by bootstrapping from the morphology of the Pa emission presented in Reines, Johnson, & Hunt [65]. Using this method, we first matched the continuum-subtracted Pa emission to the radio, and applied that astrometric solution to the non-continuum-subtracted Pa image, which has many features in common with the optical image. Subsequently, the optical image was aligned with the non-continuum subtracted Pa image to obtain the final astrometry. The shift in the astrometry relative to the USNO solution is 04, within the expected uncertainty of the absolute positions. The resulting alignment of the optical image clearly associates the radio sources S1 and S2 with the optically identified SSCs 1 and 2 as shown in Figure 2. Given this apparent correspondence between the optical and radio sources, hereafter we refer to S1 and S2 as SSCs 1 and 2.


None of the other SSCs identified optically by Thuan et al. have firmly-detected radio emission, although SSCs 5 and 6 have possible marginal detections in the 1.3 cm K-band image. In addition, there is a string of K-band peaks extended toward the north of SBS 0335052 (see Fig. 2). Individually, any one of these peaks would not necessarily be considered a source; however, the spatial correlation is suggestive of a more extended feature that is largely resolved out by these high-resolution observations. We hypothesize that this feature may be associated with the supershell observed by Thuan et al. [79] and/or an outflow extending in that direction.
The flux density at high frequencies observed for Region S in this paper compared to the previous work at lower resolution [23] suggests that even in these high-resolution observations the spatial filtering inherent in array observations is not “resolving out” any of the thermal flux. At 1.3 cm and 2 cm, our high-resolution observations recover all the flux in SBS 0335052 reported by Hunt et al. [23]. This implies that the size of the entire thermal source at high frequencies must be smaller than or comparable to the 0.5″aperture used to measure the flux density of Region S.
In contrast, the 20 cm radio emission at a resolution of 16 presented by Hunt et al. [23] is peaked 05 (100 pc) north of sources SSCs 1 and 2. Fig. 3 illustrates the overlay of the 20 cm emission on the 1.3 cm map33 3 The positional discrepancy between this work and Hunt et al. [23] is a consequence of the new HST images and astrometry presented in this paper.. Because the low-frequency radio flux is dominated by synchrotron emission, this non-thermal emission is likely to be associated with SNe from a distinct episode of star formation with an age of 3.5 Myr. At 6 cm, the lowest frequency of the observations presented here, we recover only 44% of the global flux measured by Hunt et al. [23]. This would imply that the non-thermal emission is much more diffuse than the thermal; indeed if the significant synchrotron halo of I Zw 18 [22], another low-metallicity BCD, were placed at the distance of SBS 0335052, it would be resolved out by our observations (see V.4).
IV. Physical Properties of the Natal SSCs
IV.1. Modeling the Spectral Energy Distributions
To gain insight into the physical conditions in the radio sources present in SBS 0335052 we apply a general thermalnon-thermal fit with an absorption component as in Hunt et al. [23]. These are simple models that assume a uniform-density homogeneous ionized medium. The realistic physical conditions in the Hii regions are likely to be more complex, including density variations and deviations from a sphere, but the available data do not support more complicated models. We can express the thermal radio free-free absorption coefficient as:
| (1) |
where is the electron density of the ionized gas, is the ionized gas temperature, and is the frequency. This means that the free-free optical depth = (path length through the region) is:
| (2) |
where EM is the linear emission measure ().
By virtue of Kirchhoff’s law for thermal emission, which relates and the radio volume emissivity , we write the thermal radio flux as a function of EM:
| (3) | |||||
is dimensionless and depends on the geometry, equal to for a spherical region of constant density and diameter (FWHM) , and for a cylindrical region of diameter and length (e.g., Mezger & Henderson 56). also accommodates a filling factor, which here is assumed equal to unity. We take into account the optical thickness of the radio emission through assuming a geometry in which the emission and absorption are intermixed in a homogeneous medium. The thermal radio flux can then be expressed as:
| (4) | |||||
Equation 4 shows that in the limit of optically-thin radio emission where the absorption term , . Alternatively, when , the radio emission is completely optically thick, and . Hence we are not making any assumptions a priori about the nature of the thermal radio emission44 4 These are the same models as in Hunt et al. [23], but expressed in a more general way.. A spherical geometry is assumed for the thermal emission, and the electron temperature was taken to be 20000 K [27].
Allowing for the most general models that also include non-thermal emission introduces two additional free parameters (the non-thermal flux density and spectral slope), leaving the models unconstrained. Nevertheless, for completeness we also modeled these regions with the inclusion of a non-thermal component to assess the degree to which the results might be affected. We assume a screen geometry for the free-free absorption and write for the non-thermal radio flux :
| (5) |
where is the non-thermal (unabsorbed) flux at frequency . The total flux in this case at given frequency is the sum of Equations 4 and 5.
The data were fit to models allowing for both thermal and non-thermal contributions using a minimization algorithm, and contour values of the reduced values and resulting spectral energy distributions (SEDs) are shown in Figures 4a-c. As in Hunt et al. [23], we fit the data using three free parameters: , diameter , and emission measure EM. We ran models separately for values of ranging from to , which would enable us to judge, albeit crudely, the best-fit non-thermal index from the lowest . The best-fit parameters derived from these models are listed in Table 4 and discussed in the following. In each case, the radio flux densities are consistent with a purely thermal origin.
IV.2. Radii and Densities
The best-fit models with only thermal emission are shown as solid curves in Fig. 4. The models also allow for an additional non-thermal contribution, although this only resulted in a marginally better fit for for SSC 1 and is shown as a dashed line. The best-fit parameters and the physical properties inferred from these models are reported in Table 4. However, as can be seen in Figures 4a-c, it must be stressed that in all cases presented here, there is a range of parameters that fit the data with nearly the same goodness-of-fit. It is important to understand the degeneracy inherent in fitting thermal radio SEDs of unresolved sources. Specifically, at high frequencies where the resolution is sufficient to separate star-forming regions, sources also tend to be optically thin or only slightly optically-thick. In this regime, radius and density are essentially degenerate. From the plots of the reduced minima shown in Figures 4a-c, it is clear that a range of values for radius and density are consistent with the data in hand; thus the “best-fit” values quoted in Table 4 should not be strictly interpreted.
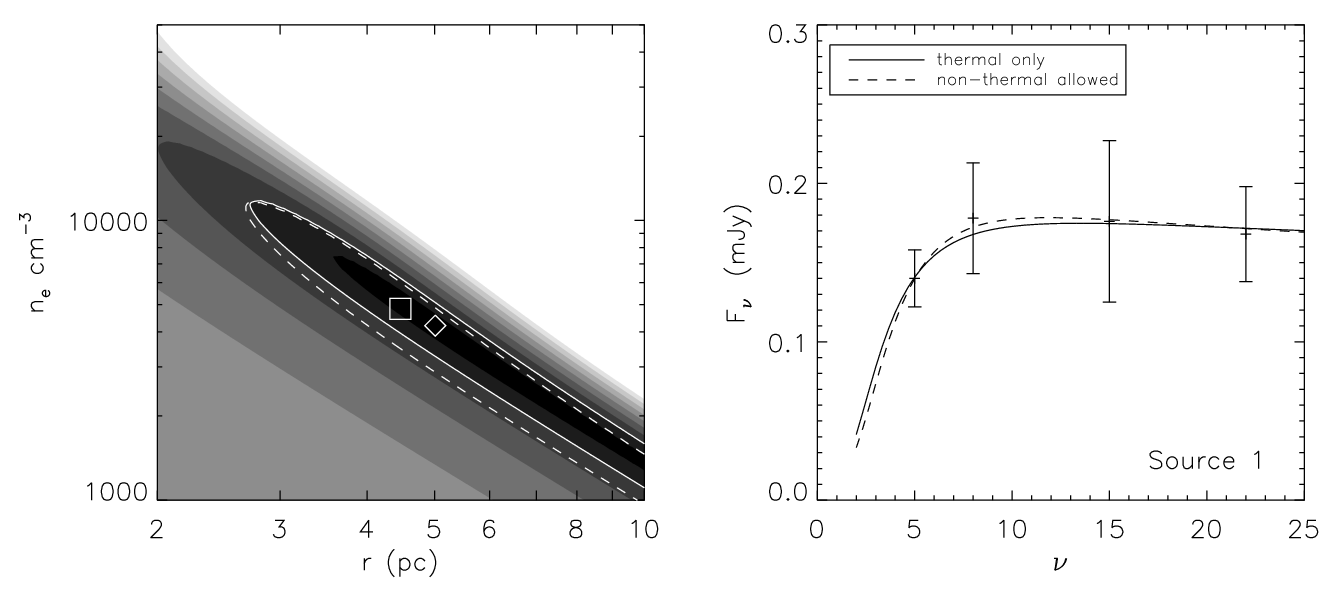
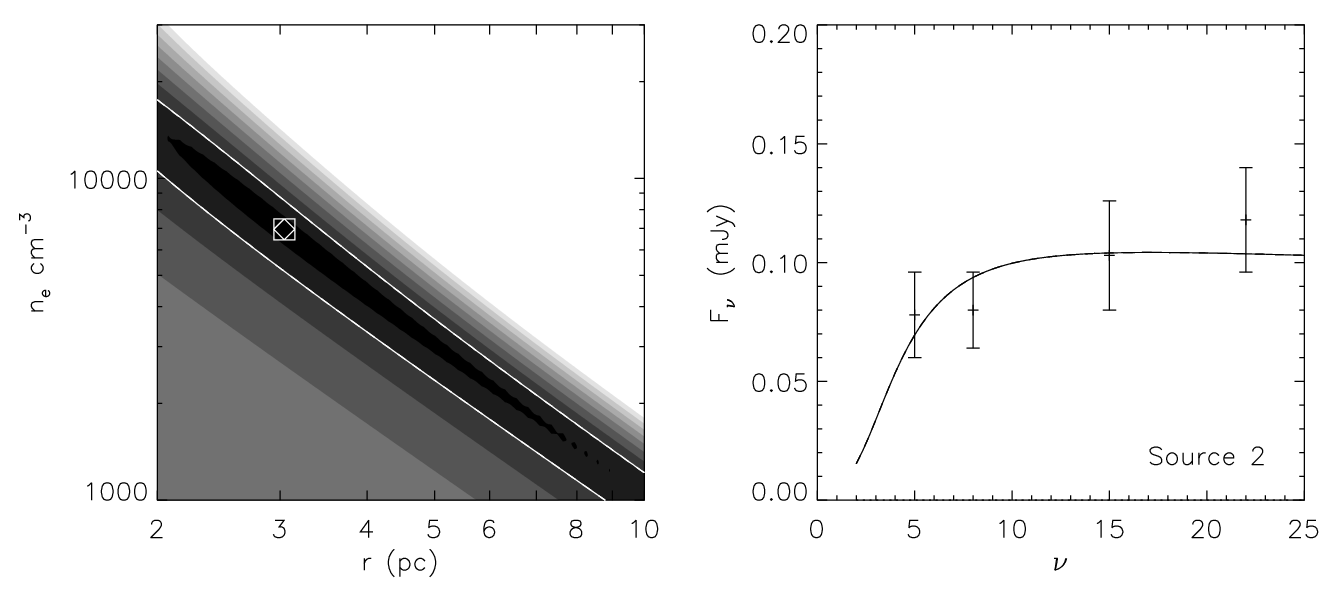
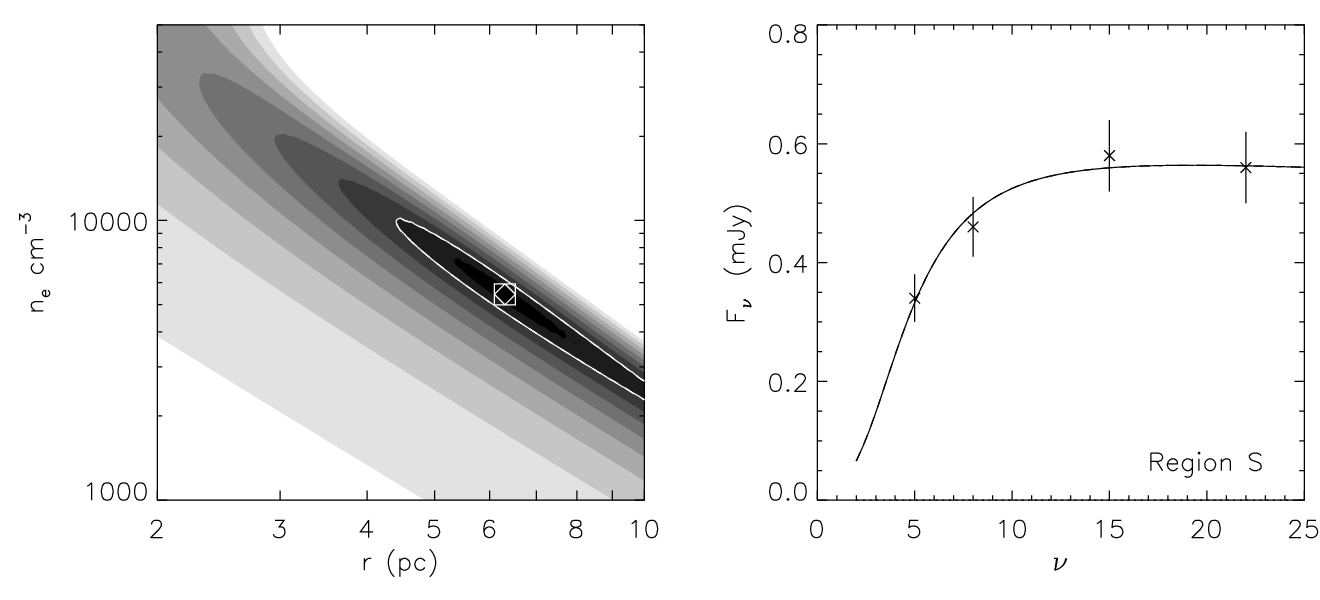
| r bbSee Figure 4 for range of acceptable values. | ne bbSee Figure 4 for range of acceptable values. | cc values as determined from the 1.3 cm flux densities, assuming an Hii region temperature of 20000 K. | MstarsddAdopting the models of SB99 for a burst at age 1Myr [49]. | ||
|---|---|---|---|---|---|
| Source | aaIt is clear from the reduced values that these fits are not well-constrained. See § IV.2 for discussion. | (pc) | ( cm-3) | (1052 s-1) | (106 ) ddAdopting the models of SB99 for a burst at age 1Myr [49]. |
| S1 | 0.2 | 5.0 | 4.3 | 3.5 | 0.5 |
| S1nt eeSource SSC 1 had a marginally better fit for models that included a small amount of non-thermal emission. | 0.1 | 4.5 | 4.8 | 3.5 | 0.5 |
| S2 | 0.6 | 2.8 | 7.9 | 2.5 | 0.4 |
| Region S | 0.3 | 7.9 | 3.2 | 11.7 | 1.7 |
The radii of the two thermal sources associated with SSCs 1 and 2 inferred from our fits are pc (see Table 4). These sizes are several times smaller than the radii of 8-15 pc deduced by Hunt et al. [23] from lower-resolution observations, but typical of SSCs. They are also considerably smaller than those measured by Thompson et al. [76] with NICMOS at 1.9 µm (16–18 pc). However, the diffraction limit of HST at this wavelength of 0.2 arcsec (54 pc) makes direct measurements with NICMOS potentially unreliable. Likewise, the radii inferred here are not directly measured, and therefore these sizes should be considered estimates. Moreover, given the youth of these clusters, they are unlikely to be dynamically relaxed into simple spherical systems, but rather complex structures that are not resolved by any of the available data.
The inferred EMs of pc cm-6 are about 10 times higher than that inferred globally. Hence, the electron densities of cm-3 on small spatial scales are several times greater than those estimated from global radio fluxes, and roughly 10 times those derived from optical spectra [27]. The sensitive high-resolution measurements presented here are able to probe more deeply into the optically-thick star-forming region in SBS 0335052, and support the idea that beam dilution seriously affects low-resolution radio observations of such sources. Moreover, optical wavelengths may not be sampling the same regions as these radio observations; long wavelengths are better able to examine the dusty dense zones in extreme modes of star formation such as those in SBS 0335052.
The model fits show that the radio emission appears to become optically thick at frequencies 5-8 GHz. Even at 8.5 GHz, the best-fit models suggest that 0.3-0.5. Nevertheless, the highest frequency observations presented here at 22 GHz are consistent with being optically-thin, and we do not believe that the flux densities at this frequency have suffered from any significant self-absorption. The observed flux densities may, however, suffer from losses due to other factors. First, dust within the Hii region can absorb ionizing photons, thereby reducing the amount of ionized gas. Second, if the ISM is porous (which we will return to in § V.1), a significant fraction of the ionizing flux may escape from the region.
IV.3. Ionizing Luminosities
Thermal radio emission can be used to estimate the production rate of ionizing photons from the massive star clusters powering these regions, and the ionizing luminosities can in turn be used to estimate their stellar content.
Following Rubin [66] and Condon [10],
| (6) | |||||
The factor 0.926 corrects for the 8% helium abundance in the ionized gas [56]. This equation assumes the emission is both thermal and optically thin, as both of these criteria are most likely to be met at the highest frequency observations, which are less likely to contain contaminating non-thermal flux and less likely to suffer from self-absorption. We use the 1.3 cm flux densities in order to determine for the thermal radio sources in SBS 0335052. We have assumed an ionized gas electron temperature of =20000 K [27]. Given that an O7.5V star produces an ionizing flux of = s-1 [47, 84, 85, hereafter O*, the equivalent to type O7.5V:], from Table 4 we infer that regions SSCs 1 and 2 contain a minimum of approximately 3500 and 2500 equivalent O* stars, respectively. The entire region S is subject to an ionizing flux from the equivalent of on the order 11,700 O* stars.
These values could very well be underestimates if a significant fraction of the ionizing flux is absorbed by dust or able to escape from the Hii region, possibly due to clumping in the ISM, which we believe to be an issue for these objects [65, see § V.1 and ]. Such an effect has been observed for Galactic ultracompact Hii regions [43, 38, e.g.,], for which it is estimated that typically % of the ionizing flux from the embedded stars escapes to an outer diffuse halo. We can estimate an upper limit to this effect for sources SSCs 1 and 2 in SBS 0335052 by assuming that any flux able to leak from these regions is still contained in the larger region S. This comparison suggests that % of the ionizing flux may be able to escape the immediate vicinity of SSCs 1 and 2, and is in reasonable agreement with the escape fraction of % estimated by Reines, Johnson, & Hunt [65].
IV.4. Age of the SSCs
The ages of the star clusters in SBS 0335052 are not well constrained by our observations. However, the existence of thermal radio emission from only SSCs 1 and 2 suggests that they are younger than the other four SSCs detected in the optical with HST. Several other observations support the extreme youth of SSCs 1 and 2.
For example, Vanzi et al. [86] observe a very large equivalent width, one of the highest ever observed for an extragalactic object. While none of the clusters show emission, SSCs 4 and 5 are considerably brighter than SSCs 1 and 2 in the far-ultraviolet continuum [42]. This is consistent with SSCs 1 and 2 having younger ages and thus suffering from more extinction in the natal cloud. More recently, Reines, Johnson, & Hunt [65] find that SSCs 1 and 2 have ages Myr based on fitting model SEDs to optical photometry and measuring H equivalent widths, which is consistent with the earlier work of Thuan et al. [79]. We find that the Pa equivalent width is not a reliable tracer for age due to the near-IR excess and free-free emission that can significantly contaminate the continuum [65]. The upper limit of 3 Myr arises because hydrogen emission-line widths and stellar colors are insensitive to differences in ages less than this, while the ionizing flux is roughly constant before the most massive stars have started to die. Moreover, the stellar synthesis models are not well-calibrated at these extremely young ages. This upper limit of 3 Myr agrees with previous radio studies [39, e.g.] that conclude that the SSCs which are detectable as optically-thick thermal radio sources are Myr (based on statistics). SSCs 3-6, which are not detected in the radio, have ages ranging from Myr [65].
The seemingly insignificant difference in age of a few Myr for an SSC could actually be important; Myr is a very “special” epoch in the life of a young starburst. SSCs and their environment undergo a tremendous amount of development between 1 Myr and 6 Myr, making this age range important to target for studying the details of their early evolution. First, this age is just after the onset of significant Wolf-Rayet (W-R) populations at Myr [49]; the W-R component augments by a factor of ten or so the amplitude of the cluster stellar wind [50]. Second, at 3.5 Myr, Type II SNe begin to explode, further disrupting the ISM through shocks, and increasing still more the amount of thermalized gas streaming out of the confines of the star cluster [9, e.g.]. This is the age when the ISM is subjected to an abrupt change in mechanical energy input because of the SN contribution, and to a lesser extent from the W-R winds. The presence of a small, but measurable, W-R population in SSC 3 [60, 31], but not in SSCs 1 and 2, is a confirmation of the younger age of these latter clusters.
During this short period of only a few million years, the clusters will transform from being optically obscured and extremely luminous in the infrared, to completely optically visible with little to no extinction. Very young sources are embedded in dense cocoons of gas and dust and show rising radio spectra which gradually flatten and become fainter as they become increasingly optically thin with time [6, 35, 16]. The clusters at ages of 4 Myr but older than 3 Myr will develop a wind component in their SEDs, unlike younger clusters without W-R stars and SNe. At lower frequencies, the spectra should begin to steepen around 3.5 Myr because of the non-thermal emission from Type II SNe, and finally become predominantly non-thermal as the thermal Hii emission dies out at 10 Myr. Thus, with sufficient sensitivity, the radio spectral energy distribution can also serve as a diagnostic of a cluster’s evolutionary stage. As discussed above, the maximum age that SSCs 1 and 2 could have is Myr, and they could be as young as Myr. By contrast, SSCs 4 and 5 are Myr [65], and fully optically visible with no detected radio or thermal infrared emission.
Given the non-thermal emission detected on large scales by Hunt et al. [23], it is clear that previous episodes of star formation have taken place in SBS 0335052. However, at the present time we are not able to precisely associate the non-thermal emission with a specific cluster or clusters.
IV.5. Stellar Content and Star Formation Rates
The stellar content of the radio Hii regions can be estimated from their Lyman continuum luminosities (neglecting any leakage or dust absorption) using the Starburst99 models of Leitherer et al. [49]. For a cluster 3 Myr old, formed instantaneously with a Salpeter IMF, 100 upper cutoff, 1 lower cutoff (note that reducing the lower mass cutoff to 0.1 increases the cluster mass by a factor of ), and 5% solar metallicity, a cluster has s-1. Assuming that scales directly with the cluster mass, we find that the thermal regions around SSCs 1 and 2 are powered by stellar clusters with masses (Table 4). Since the ionizing luminosity is roughly constant from 1-3 Myr, this result is independent of age, as long as the age of the clusters is 3 Myr. These masses are roughly a factor of two lower than those found by Reines, Johnson, & Hunt [65], because of the underluminosity of the radio emission relative to the optical SEDs (see V.1).
In these young massive clusters, the number density of just the O* stars is high: 3000 such stars in a sphere of 4 pc radius gives 11 pc-3. These densities are such that the extent of a typical stellar wind would significantly overlap with that of its neighbor in less than 1 Myr [88, e.g.,]. The effect of these “colliding winds” should be strong X-ray emission [61, 57], over and above the diffuse X-ray emission expected from the adiabatic interaction of the stellar wind [9, 8]. Compact X-ray emission is indeed observed in SBS 0335052 [77], although the spatial resolution of those observations is insufficient to associate it only with SSCs 1 and 2.
At an age of 3 Myr, the individual clusters SSCs 1 and 2 would together provide a bolometric luminosity of , according to the models of Starburst99 for an instantaneous burst with a metallicity of 5% solar. This is in reasonable agreement with the infrared luminosity of SBS 0335052 estimated from the dust emission, [21, 13]. The additional ionizing luminosity in the entirety of region S would yield . This excess at larger scales could mean that the dust is intercepting only about 50% of the ionizing radiation globally. Consequently, the bolometric luminosity inferred from infrared observations could be underestimated.
The instantaneous star formation rate (SFR) can be estimated using the luminosity. Following Kennicutt [36]:
| (7) |
The inferred value from the 1.3 cm emission yields a SFRyr-1 for region S (270 pc in diameter), which is quite substantial. Alternatively, with an upper limit to the age (3 Myr) and an estimate of the stellar mass of the SSCs ( , corrected by a factor of 2.5 to extend the IMF down to and dividing by a factor of 0.6 to roughly correct for the fraction of escaping radiation), we can simply determine an average SFR, and find 1.4 yr-1. By comparison, using emission, Thuan et al. [79] find a SFR for the entire galaxy of yr-1, already among the highest SFRs observed in BCDs [15]. This discrepancy may suggest that a substantial portion of the current star formation that is traced by thermal radio emission in SBS 0335052 is hidden from view in optical recombination lines [24]. However, there is at least a % dispersion between SFR calibrations from different authors [e.g. 36, and references therein], which could partially account for the observed discrepancy. This is similar to the difference in star formation derived from optical and radio observations for the BCD Haro 3 [34]. Clearly the nascent star formation in region S is a major event for this dwarf galaxy, and serves to highlight the impact a small region of star formation can have on a small dwarf galaxy.
The relevance of such an impact can be perhaps better appreciated by considering that this relatively high (for a dwarf galaxy) star formation rate takes place in a very small region. Considering a volume with radius 135 pc (as for Region S), we would derive a star-formation per unit area of 23 yr-1 kpc-2. This is comparable to, although lower than, the starburst intensity limit of 45 yr-1 kpc-2 derived by Meurer et al. [55] from observations of starbursts at various wavelengths. Star formation in the SSCs in SBS 0335052 is occurring very close to the maximum intensity observed in the universe, and, unlike larger systems, this mode of star formation dominates the energy output of the entire galaxy.
V. The Starburst in SBS 0335052
In what follows, we discuss the consequences of our results in the context of the galaxy itself, and their impact on our knowledge of how stars form in low-metallicity environments.
V.1. The Porous Circum-cluster Medium
Several different results suggest that the ISM surrounding the natal clusters in SBS 0335052 is porous and clumpy. First, the spectral fit of Region S suggests that there is ionizing radiation beyond the strict boundaries of the SSCs 1 and 2. The volume emission measure N and the number of ionizing photons (see IV.3) of region S are nearly twice as large as the sum of SSCs 1 and 2 (Table 4). This implies that there are ionized zones outside of the strict confines of the SSCs that contribute to the radio emission. The extended emission could be caused by a low level of distributed star formation. Alternatively, it could be caused by ionizing radiation that has escaped from the compact Hii regions via a porous ISM. This effect due to ionizing radiation leakage has also been observed for ultra compact Hii regions in the Milky Way [43, 38].
In previous work, Thuan et al. [80] inferred a clumpy ISM in SBS 0335052 based on their H2 absorption-line observations. More recently, Reines, Johnson, & Hunt [65] also reveal evidence for a porous and clumpy ISM surrounding the young SSCs 1 and 2: the measured ionizing luminosities from , , and optically-thin free-free radio emission are lower than expected compared to the optical SEDs. Reines et al. infer that of ionizing photons from the stellar continuum are leaking out of the immediate vicinity of the clusters before intercepting hydrogen to ionize. Thus, a significant fraction of the ionizing flux is escaping without contributing to the measured ionized gas emission.
Finally, despite the substantial extinction derived from mid-IR observations toward this region [81, 62, 21, 20], some UV continuum light is still able to escape [42]. Moreover, optically-derived extinctions are quite low [30, 65]. This would naturally follow from inhomogeneities in the surrounding dust that would simultaneously allow for large extinctions derived from mid-IR emission originating from dense dust clumps (as opposed to a uniform screen) and low extinction regions from relatively transparent lines-of-sight into the birth cloud [see 65, for a full analysis and discussion].
Given the impact that clumping of the ISM can have on the resulting observed spectral energy distribution, as seen in this case for SBS 0335052 it is important to keep the potential effect of clumpiness and inhomogeneities in mind when interpreting similar data.
V.2. Toward Reconciling the Inferred Extinction
The nature of the observed and predicted line ratios in SBS 0335052 has been a source of discussion in the literature [24, 23, 75, 65, 76, e.g.]. In particular, an apparent discrepancy between the thermal radio emission and infrared line fluxes was first discussed by Hunt et al. [23] using global fluxes, and by Thompson et al. [75] using a preliminary version of the radio observations now published here. The intrinsic thermal flux in Hunt et al. [23], inferred from fitting the radio SED, is about 50% lower than we find with these new observations, and thus appeared to be under-luminous with respect to previous near-infrared (NIR) recombination line measurements (e.g., and ). The unpublished radio flux densities used by Thompson et al. [75] were derived from a smaller aperture than used in this paper, consequently resulting in lower flux densities. Using the updated values, we find that the observed and predicted values ( and erg s-1cm-2, respectively) are in good agreement for a native extinction of A, which is significantly lower than the A adopted by Thompson et al. [see 65, for further discussion]. Thus, we conclude that observed emission line fluxes and line ratios are fully consistent with the flux densities obtained from the new radio observations presented here.
V.3. Stellar Winds?
Thuan & Izotov [78] found evidence for P Cygni profiles in SBS 0335052, integrated over the 22 arcsec2 aperture of the Goddard High-Resolution Spectrograph aboard the HST. This aperture is sufficiently large to encompass all 6 SSCs in SBS 0335052, so it was difficult to pinpoint their origin. The most likely scenario seemed to be that they arise from massive stellar winds in the older clusters to the northwest [78], rather than the younger ones to the southeast. This conclusion is supported by later observations of wider profiles in SSCs 4 and 5 than in SSCs 1 and 2 [31].
More recently, Thompson et al. [75] interpreted the radio flux densities of SSCs 1 and 2 as resulting from a dense stellar wind causing self-absorption at all observed radio wavelengths. If there were such a wind powering the radio emission in SBS 0335052, we would first expect no spectral turnover at the highest frequencies observed, in contrast with the spectral energy distribution of region S. We would also expect significant NIR recombination line excesses relative to “normal” Hii-region emission. Infrared recombination lines are expected to show the effect of dense stellar winds much more than the radio, because the radio signature of such winds is at least two orders of magnitude weaker than the effect on NIR recombination line opacity [72, 71, e.g.]. Such an effect is observed for the massive O stars in the Galactic Center Arches Cluster [58, 44]. Relative to the ratio in Hii regions, the IR-line-to-radio-continuum ratio for those stars is 250; in other words, the IR line emission generated from ionized winds around massive stars is roughly 250 times stronger relative to the radio continuum than it would be in an Hii region. This is entirely consistent with stellar wind theory [40, 71, 72, e.g.,]. However, NIR line excesses are not observed in SBS 033505255 5 Hunt et al. [23] found such an excess, but their thermal radio flux is half of what we deduce from the new high-resolution observations presented here.. Because of the consistency with our new radio observations and the NIR recombination lines [65, e.g.,], we conclude that SSCs 1 and 2 do not show evidence for massive stellar winds. The lack of observed winds is consistent with both their young age of 3 Myr (no W-R population) and low metallicity [1, 50, 11, mass loss goes roughly as , see]. Because the combined effects of young age and low metallicity conspire to reduce wind power, a lack of winds alone does not constrain the ages of SSCs 1 and 2 to be young. However, winds have been observed in other clusters in SBS 0335052 (see above), which suggests that the difference could be the older age of those SSCs.
V.4. Dearth of Non-Thermal Emission at High Resolution
The data presented here are fully consistent with purely thermal models. The results of non-thermal models only give a marginally better fit for source SSC 1 than the purely thermal models, and at the cost of additional free parameters. Nevertheless, if non-thermal emission is included in model fits, S1 is consistent with having a non-thermal fraction at 5 GHz of % with a non-thermal slope of . The best fits for SSC 2 and Region S are purely thermal. In order to include a sufficiently weak non-thermal (synchrotron) emission in the model fits, these data could at most support roughly a single SN observed soon after explosion, or alternatively a larger number of SNe at somewhat later epochs.
None of the SSCs in SBS 0335052 have detectable non-thermal radio emission in the data presented in this paper. At best, SSCs 5 and 6 have marginal radio detections at 1.3 cm. SSCs 4, 5, and 6 all appear to be sufficiently old that they are likely to contain a number of SNR. However, based on a comparison with the predictions of Hirashita & Hunt [16], the expected non-thermal flux originating from these clusters is slightly below the sensitivity limits of these data, which are relatively high-frequency and not optimized for the detection of non-thermal sources.
If the observations were to definitively detect the presence of such non-thermal emission from these natal clusters (assuming it were not due to a projection or confusion effects), it would serve as a strong lower limit on the age of the star cluster. Stellar evolutionary models predict that no SNe could have exploded before 3.5 Myr [49]. This age would be in contradiction to the results from Kobulnicky & Johnson [39], which suggest (based on statistics) that the lifetime of the “ultradense Hii regions” is Myr. In addition, upper limits on the ages of SSCs 1 and 2 of Myr were determined by Reines, Johnson, & Hunt [65] using optical and infrared observations; these results provide additional support for the young ages of these clusters, and thus the expected lack of non-thermal emission.
These results may appear to be in contradiction with previous results from Hunt et al. [23], in which a non-thermal component was detected. However, Hunt et al. [23] obtained lower resolution observations of SBS 0335052 that are sensitive to larger-scale spatial structure than the observations presented here (by virtue of interferometers acting as spatial filters). The flux densities derived from the lower resolution observations are over-plotted on the high-resolution observations in Figure 5. The Hunt et al. data clearly indicate the presence of non-thermal emission in SBS 0335052, as manifest in the negative slope of the spectral energy distribution. A comparison between the two data sets demonstrates that the observations presented here are resolving out a substantial fraction of the longer wavelength emission at 6 cm [23, roughly 44% of that observed by], while recovering all of the emission at shorter wavelengths. The unresolved 20 cm source in the lower resolution observations is also offset to the northwest of SSCs 1 and 2 (see Figure 3), but there is no evidence in those observations for a peak in non-thermal emission at the location of the thermal radio sources. However, the center of the diffuse non-thermal emission could possibly coincide with a faint optical source, visible in the ACS image toward SSC 3.
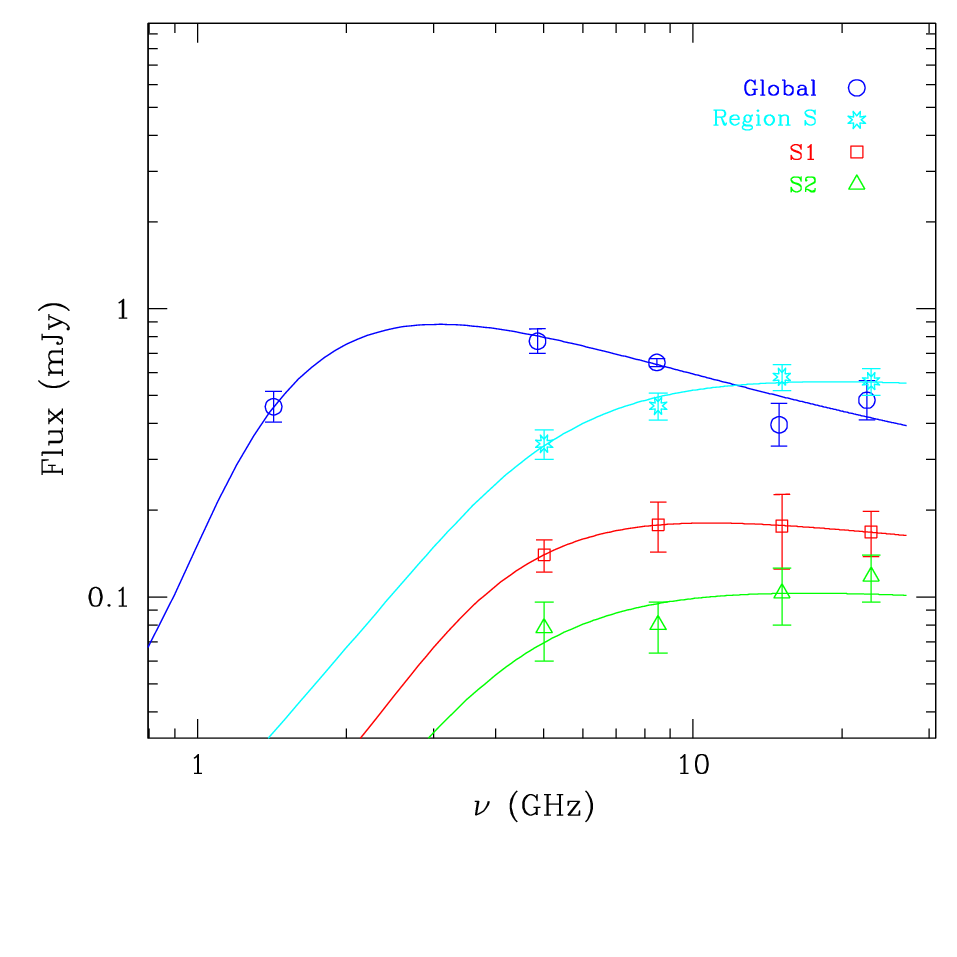
We ascribe this difference to the diffuse nature of synchrotron halos around massive star clusters [7, 22, e.g.,]. The dearth of non-thermal emission in these high-resolution observations suggests that the non-thermal emission is diffuse in nature, and not obviously associated with the compact thermal radio sources we detect. If the synchrotron halo of I Zw 18 were to be placed at the distance of SBS 0335052, it would be resolved out by our high-frequency observations (LAS2″). Such halos are dominant at low frequencies and have low surface brightness, which makes them difficult to detect with the observations presented here. Hence, we conclude that our observations are not inconsistent with previous ones. Moreover, the presence of non-thermal emission in close vicinity to the compact thermal radio sources also suggests that significant star formation has taken place preceding the birth of sources SSCs 1 and 2.
V.5. The Importance of Metallicity in Massive Star Cluster Evolution
Natal super star clusters presumably emerge from their birth cocoons via a combination of expansion of the high pressure regions, radiative dissociation of molecules and dust, and stellar winds. The interplay of these processes will affect the timescales in the evolution of natal clusters, and in particular how rapidly a cluster emerges from its birth material. Each of these processes has a dependence on metallicity, and thus the low metallicity of SBS 0335052 could potentially have a strong combined effect on the early evolution of the natal clusters that it hosts.
First, the pressure of the ionized gas within the cluster may be affected by metallicity. Metallicity has a fundamental role in the rapidity of radiative cooling of the ISM within and outside the cluster [52, 70, 74], and therefore the pressure of the region will be affected. The average pressure of the ionized gas in the clusters implied by the densities we infer from the spectral fits is quite high, dyne cm-2. Given the ionized gas electron temperature of =20000 K [27] is roughly twice the “typical” value expected for Hii regions, it follows that the pressure would be correspondingly twice as high as that found in a typical Hii region. A comparison with other galaxies hosting natal clusters suggests that the inferred pressure for the SSCs 1 and 2 in SBS 0335052 is similar to in other SSCs in dwarf galaxies [32, 33, 83, 4, e.g., He 210, IC 4662, NGC 5253, II Zw 40]. However, given the uncertainties in the model fits to the spectral energy distributions, the inferred pressures are, at best, accurate to within a factor of two. More precise measurements of the pressure in natal SSCs from a range of environments will help to address this issue.
The metallicity can also affect the abundance of molecules and dust in the natal cocoon. First, at low metallicities, the relative amount of molecules and dust is expected to be lower than in higher metallicity counterparts. Moreover, the dust itself has a critical role in the formation and survival of molecules [19, 67, 68, 18, e.g.], thus there is an intimate connection between metallicity, dust, and molecules. In addition, lower metallicity systems will also have harder radiation fields and create a more hostile environment for molecules and dust [51, 46, e.g.]. These effects would tend to shorten the timescale for a natal SSC to emerge from its birth material. SSCs 1 and 2 in SBS 0335052 are already associated with some optical emission, consistent with this scenario, and it is possible that the low metallicity environment has accelerated the emergence process. However, the partial emergence of these clusters could also simply reflect their nominal evolutionary state, and we are not able to discriminate between these possibilities with existing data.
Another mechanism by which metallicity may affect the early evolution of massive clusters is via their stellar winds. It is well known that the effect of massive stellar winds decreases with metallicity [1, 50, 87, 41, 11], primarily due to reduced line blanketing. Even before the onset of the W-R phase and the first supernova in a cluster, the mechanical energy input from the massive star winds alone is more than an order of magnitude weaker for systems with metallicity as low as SBS 0335052 compared to solar metallicity counterparts [49]. In contrast to the effects discussed above, the reduced mechanical energy input for a low metallicity cluster would tend to lengthen the embedded phase – radiation pressure would not be able to clear away the surrounding material as effectively. However, at the present time, it is unclear which (if any) of these effects will have a dominant role in the early evolution of massive star clusters with low metallicity.
VI. Summary
This paper examines the radio continuum properties of current star-forming regions in the extremely low-metallicity galaxy SBS 0335052 using high-resolution VLA observations. Two intense star-forming regions are detected as luminous thermal radio sources that appear to be extremely young SSCs. The total ionizing flux of the southern star-forming region in the galaxy suggests the presence of “equivalent” O-type stars, and the inferred instantaneous star formation rate for the radio-detected natal star clusters alone is M⊙yr-1 or M⊙yr-1kpc-2, which is close to the starburst intensity limit of M⊙yr-1kpc-2. This star formation rate derived from thermal radio emission also suggests that previous optical recombination line studies are not detecting a significant fraction of the current star formation in SBS 0335-052. The observations presented here also suggest that up to % of the ionizing flux could be leaking out of the compact Hii regions; this in is agreement with previous work that suggests the interstellar medium surrounding the natal clusters in SBS 0335052 is porous and clumpy. Model fits to the radio spectral energy distribution indicate that the global mean density in the youngest SSCs is n cm-3.
A comparison between these radio data and those of Hunt et al. [23] suggest that the observations presented here have resolved out a significant contribution from non-thermal emission over spatial scales not detected in these high-resolution observations. The presence of this diffuse non-thermal emission may indicate a synchrotron halo in the southern region of SBS 0335052, likely associated with a previous episode of star formation in proximity to the natal clusters detected here that has not yet been identified. Such a previous generation of massive stars will have a rapid impact on the chemical enrichment in this very low-metallicity galaxy.
A fundamental question is how SSCs form and evolve at low metallicities. While we cannot presume to answer this with these observations alone, it is clear that SBS 0335052 is undergoing an extreme burst of star formation, the results of which are likely to significantly impact the galaxy’s future evolution. The low metallicity in this galaxy may affect the evolution of the natal clusters in a variety of ways, including inefficient cooling, hard radiation fields, and weak radiation pressure from line blanketing. However, a larger sample of low-metallicity natal clusters with panchromatic observations will be required to address these issues. These observations do, however, conclusively demonstrate that massive star clusters are indeed able to form in low-metallicity environments, which is an important step toward our understanding of globular cluster formation in the early universe.
References
- [1] Abbott, D. C. 1982, ApJ, 259, 282
- [2] Barth, A. J., Ho, L. C., Filippenko, A. V., & Sargent, W. L. 1995, AJ, 110, 1009
- [3] Bate, M. R. 2005, MNRAS, 363, 363
- [4] Beck, S. C., Turner, J. L., Langland-Shula, L. E., Meier, D. S., Crosthwaite, L. P., & Gorjian, V. 2002, AJ, 124, 2516
- [5] Billett, O. H., Hunter, D. A., & Elmegreen, B. G. 2002, AJ, 123, 1454
- [6] Cannon, J. M., & Skillman, E. D. 2004, ApJ, 610, 772
- [7] Cannon, J. M., Walter, F., Skillman, E. D., & van Zee, L. 2005, ApJ, 621, L21
- [8] Cantó, J., Raga, A. C., & Rodríguez, L. F. 2000, ApJ, 536, 896
- [9] Chevalier, R. A., & Clegg, A. W. 1985, Nature, 317, 44
- [10] Condon, J.J. 1992, ARA&A, 1992, 30, 575
- [11] Crowther, P. A., Dessart, L., Hillier, D. J., Abbott, J. B., & Fullerton, A. W. 2002, A&A, 392, 653
- [12] Dale, D. A., Helou, G., Neugebauer, G., Soifer, B. T., Frayer, D. T., & Condon, J. J. 2001, AJ, 122, 1736
- [13] Engelbracht, C. W., Gordon, K. D., Rieke, G. H., Werner, M. W., Dale, D. A., & Latter, W. B. 2005, ApJ, 628, L29
- [14] Elmegreen, B. G., & Efremov, Y. N. 1997, ApJ, 480, 235
- [15] Fanelli, M.N., O’Connell, R.W., Thuan, T.X. 1988, ApJ, 334, 665
- [16] Hirashita, H., & Hunt, L. K. 2006, A&A, 460, 67
- [17] Ho, L. C., & Filippenko, A. V. 1996, ApJ, 466, L83
- [18] Hollenbach, D. J., & Tielens, A. G. G. M. 1997, ARA&A, 35, 179
- [19] Hollenbach, D. J., Werner, M. W., & Salpeter, E. E. 1971, ApJ, 163, 165
- [20] Houck, J. R., et al. 2004, ApJS, 154, 211
- [21] Hunt, L.K., Bianchi, S., & Maiolino, R. 2005, A&A, 434, 849
- [22] Hunt, L. K., Dyer, K. K., & Thuan, T. X. 2005, A&A, 436, 837
- [23] Hunt, L. K., Dyer, K. K., Thuan, T. X., & Ulvestad, J. S. 2004, ApJ, 606, 853
- [24] Hunt, L. K., Vanzi, L., & Thuan, T. X. 2001, A&A, 377, 66
- [25] Hunter, D. A., O’Connell, R. W., & Gallagher, J. S., III 1994, AJ, 108, 84
- [26] Indebetouw, R. et al. 2005, ApJ, 619, 931
- [27] Izotov, Y. I., Chaffee, F. H., Foltz, C. B., Green, R. F., Guseva, N. G., & Thuan, T. X. 1999, ApJ, 527, 757
- [28] Izotov, Y. I., Chaffee, F. H., & Schaerer, D. 2001, A&A, 378, L45
- [29] Izotov, Iu.I., Guseva, N.G., Lipovetskii, V.A., Kniazev, A.Iu., Stepanian, J.A. 1990, Nature, 343, 238
- [30] Izotov, Y. I., Lipovetsky, V. A., Chaffee, F. H., Foltz, C. B., Guseva, N. G., & Kniazev, A. Y. 1997, ApJ, 476, 698
- [31] Izotov, Y. I., Schaerer, D., Blecha, A., Royer, F., Guseva, N. G., & North, P. 2006, A&A, 459, 71
- [32] Johnson, K.E. & Kobulnicky, H.A. 2003, ApJ, 597, 923
- [33] Johnson, K. E., Indebetouw, R., & Pisano, D. J. 2003, AJ, 126, 101
- [34] Johnson, K.E., Indebetouw, R.I., Watson, C., & Kobulnicky, H.A. 2004, AJ, 128, 610
- [35] Johnson, K.E. 2004, NewAR, 48, 1337
- [36] Kennicutt, R.C. 1998, ARA&A, 36, 189
- [37] Keto, E., Ho, L. C., & Lo, K.-Y. 2005, ApJ, 635, 1062
- [38] Kim, K-.T. & Koo, B-.C. 2001, ApJ, 549, 979
- [39] Kobulnicky, H.A. & Johnson, K.E. 1999, ApJ, 539, 1023
- [40] Krolik, J. H., & Smith, H. A. 1981, ApJ, 249, 628
- [41] Kudritzki, R.-P., & Puls, J. 2000, ARA&A, 38, 613
- [42] Kunth, D., Leitherer, C., Mas-Hesse, J. M., Östlin, G., & Petrosian, A. 2003, ApJ, 597, 263
- [43] Kurtz, S.E., Watson, A.M., Hofner, P., Otte, B. 1999, ApJ, 514, 232
- [44] Lang, C. C., Goss, W. M., & Rodríguez, L. F. 2001, ApJ, 551, L143
- [45] Larsen, S. S., Brodie, J. P., Elmegreen, B. G., Efremov, Y. N., Hodge, P. W., & Richtler, T. 2001, ApJ, 556, 801
- [46] Lebouteiller, V., Brandl, B., Bernard-Salas, J., Devost, D., Houck, J.R. 2007, ApJ, 665, 390
- [47] Leitherer, C. 1990, ApJS, 73, 1
- [48] Leitherer, C., Chapman, J. M., & Koribalski, B. 1997, ApJ, 481, 898
- [49] Leitherer, C., Schaerer, D., Goldader, J. D., Delgado, R. M. G, Robert, C., Kune, D. F., de Mello, D. F., Devost, D., Heckman, T. M. 1999, ApJS, 123, 3
- [50] Leitherer, C., Robert, C., & Drissen, L. 1992, ApJ, 401, 596
- [51] Madden, S.C., Galliano, F., Jones, A.P., Sauvage, M. 2006, A&A, 446, 877
- [52] McCray, R., & Kafatos, M. 1987, ApJ, 317, 190
- [53] Melnick, J.; Heydari-Malayeri, M.; Leisy, P. 1992, A&A, 253, 16
- [54] Meurer, G. R., Heckman, T. M., Leitherer, C., Kinney, A., Robert, C., & Garnett, D. R. 1995, AJ, 110, 2665
- [55] Meurer, G. R., Heckman, T. M., Lehnert, M. D., Leitherer, C., & Lowenthal, J. 1997, AJ, 114, 54
- [56] Mezger, P. G. & Henderson, A. P. 1967, ApJ, 147, 471
- [57] Myasnikov, A. V., & Zhekov, S. A. 1993, MNRAS, 260, 221
- [58] Nagata, T., Woodward, C. E., Shure, M., & Kobayashi, N. 1995, AJ, 109, 1676
- [59] Papaderos, P., Izotov, Y.I., Fricke, K.J., Thuan, T.X., & Guseva, N.G. 1998, A&A, 338, 43
- [60] Papaderos, P., Izotov, Y. I., Guseva, N. G., Thuan, T. X., & Fricke, K. J. 2006, A&A, 454, 119
- [61] Pittard, J. M., & Stevens, I. R. 1997, MNRAS, 292, 298
- [62] Plante, S., & Sauvage, M. 2002, AJ, 124, 1995
- [63] Pustilnik, S. A., Brinks, E., Thuan, T. X., Lipovetsky, V. A., & Izotov, Y. I. 2001, AJ, 121, 1413
- [64] Pustilnik, S. A., Pramskij, A. G., & Kniazev, A. Y. 2004, A&A, 425, 51
- [65] Reines, A.E., Johnson, K.E, & Hunt, L.K. 2008, AJ, 136, 1415
- [66] Rubin, R.H. 1968, ApJ, 154, 391
- [67] Salpeter, E. E. 1977, ARA&A, 15, 267
- [68] Savage, B. D., Bohlin, R. C., Drake, J. F., & Budich, W. 1977, ApJ, 216, 291
- [69] Schaerer, D. 2002, A&A, 382, 28
- [70] Silich, S., Tenorio-Tagle, G., & Rodríguez-González, A. 2004, ApJ, 610, 226
- [71] Simon, M., Felli, M., Massi, M., Cassar, L., & Fischer, J. 1983, ApJ, 266, 623
- [72] Smith, H. A., Fischer, J., Schwartz, P. R., & Geballe, T. R. 1987, ApJ, 316, 265
- [73] Smith, L.J., Norris, R.P.F., Crowther, P.A. 2002, MNRAS, 337, 1309
- [74] Tenorio-Tagle, G., Silich, S., Rodríguez-González, A., & Muñoz-Tuñón, C. 2005a, ApJ, 620, 217
- [75] Thompson, R. I., Sauvage, M., Kennicutt, R. C., Jr., Engelbracht, C. W., & Vanzi, L. 2006, ApJ, 638, 176
- [76] Thompson, R. I., Sauvage, M., Kennicutt, R. C., Jr., Engelbracht, C. W., Vanzi, L., & Schneider, G. 2008, ApJ, in press (astro-ph.0810.2540)
- [77] Thuan, T. X., Bauer, F. E., Papaderos, P., & Izotov, Y. I. 2004, ApJ, 606, 213
- [78] Thuan, T. X., & Izotov, Y. I. 1997, ApJ, 489, 623
- [79] Thuan, T.X., Izotov, Y.I., & Lipovetsky, V.A. 1997, ApJ, 477, 661
- [80] Thuan, T. X., Lecavelier des Etangs, A., & Izotov, Y. I. 2005, ApJ, 621, 269
- [81] Thuan, T. X., Sauvage, M., & Madden, S. 1999, ApJ, 516, 783
- [82] Tumlinson, J., Venkatesan, A., Shull, & J.M. 2004, ApJ, 612, 602
- [83] Turner, J. L., Beck, S. C., & Ho, P. T. P. 2000, ApJ, 532, L109
- [84] Vacca, W.D. 1994, ApJ, 421, 140
- [85] Vacca, W.D., Garmany, C.D., & Shull, J.M. 1996, ApJ, 460, 914
- [86] Vanzi, L., Hunt, L. K., Thuan, T. X., & Izotov, Y. I. 2000, A&A, 363, 493
- [87] Vink, J. S., de Koter, A., & Lamers, H. J. G. L. M. 2001, A&A, 369, 574
- [88] Weaver, R., McCray, R., Castor, J., Shapiro, P., & Moore, R. 1977, ApJ, 218, 377
- [89] Whitmore, B. C. 2003, A Decade of Hubble Space Telescope Science, 153