X-ray emission from the extended disks of spiral galaxies
Abstract
We present a study of the X-ray properties of a sample of six nearby late-type spiral galaxies based on XMM-Newton observations. Since our primary focus is on the linkage between X-ray emission and star formation in extended, extranuclear galactic disks, we have selected galaxies with near face-on aspect and sufficient angular extent so as to be readily amenable to investigation with the moderate spatial resolution afforded by XMM-Newton. After excluding regions in each galaxy dominated by bright point sources, we study both the morphology and spectral properties of the residual X-ray emission, comprised of both diffuse emission and the integrated signal of the fainter discrete source populations. The soft X-ray morphology generally traces the inner spiral arms and shows a strong correlation with the distribution of UV light, indicative of a close connection between the X-ray emission and recent star formation. The soft (0.3–2 keV) X-ray luminosity to star formation rate (SFR) ratio varies from ( yr-1)-1, with an indication that the lower range of this ratio relates to regions of lower SFR density. The X-ray spectra are well matched by a two-temperature thermal model with derived temperatures of typically keV and keV, in line with published results for other normal and star-forming galaxies. The hot component contributes a higher fraction of the soft luminosity in the galaxies with highest X-ray/SFR ratio, suggesting a link between plasma temperature and X-ray production efficiency. The physical properties of the gas present in the galactic disks are consistent with a clumpy thin-disk distribution, presumably composed of diffuse structures such as superbubbles together with the integrated emission of unresolved discrete sources including young supernova remnants.
Keywords:
Galaxies: ISM – galaxies: spiral – X-rays: galaxies1 Introduction
The first detailed studies of the X-ray emission from nearby late-type galaxies were carried out with the Einstein observatory and revealed both individual luminous X-ray sources, as well as an extended, often complex, underlying structure (Fabbiano 1989). In a number of near edge-on star-forming systems. such as M82 (Watson et al. 1984), evidence was also found for hot outflowing winds. The superior spatial resolution and enhanced soft X-ray response of ROSAT greatly extended this work, leading to the detection of substantial numbers of discrete sources as well as establishing a much clearer picture of the diffuse emission components (e.g. Read et al. 1997). More recently the advent of XMM-Newton and Chandra has extended our knowledge of the discrete X-ray source populations and the ultrahot ISM in nearby galaxies to unprecedented luminosity and surface brightness thresholds (e.g. Strickland et al. 2004a; Colbert et al. 2004; Pietsch et al. 2004; Fabbiano 2006; Yang et al. 2007; Bogdán & Gilfanov 2008; Bauer et al. 2008).
The diffuse X-ray emission associated with the disks of spiral galaxies is believed to arise in gas heated by shocks generated as a result of supernova explosions and stellar wind interactions (Chevalier & Clegg 1985; Strickland et al. 2000; Suchkov et al. 1994; Grimes et al. 2005). This is supported by analysis of the X-ray spectra of individual shell-type supernova remnants (SNRs) of reasonable age, which are often characterised by plasma temperatures in the range 0.2-0.8 keV, similar to the values obtained when studying larger-scale structures in galactic disks. Strickland et al. (2004a) showed that the luminosity of the diffuse X-ray emission observed in star-forming galaxies is proportional to the rate of mechanical energy injection into the ISM from young stars. Mas-Hesse, Oti-Floranes & Cervino (2008) further found that the ratio of the soft X-ray luminosity to far infrared luminosity, taking the latter as a proxy for the star-formation rate (SFR), is strongly dependent on the efficiency with which mechanical energy is converted into soft X-rays and also the evolutionary status of the star formation episode. This all argues for a close connection between soft X-ray emission and star formation in late-type galaxies.
| Galaxy | Hubble Type a | Distance b | D25 a | Inclination b | Foreground c | Nucleus |
|---|---|---|---|---|---|---|
| (Mpc) | (′ ) | (∘) | () | |||
| NGC300 | SA(s)d | 2.0 | 21.8 | 30 | 3.6 | - |
| M74 | SA(s)c | 11.0 | 10.5 | 7 | 4.8 | - |
| NGC3184 | SAB(rs)cd | 11.6 | 7.2 | 1.0 | - | |
| M51 | SA(s)bc | 8.4 | 7.3 | 20 | 1.8 | Sy 2 |
| M83 | SAB(s)c | 4.5 | 12.9 | 24 | 3.9 | Starburst |
| M101 | SAB(rs)cd | 7.2 | 26.9 | 18 | 1.1 | - |
a - Hubble type and the major-axis diameter (D25) from the RC3
catalogue (de Vaucouleurs et al. 1991).
b - See §4.2 for references.
c - values based on Dickey & Lockman (1990).
| Galaxy | Observation ID | Start Date | Filter a | Target co-ordinates b | Useful exposure (ks) | ||||
|---|---|---|---|---|---|---|---|---|---|
| (yyyy-mm-dd) | pn/MOS1/MOS2 | RA (J2000) | Dec (J2000) | pn | MOS 1+2 | ||||
| NGC300 | 0112800201 | 2000-12-26 | M/M/M | 29.4 | 65.1 | ||||
| 0112800101 | 2001-01-01 | M/M/M | 40.4 | 88.4 | |||||
| 0305860401 | 2005-05-22 | M/M/M | 27.2 | 64.9 | |||||
| 0305860301 | 2005-11-25 | M/M/M | 30.4 | 68.2 | |||||
| M74 | 0154350101 | 2002-02-02 | T/T/T | 23.3 | 49.9 | ||||
| 0154350201 | 2003-01-07 | T/T/T | 23.5 | 50.2 | |||||
| NGC3184 | 0028740301 | 2001-11-02 | T/T/T | 19.9 | 49.9 | ||||
| M51 | 0112840201 | 2003-01-15 | T/T/T | 18.8 | 40.6 | ||||
| 0212480801 | 2005-07-01 | M/M/M | 20.4 | 56.7 | |||||
| 0303420101 | 2006-05-20 | T/T/T | 32.3 | 77.3 | |||||
| 0303420201 | 2006-05-24 | T/T/T | 14.1 | 43.0 | |||||
| M83 | 0110910201 | 2003-02-18 | T/M/M | 18.3 | 38.2 | ||||
a - T = thin filter, M = medium filter.
b - Assumed position of the galactic nucleus.
A recent study of a sample of 12 nearby spiral galaxies using Chandra (Tyler et al. 2004) has shown strong correlation between soft diffuse X-ray emission and sites of recent star formation in spiral arms traced by mid-infrared and H emission. A similar investigation has not been completed using XMM-Newton, but a number of studies of individual spiral galaxies have been reported (Pietsch et al. 2001; Takahashi et al. 2004; Trudolyubov et al. 2005; Warwick et al. 2007), which again demonstrate the strong linkage between tracers of star formation and diffuse X-ray emission. Furthermore, a dual-component thermal model, with characteristic temperatures of keV and 0.6–0.7 keV, very often provides a good description of the spectrum of the diffuse X-ray emission. Studies of the point source X-ray luminosity function (XLF) in spiral galaxies (Tennant et al. 2001; Soria & Wu 2003; Colbert et al. 2004) have shown that the brightest point sources contain the bulk of the integrated point source luminosity, suggesting that, provided a sufficient number of the brightest point sources are excluded, it should in principle be possible to probe the underlying structure of the galaxy to relatively low levels of surface brightness.
In this paper, we focus on the spectral and morphological properties of the diffuse X-ray emission emanating from the extended disks of late-type normal galaxies, as deduced from XMM-Newton observations. In §2, we identify a sample of nearby galaxies with close to face-on disks of sufficient angular extent so as to be readily amenable for study with XMM-Newton. We then outline the data reduction methods employed (§3). Using image analysis, we sub-divide the total X-ray luminosity of each galaxy into the contribution of spatially resolved bright sources and a residual component comprising the integrated emission of unresolved point sources and the diffuse galactic emission (§4). On the basis of published source luminosity functions, we estimate the likely contribution of truly diffuse emission to this residual signal. We go on to investigate spectral properties of both the bright source and the unresolved (residual) components (§5). We also consider the morphology of the residual emission in the context of the star formation evident in the galactic disks (§6). Finally we discuss the implication of our results (§7) and briefly summarise our conclusions (§8).
2 Galaxy Sample and Observations
In this paper we investigate the large-scale spatial and spectral properties of the X-ray emission emanating from the extended disks of six nearby late-type spiral galaxies. The galaxies in question are NGC300, M74, NGC3814, M51, M83 and M101, brief details of which are given in Table 1. In a previous paper (Warwick et al. 2007; hereafter W07), we reported the results of an XMM-Newton study of one of these galaxies, namely M101, and here we apply a similar methodology to extend the sample, thereby allowing the intercomparison of the galaxy X-ray characteristics based on XMM-Newton observations.
When dealing with X-ray spectral imaging data of only moderate spatial resolution (as afforded by XMM-Newton), the presence of a number of very bright point sources has the potential to obscure the properties of the underlying galaxy. Since our goal is to study the latter rather than the former, we have limited our galaxy sample to nearby face-on systems of Hubble type Sbc-Sd with major-axis D25 extent greater than 7′ , thereby ameliorating the source confusion problem. (We have excluded M33 from our study since this galaxy has a D25 diameter of 70′ and thus extends well beyond the EPIC field of view; M33 is the subject of a specific XMM-Newton programme utilising multiple pointings (Pietsch et al. 2004; Misanovic et al. 2006).
Details of the XMM-Newton EPIC observations of the five new additions to our galaxy sample are summarised in Table 2.
3 Data Reduction
The data reduction was based on SAS v8.0. The datasets were initially screened for periods of high background by accumulating full-field 10–15 keV light curves. MOS data were excluded during periods when the 10-15 keV count rate averaged over 100 s bins exceeded 0.2 , and the pn data were similarly excised when the pn count rate exceeded 2 . As summarised in Table 2, the exposure times after event filtering within individual observations ranged from 14 to 40 ks in the pn camera (with typically slightly greater exposure in the MOS cameras).
In W07, we discussed how the use of an appropriate spatial mask greatly reduced the “contamination” arising from the presence of relatively small numbers of luminous point sources in the disk of M101. Here we employ a refinement of this masking technique in our analysis of the XMM-Newton observations of five further target galaxies.
3.1 Image Construction
The starting point of our analysis, for each galaxy and for each individual observation, was the creation of pn, MOS 1 and MOS 2 images and associated exposure maps in three energy bands: soft (0.3–1 keV), medium (1–2 keV) and hard (2–6 keV). In all cases, the pixel size was set at . For both the image analysis and the subsequent spectral analysis, we utilised single and double pixel events in the pn camera (pattern 0–4) and single to quadruple events (pattern 0–12) in the MOS cameras. The resulting images were then flat-fielded by subtraction of a constant background particle rate (estimated from count rates recorded in the corners of the CCD detectors not exposed to the sky) and division by the relevant exposure map. At the same time, spurious data from bad pixels, hot columns and chip gaps were excluded. Where there was more than one observation, the images pertaining to a given instrument and band were at this point combined into a single mosaiced image. For each band, the resultant flat-fielded MOS 1 and MOS 2 images were combined to give a “MOS” image and finally a “pn+MOS” image was also produced by summing the individual pn and mos images (with appropriate scaling in regions affected by chip gaps, where there was incomplete coverage in one of the instrument channels).
Figures 1 & 2 show the soft-band images derived for each of the five new galaxies, together with the corresponding data for M101 from W07. In the case of M74, NGC3184, M51 and M83 our analysis pertains to circular regions centred on the galactic nucleus of diameter equal to the major-axis D25 dimension, whereas for NGC 300, given the relatively low X-ray surface brightness, we restrict our attention to a central 10′ diameter region (0.46 of the D25 extent). Similarly for M101 the X-ray analysis reported in W07 applies to a central 20′ diameter region (0.74 of the D25 dimension). Hereafter we refer to these galaxy-centred circular regions as the “X-ray extraction regions”.


3.2 Spatial masking of bright sources
In order to produce a spatial mask to suppress the bright source contamination it was necessary to construct a catalogue of the bright sources associated with each galaxy. The starting point was a preliminary source-list for each galaxy derived from the second XMM-Newton Serendipitous Source Catalogue (2XMM; Watson et al. 2008), encompassing those sources located within the galaxy extraction region (as defined above). Next we determined the net count-rate of each source in the broad-band pn+MOS image11 1 The pn+MOS1+MOS2 count-rate above the local background was determined within a cell of radius centred on the source position. A correction factor was then applied to allow for the signal contained in the wings of the point spread function (PSF) extending beyond the nominal source cell.. Those sources for which the measured count rates exceeded a defined count-rate threshold (specific to each galaxy) were then included in the final “master” source-list for the galaxy. In the case of both M83 and NGC 300 two additional sources, not included in the 2XMM catalogue, but clearly present in the images at count-rates above the threshold were added by hand. Similarly in the case of M51 one additional source was added. The number of sources included in each master source-list is given in Table 3, together with the threshold setting (quoted as the equivalent unabsorbed source luminosity in the 0.3–6 keV band on the basis of a source spectrum consisting of power-law continuum with absorbed by the Galactic foreground ). At this stage we also determined the count rates for each source in the soft, medium and hard bands by applying the above process to the appropriate pn+MOS sub-band images.
| Galaxy | X-ray Regiona | Threshold LXb | Number in | Number of high LX sources |
| (′ ) | () | Source List | (LX) | |
| NGC300 | 10.0 | 0.2 | 22 | 0 |
| M74 | 10.5 | 5.0 | 20 | 4 |
| NGC3184 | 7.2 | 6.0 | 18 | 4 |
| M51 | 7.3 | 4.0 | 26 | 6 |
| M83 | 12.9 | 2.0 | 40 | 2 |
a - Diameter of the “X-ray extraction region”.
b - Nominal LX threshold applied in the 0.3–6 keV band in defining sample.
The next step involved the creation of the spatial mask. To this end, we produced a simulated image of the point sources present in the broad-band pn+MOS observation. The MOS- and pn-camera PSFs were modelled for each energy band as a set of sub-images representing the PSF out to from the source position. A simulated sub-image of each source (in three bands and two instruments) was then produced by scaling the appropriate PSF image so as to match the actual image data (in terms of the count rate contained within the nominal source cell). The resultant set of sub-images were then co-added with suitable spatial offsetting so as to simulate the surface brightness distribution in the broad-band pn+MOS image deriving from bright point sources within the galaxy field22 2 As a final iteration, count rates were extracted from the simulated images within a cell centred on each source position and compared to those obtained from the actual data, with any differences attributable to the PSF spreading of signal from adjacent sources. Based on this analysis, the nominal source count rates were adjusted to compensate for this source confusion effect and a new version of the simulated images was produced.. A spatial mask was then derived from this image by applying an appropriate surface brightness cut.
Figure 3 shows the simulated “bright source image” derived using the above procedure for M83. In this example, the bright source mask was obtained by applying a surface brightness cut to the image at a level of 0.07 pn+MOS1+MOS2 , leading to a “spillover” fraction, (i.e., the fraction of the bright source signal not contained within the masked region) of 9%. Similar surface brightness cuts were applied to the other galaxies resulting in spill-over fractions in the range 9-12%.
The derived spatial masks were used to separate the “bright source region” from the “residual emission region” in both the spatial and spectral analysis. In order to study the spatial distribution of the residual emission (see §6), a simulated image representative of the soft band data was subtracted from the corresponding pn+MOS image and the source mask imposed - see Figure 3. This process serves to to suppress much of the “contamination” arising from the brightest sources in the galaxy, including the bulk of the spillover into the residual galaxy region. Note that a slightly different approach is necessary in the spectral analysis; here we take account of the bright source signal spilling into the residual emission region by including an appropriate fraction of the bright source spectral model in the spectral fit of the residual emission - see §5.2.
| Galaxy | Spillover/Area | Component | LX() | |||
|---|---|---|---|---|---|---|
| Factors (%) | (0.3-1 keV) | (1-2 keV) | (2-6 keV) | (0.3-6 keV) | ||
| NGC300 | 12/7 | Bright Sources | 0.19 | 0.07 | 0.25 | 0.51 |
| Unresolved Sources | [0.02] | [0.01] | [0.03] | |||
| Residual Galaxy | 0.05 | - | - | 0.05 | ||
| Total Measured | 0.24 | 0.07 | 0.25 | 0.56 | ||
| M74 | 11/24 | Bright Sources | 1.4 | 1.3 | 3.0 | 5.7 |
| Unresolved Sources | [0.5] | [0.4] | [0.8] | |||
| Residual Galaxy | 1.4 | 0.7 | - | 2.1 | ||
| Total Measured | 2.8 | 2.0 | 3.0 | 7.8 | ||
| NGC3184 | 9/22 | Bright Sources | 1.2 | 1.4 | 3.4 | 6.0 |
| Unresolved Sources | [0.6] | [0.5] | [0.9] | |||
| Residual Galaxy | 2.0 | 0.5 | - | 2.5 | ||
| Total Measured | 3.2 | 1.9 | 3.4 | 8.5 | ||
| M51 | 12/24 | Bright Sources | 6.8 | 3.8 | 6.5 | 17.1 |
| Unresolved Sources | [0.5] | [0.4] | [0.8] | |||
| Residual Galaxy | 6.3 | 0.9 | - | 7.2 | ||
| Total Measured | 13.1 | 4.7 | 6.5 | 22.3 | ||
| M83 | 9/30 | Bright Sources | 2.5 | 2.0 | 3.1 | 7.6 |
| Unresolved Sources | [0.5] | [0.4] | [0.9] | |||
| Residual Galaxy | 3.3 | 0.7 | - | 4.0 | ||
| Total Measured | 5.8 | 2.7 | 3.1 | 11.6 | ||
3.3 Spectral Extraction
The soft-band images shown in Fig. 1 & 2 demonstrate the existence of an extended emission component in addition to the population of bright point sources. On the basis of the approach described earlier, we extracted the integrated spectrum of both the bright source region (bounded by the spatial mask) and the residual emission region (corresponding to the full X-ray extraction region less the masked area).
The relatively large extent and complicated shapes of the bright source and residual emission regions makes the evaluation of the background subtraction somewhat more complicated than with most XMM-Newton data. In this context, the use of “blank-sky” XMM fields to produce a background spectrum would be far from ideal, because the sky X-ray background in the soft band varies from field to field, and this is a vital component of the total background signal we wish to subtract. Instead, we extracted spectra from both an annulus surrounding the defined galaxy region and also from the corner regions of each detector not exposed to the sky. By using an appropriate scaling of these spectra, using the method detailed in W07, an appropriate model background spectrum can then be produced. The SAS tools arfgen and rmfgen were used to produce appropriate Auxiliary Response File (ARF) and Response Matrix File (RMF) files for the source and residual galaxy regions. Finally, the counts recorded in adjacent (raw) spectral channels were summed to give a minimum of 20 counts per spectral bin in the final set of spectra.
4 Overview of the galactic X-ray properties
4.1 The contribution of luminous point sources
By application of the spatial mask described earlier, we are able to measure the count rates (net of background) in the soft, medium and hard band images associated with both the “bright source regions” and the “residual emission regions” (hereafter we refer to the latter as the “residual galaxy”). Table 4 summarises the results for each of the five new galaxies in our sample. Here we have converted the measured count rates to equivalent fluxes in the band on the basis of a specific spectral model and then transposed from flux to luminosity using the distances quoted in Table 1. For the bright source regions we assume a spectral model consisting of a power-law continuum with photon index modified by the foreground absorption in our Galaxy. For the residual galaxy we use the model which best fits the actual spectrum of this component, as derived in §5.2. The quoted X-ray luminosities (LX) have been corrected for foreground absorption, that is they are unabsorbed values.
The LX values reported in Table 4 have been corrected for two further effects. The first is the spillover of bright source flux into the residual galaxy region (discussed earlier). The second correction relates to the fact that the bright source mask obscures a sizeable fraction of the galaxy disk. To correct for this, we have scaled up the residual galaxy component by a factor derived from interpolating the azimuthally-averaged brightness distribution (as represented by the radial distributions of the X-ray surface brightness discussed in §6) into the masked regions. The spillover fraction and the area correction factor applicable to each galaxy are listed in Table 4.
The results in Table 4 demonstrate that whereas the set of very luminous sources represented by our bright source sample provide the dominant contribution to the total galactic X-ray luminosity above 2 keV, at lower energies, and particularly below 1 keV, the split between the bright source and residual galaxy contributions is more balanced, albeit with the exception of NGC 300. For the latter galaxy, we were able to set a much lower threshold for bright source removal than was possible for the other galaxies in the sample (on account of the relatively proximity of NGC 300 - see Table 1). In other words a higher fraction of the integrated X-ray flux from point sources was resolved in this galaxy. However, we show later (see §6) that the low surface brightness inferred for the underlying diffuse X-ray emission in NGC 300 is mostly likely due to the low SFR density in this Galaxy rather than being simply a consequence of a more stringent source rejection threshold. For M74, NGC 3184, M51 and M83 a broadly similar source detection threshold transposes to luminosity thresholds for source exclusion ranging from (for M83) up to (for NGC 3184). The likely contribution of unresolved sources to the residual galaxy emission in each case is investigated below and a correction to a fixed luminosity threshold is applied later in the analysis (see §7).
As a further exercise it is possible to estimate the likely contribution to the residual galaxy emission of an unresolved population of somewhat less luminous sources with spectral characteristics and distribution similar to the sources represented in the bright source list. Here we make use of recent results from Chandra, which show that the discrete source luminosity function appropriate to the disk regions of spiral galaxies typical takes the form of a power-law with a slope in the range to (in the cumulative form). For example, Tennant et al. (2001) quote a slope of for the disk sources in M81, whereas Doane et al. (2004) measure for NGC 3184 and Pence et al. (2001) report for M101. Soria & Wu (2003) examine the log N – log S relation for relatively faint HMXBs in the disk of M83 and find a broken power-law provides a reasonable fit to the data, with a low-luminosity index of . Also Colbert et al. (2004) measure a similar range of power-law slopes for the source luminosity function within a relatively large sample of spiral galaxies. The flatness of this form means that relatively small numbers of very luminous sources provide the bulk of the integrated luminosity residing in discrete sources. Furthermore, in the context of providing a rough estimate of the contribution of unresolved sources to the residual galaxy signal, it implies that we can, in principle, extrapolate below our source detection threshold to arbitrarily faint levels (assuming of course that the slope of the luminosity function remains constant over an appropriately wide range of source luminosity).
Here we make the assumption that the slope of the source luminosity function is across the set of galaxies and over a wide luminosity range. We then use the number of bright sources actually observed in the galaxy from the threshold luminosity up to a fixed upper cut-off (set here as LX - see Table 3), to define the normalization of the source luminosity function for that particular galaxy. We first calculate the integrated emission of unresolved sources in the broad 0.3-6 keV band and then, on the basis of the bright source spectral model noted earlier, split this into soft-, medium- and hard-band contributions. The entries in Table 4 under the heading “unresolved sources” summarises the results on a galaxy by galaxy basis. In the soft band, which is the focus of our attention in describing the X-ray morphology and the linkage of X-ray emission to star formation, the potential contribution of unresolved, but relatively luminous, source populations to the measured residual galaxy emission ranges from as low as % in M51 up to % in NGC300. By implication the bulk of the residual galaxy luminosity in this band must reside in some combination of: (i) truly diffuse X-ray emission associated with the galaxy disk presumably resulting from the energy input of supernova and stellar winds and (ii) the integrated emission of populations of relatively soft spectrum, lower-luminosity sources such as supernova remnants, cataclysmic variables, active binaries and stellar coronal sources, populations which are not well represented in the bright-source (i.e., high LX) samples. There is also a potential contribution from a putative extended galactic halo, which is often seen in edge-on galaxies; however the face-on aspect of the present galaxies suggests that a very extended halo component will be difficult to distinguish from the components confined to the disk.
4.2 X-ray characteristics of the individual galaxies
Figures 1 & 2 compare the galaxy morphology observed in soft X-rays with that measured in the far ultraviolet FUV ( Å) band by GALEX33 3 The GALEX images were obtained from the public archive at http://galex.stsci.edu/GR2/, although in the case of NGC 3184 we use the XMM-Newton Optical Monitor UVW1 ( Å) image recorded in the same observation as the X-ray data (see Table 2) to make this comparison. In all cases the the UV images were lightly smoothed with a circular gaussian mask with 4″. In a number of the galaxies, particularly M74, M83 and M101, the X-ray emission traces segments of the inner spiral arms which are delineated as very pronounced features in the FUV images. In all cases the central concentration of the soft X-ray emission and its fall-off with increasing galactocentric radius is quite well matched to the surface brightness distribution measured in the FUV channel. This general correlation of soft X-ray and FUV light immediately establishes the close connection of a significant component of the X-ray emission with recent star-formation in these late-type systems. We explore the linkage between the X-ray emission and star-formation in more detail in §6. Here we briefly comment on each of these galaxies, in the context of their extended X-ray emitting components.
4.2.1 NGC 300
NGC300 is an SA(s)d spiral seen at low inclination ( de Vaucouleurs et al. 1991) at a distance of 2.0 Mpc (Freedman et al. 2001). Many large HII regions are visible throughout the galaxy, and there is evidence that the galaxy has experienced many episodes of star formation. However, star formation in the central regions appears to be suppressed in recent times, with a small population of stars present in the central arcminute of the galaxy with ages below 1 Gyr (Davidge 1998). There is clear evidence of spiral structure, although the contrast between “arm” and “off-arm” regions in the galaxy is low. In X-rays NGC300 has been studied by ROSAT (Read & Pietsch 2001) and more recently by XMM-Newton (Carpano et al. 2005). Carpano et al. (2005) report the presence of diffuse emission in the galactic disk of NGC 300 with LX and temperatures of and keV. In the current paper we determine the aggregate luminosity of the 20 brightest point sources within the central 5′ of NGC300 to be LX, in agreement with earlier studies. We estimate the X-ray luminosity of the residual emission to be (0.3–1 keV). The surface brightness of this component is extremely low but appears to trace a central bar-like structure and to extend out to at least a distance of 2.5 kpc ().
4.2.2 M74
M74 (NGC 628) is an SA(s)c spiral seen almost face-on ( Shostak & van der Kruit 1984) at a distance of 11 Mpc (Gil de Paz et al. 2007). The nuclear region of the galaxy is characterised by strong HII emission with no evidence for the presence of an AGN. A grand-design twin-armed spiral structure is observed. In X-rays M74 has been studied by both Chandra (Krauss et al. 2005) and XMM-Newton (Soria & Kong 2002; Soria, Pian & Mazzali 2004), albeit with little attention, to date, on the diffuse X-ray component. In the present analysis we confirm the presence of an extensive discrete source population in M74 with an aggregate luminosity in the 20 brightest point sources amounting to . The underlying residual X-ray emission has a luminosity of . This component traces the inner spiral arm structure and is evident out to a distance of 9 kpc (3′ ), at which point it falls below the background level.
4.2.3 NGC 3184
NGC3184 is an SAB(rs)cd barred spiral seen at low inclination (; Lyon-Meudon Extragalactic Database [LEDA]44 4 at http://leda.univ-lyon1.fr) at a distance of 11.6 Mpc (Leonard et al. 2002). The nuclear region of the galaxy is dominated by HII emission with no compelling evidence for an AGN (Doane et al. 2004). Grand-design twin spiral arms are observed, although the contrast in brightness between “arm” and “off-arm” regions in the galaxy is low. In X-rays NGC3184 has been studied by Chandra with an emphasis on both the point source population (Colbert et al. 2004) and the diffuse X-ray emitting gas (Doane et al. 2004; Tyler et al. 2004). The diffuse X-ray emission shows a strong correlation with regions which are bright in H (Tyler et al. 2004). Doane et al. (2004) report the presence of diffuse X-ray emission concentrated in areas of younger stellar populations and star-forming regions, with a surface brightness five times greater in spiral arm regions than in off-arm regions. The spectrum of the diffuse emission in the galactic disk can be well fitted with a two-temperature thermal model with kT of keV and keV (Doane et al. 2004). In the present study we measure the aggregate luminosity of the 18 brightest point sources to be , consistent with earlier Chandra estimates (Colbert et al. 2004). The residual X-ray emission has an X-ray luminosity of and extends from the nucleus out to a distance of 8 kpc ().
4.2.4 M51
M51 (NGC5194) is an SA(s)bc spiral seen almost face-on (; Tully 1974) at a distance of 8.4 Mpc (Feldmeier, Ciardullo & Jacoby 1997). It hosts a low-luminosity active galactic nucleus, which shows optical emission lines and is classified as a Seyfert 2 (Stauffer 1982; Ho, Filippenko & Sargent 1997). M51 is interacting tidally with a companion SB0/a galaxy (NGC5195), and both systems are seen to contain starburst activity. There is grand-design twin-arm spiral structure present. In X-rays M51 has been studied by Einstein (Palumbo et al. 1985), ROSAT (Marston et al. 1995; Ehle et al. 1995), ASCA (Terashima et al. 1998) and more recently by Chandra (Terashima & Wilson 2004; Colbert et al. 2004; Tyler et al. 2004) and XMM-Newton (Dewangan et al. 2005). Studies have also been carried out at higher X-ray energies by BeppoSAX (Fukazawa et al. 2001). The diffuse X-ray emission is well correlated with the radio continuum and mid-infrared emission distributed in the spiral arms establishing a clear link with star formation (Ehle et al. 1995; Tyler et al. 2004). Terashima & Wilson (2004) find that the diffuse X-ray emission in the southern extranuclear cloud is well fitted with a single-temperature thermal model with kT of keV. The current analysis confirms the general properties of the galaxy established by the ROSAT and Chandra observations. The aggregate luminosity of the brightest 25 point sources in M51 is (0.3–6 keV), 28% of which is attributable to the nuclear source. Our analysis reveals residual soft X-ray emission extending from the bright nucleus along the spiral arms out to a distance of 5 kpc (). Lower surface brightness emission from the extended disk is observed out to a radial distance of 9 kpc in all directions, with further X-ray emission joining M51 to its companion galaxy. The X-ray luminosity of the residual component is .
4.2.5 M83
M83 (NGC 5236) is an SAB(s)c barred spiral seen at low inclination (; Talbot, Jensen & Dufour 1979) at a distance of 4.5 Mpc (Thim et al. 2003). It harbours an active nuclear region undergoing a violent starburst, a circumnuclear starburst and grand-design twin-armed spiral structure. There are numerous sites of active star-formation coincident with the spiral arms (Vogler et al. 2005). In X-rays M83 has been studied by Einstein (Trinchieri et al. 1984), ROSAT (Ehle et al. 1998; Immler et al. 1999), ASCA (Okada, Mitsuda & Dotani 1997 and more recently by Chandra (Soria & Wu 2002; Soria & Wu 2003; Colbert et al. 2004; Tyler et al. 2004). On an arcminute scale both the ROSAT and Chandra X-ray observations trace apparently diffuse emission associated with the inner spiral-arms (Immler et al. 1999; Soria & Wu 2003; Tyler et al. 2004). Immler et al. (1999) report the diffuse emission associated with a cluster of bright HII regions embedded in the south-western spiral arm as having a two-temperature thermal characteristic with kT of keV and keV. In the present analysis we measure the aggregate luminosity of the bright point sources in M83 to be , which includes a contribution of from the central region. The XMM-Newton soft band image traces emission from the bright nuclear region out along the twin spiral arms to a galactocentric distance of about 4 kpc (). Extended X-ray emission of relatively low surface brightness can then be further traced out to kpc. The X-ray luminosity of the residual component is .
5 Spectral Analysis
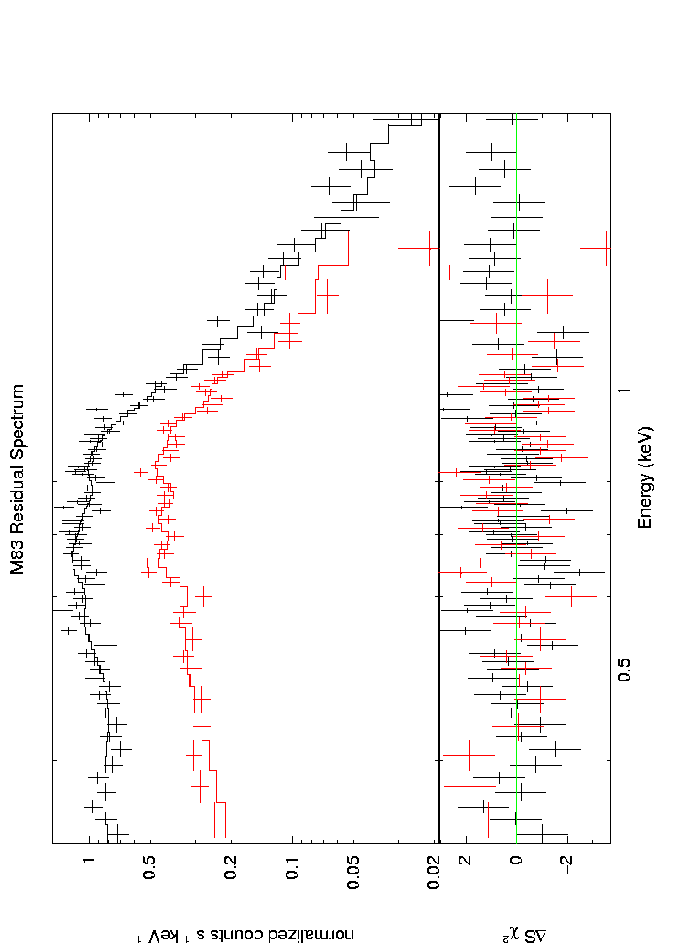
Using the methodology outlined in §3.3, spectral datasets were obtained for both the bright-source and the residual-galaxy regions for four galaxies, namely M74, NGC3184, M51 and M83. For simplicity, we based our analysis on a single observation for each galaxy, namely the observation with the deepest pn exposure (see Table 2). Due to limited signal-to-noise in the MOS channels, we focus on the spectra derived from the EPIC pn camera, except in the case of M83, where both pn and MOS spectra were fully utilised and in M74 where both datasets were employed in the spectral investigation of its bright-source region. Unfortunately the residual-galaxy emission in NGC 300 was too faint for detailed spectral analysis to be merited. The spectral fitting was carried out using the software package XSPEC Version 12.4.
5.1 Spectra of the bright-source regions
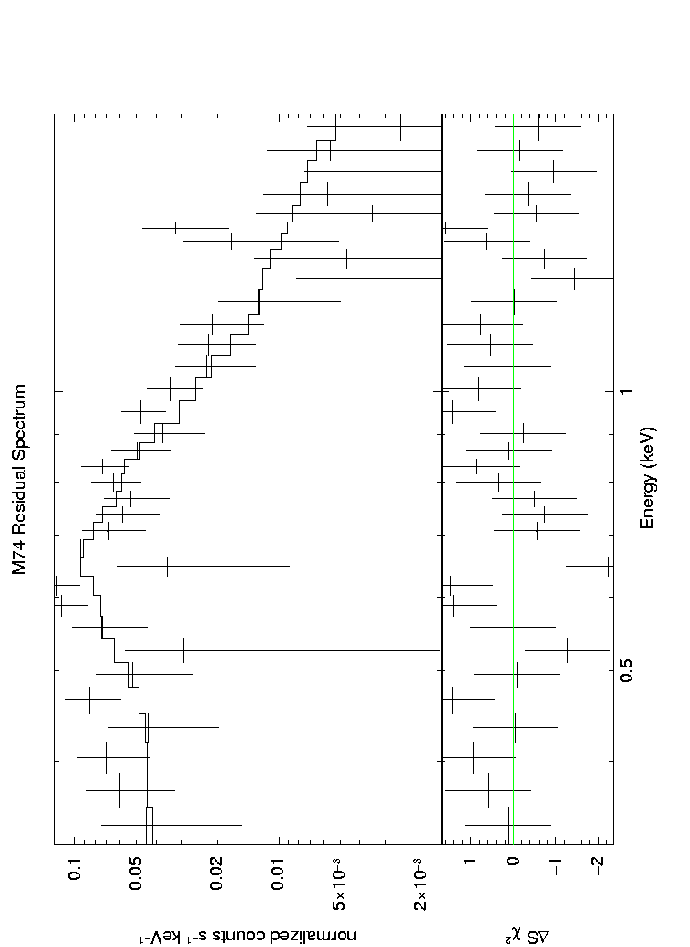
The spectra representative of the bright-source regions in M74, NGC3184, M51 and M83 were well fitted with either a simple power-law continuum or a power-law continuum plus an additional solar-abundance thermal plasma component (the MEKAL model in XSPEC). The best-fit photon indices were all in the range 1.55–1.9 with the temperature of the thermal emission typically keV. Fig. 4 shows the measured spectra, the best-fitting model and residual to these best fits. Similarly, Table 5 summarises the details of the best-fitting models. After correcting for the flux spillover beyond the spatial mask, the inferred luminosities in the integrated bright-source spectra were found to be in general agreement with the estimates quoted previously based on the image analysis. The photon index observed is typical of the spectra of HMXB and LMXB found in the Local Group (Grimm et al. 2007). The thermal emission associated with the bright-source regions is of similar temperature to the “hot” component observed in the residual-galaxy emission (see below). However, where this component is detected in the bright-source spectra, namely in NGC3184, M51 and M83, it appears at a proportionately higher level than might be inferred based on a simple area scaling with respect to the residual-galaxy emission.



| Galaxy | Region | Power-law Cont. | Cool MEKAL | Hot MEKAL | Goodness | Cool:Hot | |
|---|---|---|---|---|---|---|---|
| Photon Index | keV | keV | of Fit | Flux Ratio | |||
| Normalization | Normalization | Normalization | /dof | (0.3–2 keV) | |||
| M74 | Bright Sources | 1.640.06 | - | - | 146/150 | - | |
| Residual Galaxy | - | 0.260.04 | []a | 197/202 | |||
| []a | |||||||
| NGC3184 | Bright Sources | 1.570.10 | - | 0.710.13 | 86/78 | - | |
| Residual Galaxy | - | 0.200.06 | []a | 122/105 | |||
| []a | |||||||
| M51 | Bright Sources | 1.570.05 | 0.190.02 | 0.610.05 | 389/378 | - | |
| Residual Galaxy | 2.900.15 | 0.24 | 0.64 | 210/260 | 1.3 | ||
| M83 | Bright Sources | 1.860.02 | - | 0.610.03 | 796/679 | - | |
| Residual Galaxy | 2.920.15 | 0.240.02 | 0.640.03 | 404/356 | 1.5 | ||
a - Upper bound on the normalization of a 0.65-keV thermal component (95% confidence interval).
| Galaxy | Radiusa | Component | Electron Density | Thermal Energy | Cooling Timescale |
|---|---|---|---|---|---|
| kpc | (keV) | yr | |||
| M74 | 10.0 | 0.2 | 3.1 | 2.5 | 6.6 |
| NGC3184 | 10.0 | 0.2 | 2.1 | 1.9 | 4.3 |
| M51 | 7.5 | 0.2 | 6.7 | 2.4 | 1.9 |
| 0.65 | 5.2 | 5.5 | 8.3 | ||
| M83 | 6.5 | 0.2 | 4.9 | 2.5 | 4.2 |
| 0.65 | 3.1 | 3.6 | 9.5 |
a - Assumed radius of a putative shallow halo component (see text)
5.2 Spectra of the residual-galaxy regions
Previously we estimated that 9-12 per cent of the counts from the bright sources overspill into the residual-galaxy regions. In carrying out the spectral analysis of the latter we have correct for this spillover effect, by including an appropriate fraction of the best-fit bright-source model as a fixed component of the spectral model. Visual inspection of the residual-galaxy spectra revealed almost no emission above 1.5 keV in any of the galaxies. It was further found that thermal models comprising either one or two solar-abundance55 5 In general the quality of the spectra were insufficient to allow useful contraints to be placed on the metal abundances in the thermal plasmas. As noted in W07, the fitting of low resolution spectra pertaining to a complex multi-temperature plasma with simple models can often result in the artifical requirement for strongly subsolar abundances. MEKAL components provided a reasonable fit to the residual-galaxy spectra. In all cases a “cool” thermal component was required at kT keV. The spectra with the best signal-to-noise ratio, namely those for M51 and M83, also required a “hot” thermal component at kT keV. These spectral characteristics appear to be quite typical of the diffuse components seen in normal and starburst galaxies (e.g.,, Fraternali et al. 2002) and consistent with previously published measurements for several of the galaxies in the sample (e.g., Ehle et al. 1998; Soria & Wu 2003; Kuntz et al. 2003; Carpano et al. 2005; W07). The spectra of M51 and M83 also showed evidence for a “soft excess” which, via spectral fitting, was modelled as a soft power-law component with photon index . This latter component contributes 26% of the flux in the 0.3-2 keV band for M83 and 35% for M51. This soft excess may well relate to the contribution of populations of soft sources most notably recent supernova remnants and, in fact, there is ample observational evidence that such sources are very often prominent in the spiral arms of late-type galaxies, for example IC342 (Kong 2003), M33 (Pietsch et al. 2004; Grimm et al. 2005) and M83 (Soria & Wu 2003). After applying an appropriate area-correction factor, the luminosities derived from the spectra data were broadly consistent with those derived from the imaging analysis (see Table 4).
There are two points pertinent to the above spectral analysis. The first is that the spectral modelling did not require the inclusion of any absorption over and above the foreground Galactic which was included as a fixed component in all the models. The implication is that any absorption intrinsic to the host galaxy must be relatively low, commensurate with the fact that we are studying systems which have a near face-on aspect. The second point is that there was no strong evidence in the residual galaxy spectra for a “hard-excess” component attributable to an unresolved population of relatively hard discrete sources. This confirms the conclusions in §4.1, namely that relatively luminous binaries (albeit below the applied luminosity threshold) do not provide a substantial contribution to of the residual-galaxy emission. In fact the lack of clear evidence for hard emission in the spectra of the residual galaxy regions (and also in the corresponding hard-band images) suggests that the estimates in §4.1 of the potential contribution of relatively luminous discrete sources might be best considered as upper-limit values.
For each of the galaxies in the sample, we have measured the relative contribution of the 0.2-keV and 0.65-keV MEKAL components to the X-ray flux measured in the 0.3–2 keV band. The results are summarised in Table 5, where we include the upper limits derived for a fixed 0.65-keV component in the case of M74 and NGC 3184. For comparison, the corresponding flux ratio pertaining to the cool and hot MEKAL components in M101 (from the spectral fitting results in W07) is .
If we assume that all of the emission attributed to thermal components originates in truly diffuse plasma, then it is possible to infer some physical properties of the medium on the basis of a particular geometrical configuration. Here we assume that the thermal plasma is contained within a cylindrical region extending from the centre of the galaxy out to of the D25 radius with a half-width perpendicular to the plane of 0.5 kpc, representing a shallow halo. Using this volume, we can infer the mean electron density through the derived emission measure (where is the ‘filling factor’ - the fraction of the total volume which is occupied by the emitting gas). The derived density combined with the volume and temperature then leads to an estimate of the thermal energy contained within the gaseous component. Based on the measurements from the spectral fitting, we derive the results summarised in Table 6. In the cases of M51 and M83, where the balance between the cool and hot thermal components is most strongly weighted towards the hot component, we find that the thermal energy contained in the hotter component is significantly greater than that in the cooler component and that these two components are not in pressure balance. Our spectral modelling of the residual emission in NGC3184 and M74, although not requiring a 0.65-keV spectral component, does not exclude the presence of such a component in rough pressure balance with the cooler plasma, consistent with the situation pertaining in M101 (W07). The cooling of these plasmas is dominated by line emission with radiative timescales in the range yr (Table 6).
Of course, as noted previously, a more likely scenario is that the bulk of the observed soft emission originates in the combination of diffuse emission closely associated with star-formation in the galactic disk and the integrated emission of the populations of soft sources within the disk.
6 The connection between soft X-ray emission and star-formation
As noted earlier, the general similarity of soft X-ray and FUV images establishes a close linkage between the X-ray emission and recent star-formation in these late-type systems. This connection has previously been demonstrated in many individual galaxies and also in samples of objects; for example Tyler et al. (2004) find a very strong correlation between X-ray emission and both H and mid-infrared emission in a set of spiral galaxies observed with Chandra. In our early study of M101 (W07), we further investigated how the overall point-to-point correlation varies when one contrasts the soft X-ray surface brightness with that measured in different wavebands extending from the FUV through to optical V band. The fact that the best match was between the soft X-ray and U band images was interpreted in terms of two spatial components, namely a clumpy thin-disk component which serves as a tracer of the spiral arms plus a more extended component, possibly located in the lower-halo with a larger filling factor, which produces the central concentration of the soft X-ray emission (W07). However, in the present paper we focus on the relationship between the residual galaxy X-ray emission and the corresponding FUV emission in terms of their radial-averaged spatial distribution.
Using the masked pn+MOS soft band images (such as in Fig. 3), we have derived the radial profiles of the soft X-ray emission for all six galaxies in our sample. The results are shown in Fig. 5 (upper panels). These X-ray radial profiles are based on the signal extracted from circular annuli centred on the galactic nucleus, with suitable normalization to allow for the regions excluded by the spatial masking. Since we wish to compare the X-ray radial distributions with published FUV and star-formation profiles obtained using elliptical annuli (matched to the modest inclinations of these galaxies), we have stretched the scale of the X-ray radial axis by a factor of typically 5–10%, so as to account for the (marginally) different radial gradients obtained if one uses circular as opposed to slightly elliptical annuli.


Figure 5 also shows the corresponding FUV radial brightness distributions taken from the tabulations in Munoz-Mateos et al. (2007) (Table 2 in their paper) except in the case of NGC 3184 where, since GALEX FUV data are not available, we use XMM-Newton Optical Monitor UVW1 ( Å) measurements (without any internal extinction correction). These GALEX FUV data have been corrected for both foreground and internal extinction as discussed in Munoz-Mateos et al. (2007).
Visual comparison of the soft X-ray and FUV profiles suggest that radial fall-off seen in the soft X-ray regime is either very comparable to that seen in the FUV (e.g. NGC 3184 and M83) or somewhat steeper (e.g. NGC 300, M74, M51 and M101). We further use the results of Munoz-Mateos et al. (2007) to compare our current soft X-ray measurements (after applying appropriate scaling factors to convert the X-ray measurements into luminosity per unit disk area) with the inferred radial dependence of the SFR density (i.e. SFR per unit disk area). The results are also shown in Fig. 5 (middle panels). We find that in the inner disks of our sample of late-type galaxies, the soft X-ray luminosity generated per unit SFR (hereafter the X-ray/SFR ratio) ranges from ( yr-1)-1 in the case of NGC 300 up to ( yr-1) for M74 and finally up to ( yr-1)-1 for M51, M83 and M101. Note that these measurements refer to the soft-band 0.3–1.0 keV luminosity after excluding the contribution of the most luminous point sources. There is also the suggestion that the X-ray/SFR ratio declines with galactocentric radius, at least in the case of NGC 300 and M51.
Whereas some correction has been applied to the FUV data to allow for the extinction intrinsic to the host galaxy, we have not applied a similar correction to the soft X-ray data. Earlier we established that based on the spectral fitting, there was no clear evidence for any soft X-ray absorption intrinsic to the host galaxies. Any intrinsic soft X-ray extinction would be most pronounced in the inner galaxy regions potentially giving rise to a central down-turn in the soft X-ray radial distributions - but again there is no compelling evidence for such an effect66 6 We can use the FUV extinction estimates employed by Munoz-Mateos et al. (2007) to predict the soft X-ray absorption using the scaling A(FUV)/ = mag cm-2, which assumes a Galactic dust-to-gas ratio and extinction law with (Bohlin, Savage & Drake 1978; Cardelli, Clayton & Mathis 1989). This leads to estimates of the intrinsic X-ray absorption in the inner disk regions in the range cm-2, across the set of galaxies. Since these values are too high to be consistent with spectral fitting we can conclude either that the assumptions underlying the FUV to X-ray extinction scaling are not valid or, as seems likely, the FUV sources are more strongly embedded in obscuring material than the soft X-ray emission.. As a final check we have looked for spectral trends versus radius by repeating the imaging analysis for two soft X-ray sub-bands, namely 0.3–0.8 keV and 0.8–1.2 keV. We then determine a spectral hardness ratio as (H-S)/(H+S), where H refers to the 0.8–1.2 keV band and S to the 0.3–0.8 keV band. Figure 5 (lower panels) shows the measured variations in spectral hardness versus radius. These curves show no marked spectral variations towards the inner galaxy regions, thus confirming that intrinsic absorption does not strongly influence the soft X-ray measurements.
The demarkation of the above sub-bands at 0.8 keV corresponds roughly to the position in the M51 and M83 spectra at which the cool and hot thermal components contribute equally. It follows that the spectral hardness profiles in Fig. 5 track the ratio of these two thermal components as a function of galactocentric radius. If we consider the three sources with best signal-to-noise, we find no variation in spectral hardness versus radius in M101, a hint of spectral softening versus radius in M83 and the hint of an opposite trend in M51.
| Galaxy | Disk Radial Extent | SFR | LX(0.3–2 keV)a | Cool:Hot | |
|---|---|---|---|---|---|
| Inner (kpc) | Outer (kpc) | yr-1 | Flux Ratio | ||
| NGC300 | 0 | 2.9 | 0.19 | 0.11 | - |
| M74 | 0 | 16.7 | 5.2 | 1.2 | |
| NGC3184 | 0 | 12.2 | - | 3.4 | |
| M51 | 2.4 | 8.9 | 7.5 | 6.8 | 1.3 |
| M83 | 1.3 | 8.5 | 3.5 | 3.4 | 1.5 |
| M101 | 0 | 20.9 | 8.1 | 4.3 | 3.8 |
a - Luminosity after excluding sources with LX (0.3–6 keV)

7 Discussion
A major objective of our investigation is to intercompare the X-ray properties and other characteristics of the extended disks of the six late-type galaxies which comprise our sample. To that end we have summarised some of the results from the current analysis in Table 7. In brief this table provides the following information. We first define the extent of the disk region considered in X-rays. For this intercomparison we have chosen to exclude a central 1′ radius region in both M51 and M83, so to avoid the complications associated with the AGN and/or the nuclear starburst. We have next calculated the total SFR within the specified disk region by integrating under the exponential fits to the starburst density radial profiles reported by Munoz-Mateos et al. (2007). We next report the luminosity associated with the disk by taking our soft band residual luminosity estimates and then correcting both to a common source exclusion threshold of LX (0.3–6 keV) (using essentially the same methodology as applied in §4.2) and to a broader 0.3--2 keV band-pass (using the spectral models for the residual emission regions discussed earlier77 7 In the case of NGC300 we assume a single component (0.2-keV) MEKAL spectrum and for M101 we use the spectral model reported in W07.). These corrections were generally less than except for NGC300, where the luminosity increased by a factor of 2.2 as a result of a significant additional contribution from discrete sources. Finally, we also note the relative strengths of the cool (0.2-keV) and hot (0.65-keV) thermal components in terms of the ratio of their fluxes in the 0.3–2 keV (band), as inferred from the spectral modelling (§5.2).
The results summarised in Table 7 establish that averaged over the defined disk regions, the X-ray/SFR ratio varies from a maximum of ( yr-1)-1 in the case of M51 and M83 down to ( yr-1)-1 in M74. However, these disk-average values mask a trend, which is evident in Fig. 6, where we have plotted the X-ray/SFR ratio versus the local SFR density. Above a local SFR density of yr-1 pc-2 (corresponding to the inner disks of M51 and M83), the X-ray/SFR ratio is consistent with an upper bound value of ( yr-1)-1. However, below a local SFR density of yr-1 pc-2, there is significant scatter in the ratio, spanning a range up to a factor 5 below the maximum. On the one hand some of this scatter appears to be due to the fact that all five galaxies show evidence for a fall-off in the X-ray/SFR ratio in their outer disks. On the other hand systematic errors in both the X-ray and FUV measurements will grow in importance as one tracks a signal of rapidly decreasing surface brightness against an essentially constant background. Nevertheless, these results do suggest that the efficiency of X-ray production may be sensitive to the local level of star-formation activity in the disk.
In a recent study, Mas-Hesse, Oti-Floranes & Cervino (2008) (hereafter MH08) have investigated the temporal evolution of both the soft X-ray and far infrared (FIR) luminosity following a burst of star formation. The starting point of their analysis is the adoption of a stellar population synthesis model which follows the evolution of a cluster of massive stars formed either at the same time (which MH08 refer to as an instanteous burst, IB) or at a constant rate over a period of several tens of Myr (an extended burst, EB). In either scenario, diffuse soft X-ray emission is produced through the heating of bubbles within the interstellar medium to temperatures of K as a result of the mechanical energy input from the winds of massive stars created in the starburst or the eventual destruction of such stars in supernovae. Their model also includes the soft X-rays emitted by individual SNR during the adiabatic expansion phase of their evolution, but excludes any contribution from the stellar atmospheres (which in any case would be extremely small) or accreting high-mass X-ray binaries created in the region. MH08 (see their Figure 1) find that the soft X-ray luminosity increases rapidly during the first few Myr following the onset of starburst activity, largely through the input power of the stellar winds of the most massive stars. After the first 3 Myr, the most massive stars produce supernovae and thereafter it is the mechanical energy of such explosions which dominates the energy budget. In the IB models the soft X-ray luminosity peaks at Myr, whereas in the EB models it continues to rise, albeit more gradually, until eventually an equilibrium is established between the formation and destruction of stars (after typically Myr for solar metallicities).
In comparing our present measurements with the predictions of MH08 it is important to bear in mind that we have used SFR estimates based on FUV measurements (Munoz-Mateos et al. 2007), which in turn rely on the UV-to-SFR calibration suggested by Kennicutt (1998). As noted by MH08, the Kennicutt (1998) calibration assumes star formation over a wide 0.1–100 mass range, whereas the SFR values they quote are for a more restricted 2–120 range (which has a more direct bearing on the resulting soft X-ray and FIR luminosity). Assuming a Salpeter initial mass function, one obtains the scaling SFR(2-120)/ SFR(0.1-100) , implying that our estimates of the X-ray/SFR ratio should be increased by a factor 3.4 when making a comparison with the MH08 predictions. Our upper-bound estimate, after applying the above scaling, becomes ( yr-1)-1, which correponds to the X-ray/SFR ratio predicted some 10 Myr after the onset of an extended burst of star-formation, assuming a efficiency in the conversion of mechanical energy into X-ray emission. Although it can be argued that star formation in the disks of late-type spiral galaxies generally proceeds over long-periods of time, the underlying activity pattern is presumably one of localised bursts of star formation, so a match with “young” extended bursts is perhaps not unreasonable. Of course, in matching the observations to the predictions, the efficiency of X-ray production and the duration of the EB episode are inversely linked, for example the above X-ray/SFR ratio is also reached after 30 Myr in the EB scenario, provided the energy conversion efficiency is scaled down to just . Clearly a more detailed study, taking into account additional information relating to the current star formation rate and the star formation history relevant to each galaxy disk, might well pin down these parameters - but such an analysis is beyond the scope of the current paper.
A number of recent studies have investigated whether the integrated soft (nominally 0.5-2 keV) or hard (2-10 keV) X-ray luminosities measured in galaxies not dominated by a central AGN might serve as a proxy for the underlying galaxy-wide SFR (e.g. Grimm, Gilfanov & Sunyaev 2003; Ranalli, Comastri & Setti 2003; Gilfanov, Grimm & Sunyaev 2004), which might then be applicable to more distant objects (e.g. Rosa-Gonzalez et al. 2007). If we consider the Ranalli, Comastri & Setti (2003) calibration of the SFR in terms of the integrated soft X-ray luminosity (their equation 14), apply the corrections noted by MH08 and also scale the X-ray luminosity from a 0.5–2 keV bandpass to the 0.3–2 keV bandpass (which increases the luminosity by a factor of depending on the spectral assumption), we obtain an X-ray/SFR ratio in the range ( yr-1)-1 which is factor higher than the (upper-bound) value derived from the current analysis. The difference is, of course, due to the fact that Ranalli, Comastri & Setti (2003) use the integrated soft X-ray luminosity of the entire galaxy, which includes a very substantial contribution from the bright discrete source population. In fact the ratio of the total galaxy luminosity to the residual galaxy luminosity over the 0.3-2 keV band for our current set of galaxies (see Table 4) is typically in the range , consistent with this picture. It follows that when using the Ranalli, Comastri & Setti (2003) calibration to convert soft X-ray measurements to SFR rate estimates, an implicit assumption is that both the rate of production of X-ray binaries following a starburst and the subsequent balance between point source and diffuse luminosity is comparable to that pertaining in local galaxies.
As discussed above there is evidence that the X-ray/SFR ratio falls as the local SFR density declines, implying that the interstellar environment influences either the starburst and/or the efficiency with which its energy is reprocessed into the X-rays. Factors which may potentially be relevant include the local gas density (relevant to the conversion of mechanical energy into heat via shocks) and the local metallicity (which may, for example, influence the evolution timescales of massive stars, their stellar wind properties and the emissivity of the X-ray plasma heated by the starburst). It is also notable that the galaxies in our current sample with the highest X-ray/SFR ratios are those with the strongest weighting towards hot plasma (as measured by the cool:hot flux ratios in Table 7). In this context it would seem entirely plausible that X-ray production efficiency and “mean” plasma temperature are coupled quantities. Although the current data are too restricted to merit further consideration of these issues, such effects may well be relevant when attempting to fine tune the calibration of the soft X-ray luminosity versus SFR relation for specific applications in which the bright source component is spatially resolvable.
Star formation in the disks of spiral galaxies is thought to be triggered by the passage of a spiral density wave through the ISM. The resultant massive star formation results in copious FUV emission which in turn is rapidly reprocessed into H and FIR emission. As discussed above, the mechanical energy input from stellar winds and supernovae eventually gives rise to X-ray emission. This would seem to give an immediate explanation of the strong correlation observed between the infrared, optical and UV star-formation tracers and the soft X-ray emission seen in spiral galaxies (e.g., Read & Pietsch 2001; Kuntz et al. 2003; Tyler et al. 2004, W07). However, the underlying timescales are not identical. UV and H emission will be produced on a timescale commensurate with the lifetime of the most massive stars ( years), whilst according to model predictions (Leitherer & Heckman 1995; Cervino, Mas-Hesse & Kunth 2002; MH08), it takes approximately ten times longer to maximise the diffuse X-ray emission. Given the delay between the peak in UV/H emission and the X-ray heating, one might predict a spatial offset between the diffuse X-ray emission and the other spiral tracers more closely tied to the passage of the spiral density wave. For example, W07 argue that in the case of M101 one might predict a rotational lag of at a galactocentric radius of kpc (given a rotational velocity and assuming that the spiral pattern corotates with the disk material at kpc). However, lags of this magnitude are not generally evident in the X-ray morphology of late-type galaxies (Tyler et al. 2004).
Assuming a gas filling factor 1 and a spatial extent perpendicular to the plane of the galaxy of 0.5 kpc, we earlier derived radiative cooling timescales in the range yr (Table 6). These estimates are comparable to the galaxy rotational periods in the region sampled by the current X-ray measurements and are clearly inconsistent with the presence of narrow X-ray spiral arm features. Matching the radiative timescales to the “young” extended burst scenario discussed earlier would require 1, consistent with a clumpy thin-disk distribution for the X-ray emitting plasma most closely associated with the spiral arms. In practice, however, the observed X-ray emission will encompass a complex web of diffuse features extending over a range of spatial scales including superbubbles and, in the most active regions, outflows into the lower galactic halo (e.g. Strickland et al. 2004a; Strickland et al. 2004b). Where there is no confinement by chimneys or similar structures in the ISM, energy losses arising from adiabatic expansion of the hot gas in the disk may also help localise the spiral arm component (W07). Relatively luminous discrete sources including young SNRs, some perhaps linked to disk population stars in interarm regions, together with aggregations of less luminous objects, add further to the mix.
8 Conclusions
We have used XMM-Newton observations in a study of the extended extranuclear disks of six nearby face-on spiral galaxies. Using a novel spatially masking technique to minimise the impact of the brightest discrete sources, we have investigated both the spatial morphology and the spectral properties of the residual soft X-ray emission emanating from the disk regions. The strong correlation found between soft X-ray and FUV images in terms of the tracing of specific spiral features and the overall radial extent of the emission unambigously establishes a close link between the soft X-ray emission and recent star formation.
More detailed comparison of the radial profiles of soft X-ray and FUV surface brightness distributions establishes an X-ray/SFR ratio of ( yr-1)-1 (referred to the 0.3–2 keV band and where the SFR applies to stars in the mass range 2–120 ) for the inner disks of M51 and M83. This is roughly a factor 2.5 below the soft X-ray to SFR calibration report by Ranalli, Comastri & Setti (2003), consistent with the fact that our estimate excludes the contribution of discrete sources with LX (0.3–6 keV). Our measured X-ray/SFR ratio matches that predicted some 10 Myr after the onset of an extended burst of star formation in the models of MHO7, when the efficiency of the conversion of mechanical energy input to X-rays is set at . Our observations suggest a fall-off in the X-ray/SFR ratio as the local SFR density declines, implying that the interstellar environment influences either the starburst and/or the efficiency with which its energy is reprocessed into the X-rays.
With the bright sources excluded, the spectra of the residual galaxy regions are, in the main, well matched by a two-temperature thermal plasma model. The characteristic temperatures of and keV are in line with published results for other spiral and starburst galaxies. The relative strengths of these two components varies across the sample, with the galaxies having the highest X-ray/SFR ratio characterised by a higher “mean” temperature. The physical properties of the gas found in the disk are shown to be consistent with a clumpy thin-disk distribution presumably composed of diffuse structures such as superbubbles together with individual SNRs and other source aggregations.
Future observations should allow more detailed investigation of a wide range of factors, for example the local gas density and the local metallicity, which might influence the X-ray/SFR ratio measured in late-type galaxy disks.
Acknowledgments
We thank the referee for providing very useful suggestions for the improvement of this paper. The X-ray data presented in this paper were obtained from the public archive maintained by the XMM-Newton science operations centre at ESAC. The GALEX data were obtained from the Multimission Archive at the Space Telescope Science Institute (MAST). RAO acknowledges the receipt of a PPARC/STFC research studentship.
References
- Bauer et al. (2008) Bauer M., Pietsch, W., Trinchieri, G., Breitschwerdt, D., Ehle, M., Freyberg, M. J., Read, A. M., 2008, A&A , 489, 1029
- Bogdán & Gilfanov (2008) Bogdan Á., Gilfanov M., 2008, MNRAS , 388, 56
- Bohlin, Savage & Drake (1978) Bohlin R. C., Savage, B.D., Drake J.F., 1978, ApJ , 224, 132
- Cardelli, Clayton & Mathis (1989) Cardelli J.A., Clayton G.C., Mathis J.S., 1989, ApJ , 345, 245
- Carpano et al. (2005) Carpano S., Wilms J., Schirmer M., Kendziorra E., 2005, A&A , 443, 103
- Cervino, Mas-Hesse & Kunth (2002) Cervino M., Mas-Hesse J.M., Kunth, D., 2002, A&A , 392, 19
- Chevalier & Clegg (1985) Chevalier R. A., Clegg A. W., 1985, Nature, 317, 44
- Colbert et al. (2004) Colbert E. J. M., Heckman T. M., Ptak A. F., Strickland D. K., Weaver K. A., 2004, ApJ , 602, 231
- de Vaucouleurs et al. (1991) de Vaucouleurs G., de Vaucouleurs A., Corwin H. G., Buta R. J., Paturel G., Fouque P., 1991, Third Reference Catalogue of Bright Galaxies. Springer-Verlag, Berlin
- Davidge (1998) Davidge T. J., 1998, ApJ , 497, 650
- Dewangan et al. (2005) Dewangan G. C., Griffiths R. E., Choudhury M., Miyaji T., Schurch N. J., 2005, ApJ , 635, 198
- Dickey & Lockman (1990) Dickey J.M., Lockman F.J., 1990, ARA&A , 28, 215
- Doane et al. (2004) Doane N. E., Sanders W. T., Wilcots E. M., Juda M., 2004, AJ , 128, 2712
- Ehle et al. (1995) Ehle M., Pietsch W., Beck R., 1995, A&A , 295, 289
- Ehle et al. (1998) Ehle M., Pietsch W., Beck R., Klein U., 1998, A&A , 329, 39
- Fabbiano (1989) Fabbiano G., 1989, ARA&A , 27, 87
- Fabbiano (2006) Fabbiano G., 2006, ARA&A , 44, 323
- Feldmeier, Ciardullo & Jacoby (1997) Feldmeier J. J., Ciardullo R., Jacoby G., 1997, ApJ , 479, 231
- Freedman et al. (2001) Freedman W. L., Madore B. F., Gibson B. K. et al., 2001, ApJ , 553, 47
- Fukazawa et al. (2001) Fukazawa Y., Iyomoto N., Kubota A., Matsumoto Y., Makishima K., 2001, A&A , 374, 73
- Fraternali et al. (2002) Fraternali, F., Cappi M., Sancisi R., Osterloo T., 2002, ApJ , 578, 109
- Gil de Paz et al. (2007) Gil de Paz A., Boissier S., Madore B. F. et al., 2007, ApJS , 173, 185
- Gilfanov, Grimm & Sunyaev (2004) Gilfanov M., Grimm H.-J., Sunyaev R., 2004, MNRAS , 347, L57
- Grimes et al. (2005) Grimes J. P., Heckman T., Strickland D., Ptak A., 2005, ApJ , 628, 187
- Grimm, Gilfanov & Sunyaev (2003) Grimm H.-J., Gilfanov M., Sunyaev R., 2003, MNRAS , 339, 793
- Grimm et al. (2005) Grimm H.-J., McDowell J., Zezas A., Kim D.-W., Fabbiano G., 2005, ApJS , 161, 271
- Grimm et al. (2007) Grimm H.-J., McDowell J., Zezas A., Kim D.-W., Fabbiano G., 2007, ApJS , 173, 70
- Ho, Filippenko & Sargent (1997) Ho L. C., Filippenko A. C., Sargent W. L. W., 1997, ApJS , 112, 315
- Immler et al. (1999) Immler S., Vogler A., Ehle M., Pietsch W., 1999, A&A , 352, 415
- Kennicutt (1998) Kennicutt R.C., 1998, ARA&A , 36, 189
- Kohno et al. (1996) Kohno K., Kawabe R., Tosaki T, Okumura S. K., 1996, ApJ , 461, L29
- Kong (2003) Kong A. H. K., 2003, MNRAS , 346, 265
- Krauss et al. (2005) Krauss M. I., Kilgard R. E., Garcia M. R., Roberts T. P., Prestwich A. H., 2005, ApJ , 630, 228
- Kuntz et al. (2003) Kuntz K.D., Snowden S.L., Pence W.D., Mukai K., 2003, ApJ , 588, 264
- Leitherer & Heckman (1995) Leitherer C., Heckman, T. M., 1995, ApJS , 96, 9
- Leonard et al. (2002) Leonard D. C., Filippenko A. V., Li W., Matheson T., Kirshner R. P., Chornock R., van Dyk S. D., Berlind P., Calkins M. L., Challis P. M., Garnavich P. M., Jha S., Mahdavi A., 2002, AJ , 124, 2490
- Marston et al. (1995) Marston A. P., Elmegreen D., Elmegreen B., Forman W., Jones C., Flanagan K., 1995, ApJ , 438, 663
- Mas-Hesse, Oti-Floranes & Cervino (2008) Mas-Hesse J. M., Oti-Floranes H., Cervino M., 2008, A&A , 483, 71
- Misanovic et al. (2006) Misanovic Z., Pietsch W., Haberl F., Trinchieri G., Ehle M., Hatzidimitriou D., 2006, IAUS , 230, 162
- Munoz-Mateos et al. (2007) Munoz-Mateos J.C., Gil de Paz A., Boissier, S., Zamorano, J. Jarrett T., Gallego J., Madore B.F., 2007, ApJ , 658, 1006
- Okada, Mitsuda & Dotani (1997) Okada K., Mitsuda K., & Dotani T., 1997, PASJ , 49, 653
- Palumbo et al. (1985) Palumbo G. G. C., Fabbiano G., Trinchieri G., Fransson C., 1985, ApJ , 298, 259
- Pence et al. (2001) Pence W.D., Snowden S.L., Mukai K., Kuntz K.D., 2001, ApJ , 561, 189
- Pietsch et al. (2001) Pietsch W., Roberts T. P., Sako M. et al., 2001, å, 365, L174
- Pietsch et al. (2004) Pietsch W., Misanovic Z., Haberl F., Hatzidimitriou D., Ehle M., Trinchieri G., 2004, A&A , 426, 11
- Ranalli, Comastri & Setti (2003) Ranalli P., Comastri A., Setti G., 2003, A&A , 419, 849
- Read et al. (1997) Read A. M., Ponman T. J., Strickland D. K., 1997, MNRAS , 286, 626
- Read & Pietsch (2001) Read A. M., Pietsch W., 2001, A&A , 373, 473
- Rosa-Gonzalez et al. (2007) Rosa-Gonzalez D. et al., 2007, MNRAS , 379, 357
- Schlegel (2001) Schlegel E. M., 2001, ApJ , 556, L25
- Shostak & van der Kruit (1984) Shostak G. S., van der Kruit P. C., 1984, A&A , 132,20
- Soria & Wu (2002) Soria R., Wu K., 2002, A&A , 384, 99
- Soria & Kong (2002) Soria R., Kong A. K. H., 2002, ApJ , 572, L33
- Soria & Wu (2003) Soria R., Wu K., 2003, A&A , 410, 53
- Soria, Pian & Mazzali (2004) Soria R., Pian E., Mazzali P. A., 2004, A&A , 413, 107
- Stauffer (1982) Stauffer J. R., 1982, ApJ , 262, 66
- Strickland et al. (2000) Strickland D. K., Heckman T. M., Weaver K. A., Dahlem M., 2000, ApJ , 120, 2965
- Strickland et al. (2004a) Strickland D. K., Heckman T. M., Colbert E. J. M., Hoopes C. G., Weaver K. A., 2004a, ApJS , 151, 193
- Strickland et al. (2004b) Strickland D. K., Heckman T. M., Colbert E. J. M., Hoopes C. G., Weaver K. A., 2004b, ApJ , 606, 829
- Suchkov et al. (1994) Suchkov A. A., Balsara D. S., Heckman T. M., Leitherer C., 1994, ApJ , 430, 511
- Takahashi et al. (2004) Takahashi H., Okada Y., Kokubun M., Makishima K., 2004, ApJ , 615, 242
- Talbot, Jensen & Dufour (1979) Talbot R. J., Jensen E. B., Dufour R. J., 1979, ApJ , 229, 91
- Tennant et al. (2001) Tennant A.F., Wu K., Ghosh K.K., Kolodziejczak J.J., Swartz D.A., 2001, ApJ , 549, L43
- Terashima et al. (1998) Terashima Y., Ptak A., Fujimoto R., Itah M., Kunieda H., Makashima K., Serlemitsos P. J., 1998, ApJ , 496, 210
- Terashima & Wilson (2004) Terashima Y., Wilson A. S., 2004, ApJ , 601, 735
- Thim et al. (2003) Thim F., Tammann G. A., Saha A., Dolphin A., Sandage A., Tolstoy E., Labhardt L., 2003, ApJ , 590, 256
- Trinchieri et al. (1984) Trinchieri G., Fabbiano G., Paulumbo G. G. C., 1984, ApJ , 290, 96
- Trudolyubov et al. (2005) Trudolyubov S., Kotov O., Priedhorsky W., Cordova F., Mason K., 2005, ApJ , 634, 314
- Tully (1974) Tully R. B., 1974, ApJS , 24, 449
- Tyler et al. (2004) Tyler K., Quillen A. C., LaPage A., Rieke G. H., 2004, ApJ , 610, 213
- Vogler et al. (2005) Vogler A., Madden S. C., Beck R., Lundgren A. A., Sauvage M., Vigroux L., Ehle M., 2005, A&A , 441, 491
- Warwick et al. (2007) Warwick R. S., Jenkins L. P., Read A. M., Roberts T. P., Owen R. A., 2007, MNRAS , 376, 1611
- Watson et al. (1984) Watson M. G., Stanger V., Griffiths R. E., 1984, ApJ, 286, 144
- Watson et al. (2008) Watson M. G. et al., 2008, arXiv, 0807.1067
- Yang et al. (2007) Yang Y., Li B., Wilson A.S., Reynolds C.S., 2007, ApJ , 660, 1106