A model for the Z-track phenomenon, jet formation and the kilohertz QPO based on Rossi-XTE observations of the Z-track sources
Abstract:
We present a new model for the Z-track phenomenon, based on analysis of the spectral evolution around the Z-track in several Z-track sources, in which radiation pressure plays a major role. Increasing mass accretion rate on the normal branch causes heating of the neutron star with the emissive flux from the surface increasing by an order of magnitude to become super-Eddington at the horizontal branch where radio detection shows the presence of jets. We propose that the radiation pressure disrupts the inner disk leading to the launching of the jets. Secondly, by timing analysis of the same data we find a correlation of the frequency of kHz QPO with the emissive flux and propose that the higher frequency QPO is an oscillation at the inner disk edge which progressively moves to larger radial positions as the disk is disrupted by radiation pressure.
September 1-5 2008
Foca, Izmir, Turkey
1 Introduction
The Z-track sources form the brightest group of Low Mass X-ray Binaries (LMXB) containing a neutron star, with luminosities at or above the Eddington Limit. They are characterised by having three distinct branches in a hardness-intensity diagram: the horizontal branch (HB), the normal branch (NB) and the flaring branch (FB) (Hasinger & van der Klis 1989) showing that major physical changes take place within the sources but the nature of these has not been understood. It has been widely thought that the physical and spectral changes are driven by variation of a single parameter along the Z-track, presumably the mass accretion rate (Priedhorsky et al. 1986), assumed to increase monotonically in the direction HB - NB - FB. However, the evidence for this is rather limited based mostly on the assumed identification of increased UV emission in a multi-wavelength campaign on Cyg X-2 with the flaring branch (Vrtilek et al. 1990) which has since been questioned (Church et al. 2006). Moreover the variation of the X-ray intensity does not obviously support this as the intensity does not increase monotonically in the direction HB - NB - FB, but decreases on the normal branch. Arguably the most important feature of the Z-track sources is the detection of radio emission showing jets to be present but essentially only in the upper normal and horizontal branches (e.g. Berendsen et al. 2000). The presence of jets was dramatically demonstrated by extended radio observations of the Z-track source Sco X-1 (Fomalont et al. 2001) which revealed radio condensations moving away from the source with velocity of 0.45. Thus the Z-track sources uniquely provide the possibility of determining the physical conditions within the sources on the part of the Z-track where radio is detected so telling us the conditions needed for the launching of jets. Apart from this, an understanding of the Z-track sources is essential to the basic understanding of LMXB in general. Extensive work has been carried out on the timing properties of Z-track sources (van der Klis et al. 1987; Hasinger & van der Klis, 1989) and revealed the existence of quasi-periodic oscillations (QPO) which change along the Z-track. However, analysis of the timing properties has not provided an explanation of the Z-track phenomenon. Spectral analysis is more likely to reveal the nature of the physical changes taking place as directly showing changes in the emission components during the spectral evolution along the Z-track, but spectral studies of the sources have been hindered by lack of agreement over the emission model to be used.

The spectra of LMXB clearly consisting of a power law Comptonized component plus a thermal blackbody can be interpreted using two very different physical models (Fig. 1). In the “Eastern” model (Mitsuda et al. 1989), the thermal emission is multi-colour disk blackbody and the non-thermal

component is Comptonized emission from a small central region: the neutron star atmosphere or the inner disk. In the “Extended ADC” model (Church & Bałucińska-Church 2004), the neutron star is the source of blackbody emission and an extended accretion disk corona produces the Comptonized emission. The dipping class of LMXB provide strong evidence for the very extended nature of the ADC since dip ingress timing as illustrated in Fig. 2 allows determination of the radial extent of the ADC , using the dip ingress time t, the orbital period and the accretion disk radius via
By applying this technique to most of the dipping LMXB, it was found that the ADC was indeed very large, typically 50 000 km in radial extent, i.e. 15% of the accretion disk size, and varying linearly with source luminosity between 20 000 and 700 000 km (Church & Bałucińska-Church 2004). This shows that the accretion disk corona is as shown schematically in Fig. 2, i.e. an extended, thin ADC (having 1) above the accretion disk.
Strong independent support comes from Chandra grating results for Cygnus X-2 (Schulz et al. 2008) in which broad emission lines of highly ionized species were located at radial distances of 20 000 - 110 000 km in an extended ADC. Theses results rule out the Comptonizing region being a small central region, and so the Eastern model.
The majority of spectral fitting of the Z-track sources has employed the Eastern model: e.g. Done et al. (2002), Agrawal & Sreekumar (2003), di Salvo et al. (2002). However, it proved difficult to interpret the results, and no concensus view of the nature of the Z-track emerged. We have applied the Extended ADC model to several of the Z-track sources as described below, and have found that the spectral fitting results clearly suggest a model for the Z-track phenomenon, for jet launching and for the nature of the kHz QPO.


We firstly present results of analysis of high quality RXTE observation of the Z-track source GX 340+0 (Church et al. 2006). Spectral fitting was carried out using a model abs (bb + cut), i.e. a blackbody and a cut-off power law to represent Comptonization in an extended ADC, for which the seed photons are the disk blackbody emission (see Church & Bałucińska-Church 2004), with absorption, and this was done at a sequence of positions around the Z-track. Results for the blackbody temperature and blackbody radius are shown in Fig. 4 (left). It can be seen that at the soft apex between NB and FB, is smallest while 10.5 km indicates that the whole star is emitting. We propose that at this position, the mass accretion rate is minimum. Ascending the NB towards the hard apex, increases while the blackbody radius falls.
Fig. 4 (right) shows the 1- 30 keV luminosities of the blackbody and Comptonized ADC emission (). There is a large increase of moving from the soft apex to the hard apex, corresponding to the large increase in X-ray intensity. We suggest that this is strong evidence that is increasing contrary to the standard view that increases around the Z-track in the direction HB - NB - FB.
2 Spectral analysis of GX 340+0, GX 5-1 and Cygnus X-2
2.1 High radiation pressure and jet formation


We find that all of the three Cygnus X-2 like sources: Cygnus X-2, GX 340+0 and GX 5-1 behave in the same way as seen in Fig. 5 (left), with the neutron star blackbody temperature increasing on the normal branch. Similarly all three sources appear to emit over the whole surface of the neutron star at the soft apex, and based on that assumption, we have a measurement of the radius of the neutron star with a mean of of 11.40.6 km at 90% confidence for the three sources. The increase of and decrease of emitting area on the neutron star seen in moving away from the soft apex towards the hard apex means that the radiation pressure of the neutron star emission increases substantially.
Fig. 5 (right) shows the variation around the Z-track of the ratio of the flux emitted per unit surface area of the neutron star to the Eddington flux , where is the radius of the neutron star. This shows in all cases that the sources are emitting at only 20% of the Eddington flux at the soft apex, that the emitted flux increases to the Eddington value at the hard apex, and becomes strongly super-Eddington on the horizontal branch.
We have thus proposed (Church et al. 2006, 2008) that the strong radiation pressure causes disruption of the inner accretion disk. The inner disk in these sources has a height of the order of 50 km because the disk is inflated by its own radiation pressure. In this geometry, the increasing radiation pressure of the neutron star will exert a force horizontally in to the disk, but will also have a component close to vertical, i.e. acting on material up to 50 km above the disk. Hydrostatic equilibrium will be destroyed and the accretion flow diverted vertically upwards so launching the jet. The detection of radio emission from the jet correlates very well with the positions on the Z-track where the neutron star emission becomes super-Eddington. It has, of course, previously been suggested that radiation pressure be important in jet formation (Begelman & Rees 1984), and Lynden-Bell (1978) proposed that a radiatively-supported inner disk would define conical funnels above and below the disk within which jets may be formed.
The decrease in blackbody radius would be expected from previous results. Our results in an ASCA survey of LMXB (Church & Bałucińska-Church 2001) showed that the neutron star emitting area in all types of source covering a wide range of luminosities depended on the luminosity of the source, i.e. the mass accretion rate . This could be viewed geometrically in that the height of the emitter on the neutron star was found to agree well with the height of the inner disk . It was later shown that this behaviour would be expected from the theory of Inogamov & Sunyaev (1999) in which the accretion flow adapts to the rotation of the neutron star in a boundary layer on the star (Church et al. 2002). In the present situation where the accretion flow is partly diverted away from the neutron star and the inner disk height very much reduced, the contraction of the emitting region from the full neutron star to an emitting band at the equator of height 10 km would thus be expected.
2.2 The nature of the flaring branch

![[Uncaptioned image]](0811.2680v1/mdot.png)
The spectral fitting results also provide an explanation of the flaring branch in the Z-track sources. From Fig. 4 (right) it can be seen that in flaring, does not increase suggesting that there is no change in ; the blackbody luminosity, however, increases leading to the overall increase of luminosity in flaring. In Fig. 6 we compare the onset of flaring with the theory of unstable burning of the accumulated accretion flow on the surface of the neutron star (Fushiki & Lamb 1987; Bildsten 1998; Schatz et al. 1999). There are four régimes of nuclear burning demarcated by the value of : the mass accretion rate per unit area of the neutron star, and in particular, there is a critical value of which divides régimes 3 and 4 between unstable burning of He in a mixed H/He atmosphere and stable burning (Fig. 6 left). In Fig. 6 (right) we show the measured obtained from the mass accretion rate divided by the emitting area , also showing the critical value as the dashed horizontal line with 30% uncertainties from the theory. There is good agreement of at the soft apex suggesting that as the sources approach this apex along the NB, the surface burning becomes unstable and increases by the energy release, which is seen as flaring in the lightcurve.

We thus propose the model of the Z-track sources and of jet formation summarised in Fig. 7 The quiescent source is shown at the top, with a radiatively-supported thick accretion disk around a neutron star emitting from its full surface, and with minimum . In flaring, is constant, but the neutron star emission increases by unstable burning, and the blackbody radius may increase to 15 - 18 km suggesting burning expands beyond the surface of the neutron star as seen in radius-expansion bursts. Such an increase was also seen in GX 5-1 by Christian & Swank (1997). Finally, on the NB and HB, increases leading to increased blackbody temperature and radiation pressure that removes the inner disk and diverts the accretion flow into the vertical direction.
3 A model for the upper frequency kHz QPO
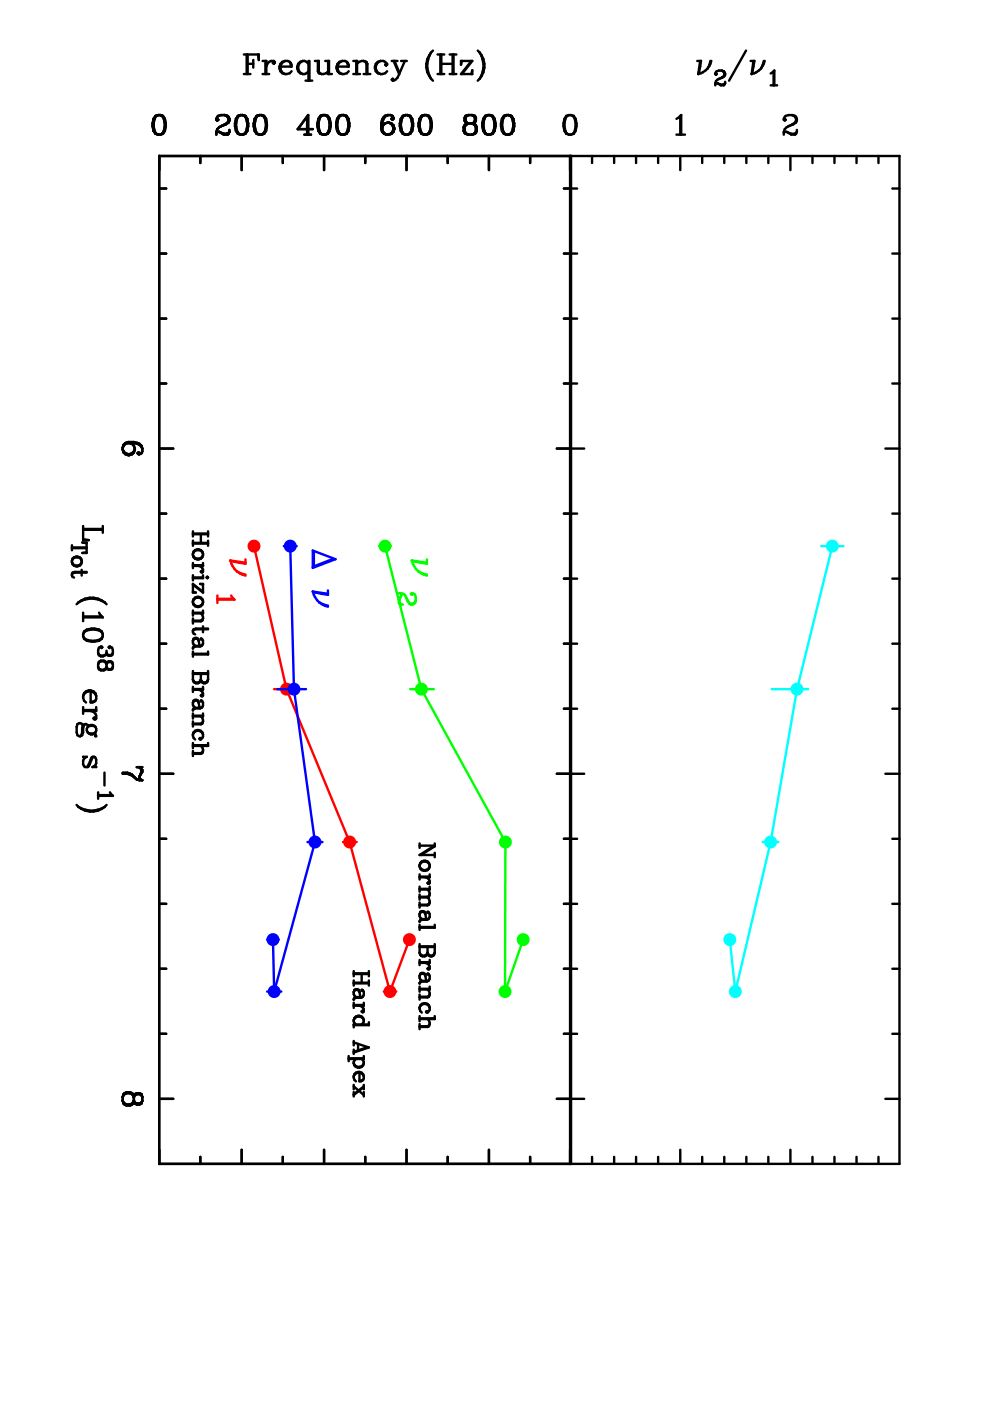

The above model for the Z-track phenomenon has also led to an interesting result relevant to the kHz QPO, the nature of which remain unexplained, although it is widely realized that the upper frequency QPO is likely to relate to orbital motion some way into the inner accretion disk. We have carried out timing analysis for the same selections of data as used in the above spectral analysis and now present results in the case of GX 5-1. We used the technique of converting the power spectra into Xspec format so as to be able to use the associated powerful spectral fitting software. Fig. 8 (left) shows the results in a conventional form, firstly as the QPO frequencies and as a function of 1- 30 keV luminosity and also as the difference - and the ratio . The kHz QPOs are seen essentially only on the horizontal branch as is well known.
We also show the results in an unconventional way by plotting the Keplerian radius of each QPO as a function of , the parameter we have previously used as a measure of radiation pressure in the proximity of the neutron star (Fig. 8 right), noting that this quantity is measured from spectral fitting results, not deduced or interpreted. During movement along the Z-track from the end towards the hard apex, the upper frequency QPO increases in frequency and so its Keplerian radius decreases, from 25 to 18 km. The striking result is that the variation in frequency as a function of is initially small when the source is sub-Eddington, but changes rapidly when is greater than .
There is a clear implication that the oscillation comprising the upper frequency QPO at is always at the inner edge of the disk, and that the radius of this edge increases with increasing radiation pressure. Thus the change in QPO frequency is fundamentally driven by change of the mass accretion rate in the same way that it is thought that change of causes the major physical changes between the Z-track branches, although it is not agreed in which direction increases. Sideways movement of the whole Z-track between observations is known, forming the so-called “parallel tracks”, which are not well-understood. However, the suggestion that spectral and timing parameters may not therefore be a simple function of is neither accepted nor proven and thus the existence of parallel tracks clearly does not mean that the changes in QPO frequency are not caused by changing .
The lower frequency QPO corresponds to Keplerian motion at radial positions of 22 - 45 km has a variation that follows the form of the higher frequency QPO. The implication from Fig. 8 (right) is that this frequency clearly depends on the value of although the mechanism is not clear. The resonance model (Abramowicz & Kluźniak 2001; Kluźniak et al. 2007) or the relativistic model of Stella & Vietri (1998) are possible; however, the present data do not support the sonic point model (Miller & Lamb 1998) because this model requires formation of a sonic point in the disk by radiation drag forces, whereas we propose that the disk is disrupted by radially-outwards radiation pressure, not at a sonic point. Moreover, our model does not need the existence of a sonic point, an Alfvén radius or an innermost stable orbit to define the inner radius of the accretion disk.
4 Conclusions
Based on extensive analysis of high quality data of the Cygnus X-2 like Z-track sources we have proposed a model for the Z-track phenomenon which explains the launching of jets at the particular part of the Z-track on which the radio jets are strongest. In this model, increases from the soft apex to the hard apex, i.e. in the opposite direction to that assumed by many workers as the standard model, although it should be noted that the evidence for changing in that direction was never strong. Substantial support for the model comes from the detected increase in column density in spectral fitting on the NB moving towards the hard apex in all three sources (Church et al. 2006, 2008), since this increase has to be intrinsic and supports the disruption of the inner disk. On the flaring branch we show that the results agree very well with the theory of unstable nuclear burning. Finally, we propose that the upper frequency kHz QPO is an oscillation that always takes place at the inner disk edge, the radial position of this varying along the Z-track as the inner disk is disrupted by radiation pressure. Thus as shown on Fig. 7 (lower) the disrupted disk is essentially cusp-like, and the oscillation takes place at this cusp which forms a natural site for such an oscillation.
Acknowledgments.
This work was supported by the Polish Ministry of Higher Education and Science grant no. 3946/B/H03/2008/34 and by PPARC grant PPA/G/S/2001/00052.References
- [1] M. A. Abramowicz & W. Kluźniak, 2001, A&A, 374, L19
- [2] V. K. Agrawal & P. Sreekumar, 2003, MNRAS, 346, 933
- [3] M. C. Begelman & M. J. Rees, 1984, MNRAS, 206, 209
- [4] S. G. H. Berendsen, R. Fender, E. Kuulkers, J. Heise & M. van der Klis, 2000, MNRAS, 318, 599
- [5] L. Bildsten, 1998, in Proc NATO ASIC 515, “The Many Faces of Neutron Stars”, eds. R. Buccheri, J. van Paradijs & M. A. Alpar, Dordrecht-Kluwer, 419
- [6] D. J. Christian & J. H. Swank, 1997, ApJSupp, 109, 177
- [7] M. J. Church & M. Bałucińska-Church, 2001, A&A, 369, 915
- [8] M. J. Church & M. Bałucińska-Church, 2004, MNRAS, 348, 955
- [9] M. J. Church, N. A. Inogamov & M. Bałucińska-Church, 2002, A&A, 390, 139
- [10] M. J. Church, G. S. Halai & M. Bałucińska-Church, 2006, A&A, 460, 233
- [11] M. J. Church, M. Bałucińska-Church & N. K. Jackson, 2008, Chin J A&A, 8, 191
- [12] T. di Salvo, R. Farinelli, L. Burderi, L., et al., 2002, A&A, 386, 535
- [13] C. Done, P. Życki & D. A. Smith, 2002, MNRAS, 331, 453
- [14] E. B. Fomalont, B. J. Geldzahler & C. F. Bradshaw, 2001, ApJ, 558, 283
- [15] I. Fushiki & D. Q. Lamb, 1987, ApJ, 323, L55
- [16] G. Hasinger & M. van der Klis, 1989, A&A, 225, 79
- [17] N. A. Inogamov & R. A. Sunyaev, 1999, AstL, 25, 269
- [18] W. Kluźniak & M. A. Abramowicz, M. Bursa, & G. Török, 2007, RevMexAA. 27, 18
- [19] D. Lynden-Bell, 1978, Phys Scripta 17, 185
- [20] M. C. Miller, F. K. Lamb & D. Psaltis, 1998, ApJ, 508, 791
- [21] K. Mitsuda, H. Inoue, H., N. Nakamura & Y. Tanaka, 1989, PASJ, 41, 97
- [22] W. Priedhorsky, G. Hasinger, W. H. G. Lewin, et al., 1986, ApJ, 306, L91
- [23] H. Schatz, L. Bildsten, A. Cumming & M. Wiescher, 1999, ApJ, 524, 1014
- [24] N. S. Schulz, , D. P. Huenemoerder, L. Ji, M. Nowak, Y. Yao & C. R. Canizares, 2008, ApJ Lett, in Press:
- [25] L. Stella & M. Vietri, 1998, ApJ, 492, L59
- [26] M. van der Klis, L. Stella, N. E. White, F. Jansen & A. N. Parmar, 1987, ApJ, 316, 411
- [27] S. D. Vrtilek, J. C. Raymond, M. R. Garcia, et al., 1990, A&A, 235, 162