Arecibo Pulsar Survey Using ALFA: Probing Radio Pulsar Intermittency and Transients
Abstract
We present radio transient search algorithms, results, and statistics from the ongoing Arecibo Pulsar ALFA (PALFA) survey of the Galactic plane. We have discovered seven objects through a search for isolated dispersed pulses. All of these objects are Galactic and have measured periods between 0.4 and 4.7 s. One of the new discoveries has a duty cycle of 0.01%, smaller than that of any other radio pulsar. We discuss the impact of selection effects on the detectability and classification of intermittent sources, and compare the efficiencies of periodicity and single-pulse searches for various pulsar classes. For some cases we find that the apparent intermittency is likely to be caused by off-axis detection or a short time window that selects only a few bright pulses and favors detection with our single-pulse algorithm. In other cases, the intermittency appears to be intrinsic to the source. No transients were found with dispersion measures large enough to require that they originate from sources outside our Galaxy. Accounting for the on-axis gain of the ALFA system, as well as the low gain but large solid-angle coverage of far-out sidelobes, we use the results of the survey so far to place limits on the amplitudes and event rates of transients of arbitary origin.
I. Introduction
Radio pulsars show a wide variety of modulations of their pulse amplitudes, including bursts and nulls, that affect their detectability in surveys. Phenomena seen in some pulsars include short-period nulling, in which a pulsar is not detected for several pulse periods, only to reappear with full strength (Backer 1); eclipses, in which a companion star or its wind or magnetosphere absorbs or disperses the pulsar signal (Fruchter et al. 16,Stappers et al. 49,Lyne et al. 33,Kaspi et al. 25); long-term nulling or intermittent behavior, in which a pulsar is quiescent for days or weeks (Kramer et al. 29); and rotating radio transients (RRATs, McLaughlin et al. 37), pulsar-like objects from which only occasional radio bursts are detected. This paper describes analysis of a large-scale survey using the Arecibo telescope that is sensitive to both periodic and aperiodic signals.
RRATs were first discovered in archive Parkes Multibeam survey data (McLaughlin et al. 37). Eleven objects, with periods ranging from 0.7 to 7 s and pulse widths of ms, were found using a single pulse search algorithm (McLaughlin 39). The longer periods of RRATs compared with the general pulsar population suggest similarities with the X-ray populations of X-ray dim isolated neutron stars (XDINSs) and magnetars. RRAT J18191458 has been detected at X-ray energies (McLaughlin et al. 38) with properties that are similar to those of XDINSs and high magnetic field radio pulsars.
A different type of pulse modulation is observed in the case of pulsars emitting giant pulses. Such pulses are tens to thousands of times brighter and an order of magnitude or more narrower than the average pulse (see Knight 28 for an overview). Giant pulses from the Crab pulsar have substructure on timescales of 2 ns (Hankins et al. 18), and PSR B1937+21 emits giant pulses as narrow as 16 ns (Popov et al. 43). Giant micro-pulses from the Vela pulsar have widths s (Johnston et al. 24), and the slowly rotating pulsars PSR B1112+50, PSR B003107, and PSR J1752+2359 occasionally emit bright pulses which are ms wide, times narrower than the average pulse (Knight 28). The detection of giant pulses is a potentially powerful method for finding extragalactic pulsars too distant for their normal emission to be detectable by periodicity searches (McLaughlin & Cordes 36).
A variety of energetic phenomena other than pulsar emission can give rise to fast transients potentially detectable in radio pulsar surveys. Within the Solar System, transient radio events may be generated by energetic particles impacting the Earth’s atmosphere, solar flares, and decameter radio flares originating in Jupiter’s atmosphere. Analogously to the latter, extrasolar planets with strong magnetic fields are expected to be detectable in the 10-1000 MHz range (Farrell et al. 14, Lazio et al. 30, Zarka et al. 53). Magnetic activity on the surfaces of brown dwarfs and particle acceleration in the magnetic fields of flare stars are also known radio flare progenitors (Berger et al. 3, Berger 2, Garc´ia-S´anchez et al. 17, Jackson et al. 22). Gamma-ray bursts are predicted to have detectable radio emission at MHz (Usov & Katz 50, Sagiv & Waxman 47), and radio flares have been observed from some X-ray binaries (Waltman et al. 51, Fender et al. 15). Among the most energetic and exotic events in the Universe, supernovae, merging neutron stars and coalescing black holes may produce wide-band radio bursts detectable at extragalactic distances (Hansen & Lyutikov 19).
In this paper we describe an ongoing survey for pulsars and transient radio sources with the Arecibo telescope. The survey addresses outstanding questions about the nature and emission mechanisms of intermittent radio sources. In § II we present the PALFA survey parameters, and in § III we describe the single pulse search and radio frequency interference excision algorithms which are part of the survey data processing pipeline. Section IV contrasts PALFA detection statistics on known pulsars and new discoveries, and § V examines selection effects influencing the detection and classification of transient sources. In § VI, we apply an intermittency measure method for comparing the efficiency of periodicity and single pulse pulsar searches. In § VII, we discuss the properties of individual intermittent objects discovered by PALFA. In § VIII and § IX, we apply constraints derived from the survey sensitivity and results to the detectability of various energetic phenomena expected to emit radio bursts. Finally, in § X, we present our main conclusions.
II. PALFA Survey Observations
II.1. Survey Parameters
The PALFA survey started in 2004, shortly after the installation of the seven-beam ALFA receiver on the Arecibo telescope. The survey searches for pulsars and transients in the inner and outer Galactic plane regions accessible to Arecibo (see below).
The ALFA receiver is well-suited for survey observations, allowing simultaneous data collection from seven fields, each (FWHM) across. Taking into account the hexagonal arrangement of the beams on the sky and the near sidelobes, the combined power-pattern is approximately (Cordes et al. 7). We observe a 100 MHz passband centered on 1440 MHz in each of the seven telescope beams. Wideband Arecibo Pulsar Processors (WAPPs; Dowd et al. 13) are used to synthesize 256-channel filterbanks spanning these bands at intervals of 64 s. During observations, full-resolution data are recorded to disk and, in parallel, decimated down to a time resolution of 1 ms and searched for periodic signals and single pulses by a quick-look processing pipeline running in real time at the Arecibo Observatory (Cordes et al. 7). This approach allows for immediate discovery of relatively bright pulsars with periods longer than a few milliseconds. Searching full-resolution data allows detection of millisecond pulsars and narrower single pulses and is done offline at participating PALFA institutions as the processing is much more computationally intensive.
Table 1 lists various ALFA system and survey parameters, including the sky area corresponding to processed and inspected data reported on in the present paper and the total sky area observed to date (see Cordes et al. 7 for a detailed explanation of other parameters). Standard observation times are 268 s for inner Galaxy pointings () and 134 s for outer Galaxy pointings (). Some early observations had a duration of 134 s and 67 s for inner and outer Galaxy pointings, respectively. The quoted system temperature of 30 K is measured looking out of the Galactic plane. The initial threshold of for the single pulse search is used when selecting events from dedispersed time series based on their signal-to-noise ratios only, before any filtering is applied. While there are a significant number of events due to random noise above this threshold, identification of an event as a genuine pulse takes into account not only its signal-to-noise ratio but also the fact that it is detected at a contiguous range of trial dispersion measures, which is in general not true of spurious events. Thus weak pulses can be correctly identified, while they would be excluded if the threshold was set according to Gaussian noise statistics.
| Parameter | Value |
|---|---|
| Center frequency (GHz) | 1.440 |
| Total bandwidth (MHz) | 100 |
| Channel Bandwidth (MHz) | 0.39 |
| Sampling time (s) | 64 |
| Nominal system temperature (K) | 30 |
| Gain (K/Jy) | |
| Center pixel | 10.4 |
| Ring pixels | 8.2 |
| Beam width (’) | |
| Main beam (1 pixel) | 3.5 |
| Main beam plus near sidelobes (1 pixel) | 18 |
| Main beam plus near sidelobes (7 pixels) | |
| Inner Galaxy | |
| Observation time per pointing (s) | 268, 134 |
| Observed (deg2) | 156 |
| ProcessedaaFull-resolution data processed with the Cornell pulsar search code. (deg2) | 99 |
| Anticenter | |
| Observation time per pointing (s) | 134, 67 |
| Observed (deg2) | 119 |
| ProcessedaaFull-resolution data processed with the Cornell pulsar search code. (deg2) | 87 |
| Detection threshold () | |
| Single pulse search (initial threshold) | 5 |
| Fourier Transform periodicity search | 7.5 |
II.2. Survey Sensitivity
Here we compute the maximum distance at which sources of a given luminosity are be detectable by the PALFA survey, . We then compare the sensitivity of the PALFA survey to previous work done with the Parkes Multibeam system (Manchester et al. 34, McLaughlin et al. 37).
The rms noise in a radio transient search, where the effective observation time is equal to the pulse width, is
| (1) |
where is the system-equivalent flux density, is the number of polarization channels summed and is the bandwidth. A pulse’s observed width may be broadened compared to its intrinsic width by several effects. After dedispersing the raw data and obtaining a dedispersed time series, there is residual dispersive broadening due to the finite width of a frequency channel and the error of the trial dispersion measure (DM) used compared to the actual pulsar DM. Scatter broadening is not correctable and will have a contribution that depends on observing frequency and varies with direction on the sky. In general,
| (2) |
where is the dispersive broadening across a frequency channel of width (MHz) for an observing frequency (GHz), is the dispersive broadening due to the difference between the trial and actual DM of the source, and is the scattering broadening. Broadening conserves pulse area, so that the intrinsic and observed peak flux densities are related through . If is the detection threshold, the minimum detectable intrinsic peak flux density is
| (3) |
For a one steradian pulsar radio beam, a source of intrinsic peak luminosity can be detected out to a maximum distance of
| (4) |
For a steadily emitting pulsar with period-averaged luminosity and duty cycle , we have .
The amount of pulse broadening depends on system parameters as well as dispersion and scattering, which vary with direction on the sky so that . We use the NE2001 model of Galactic ionized electron density (Cordes & Lazio 10) to calculate representative results for in the direction , a region of overlap between PALFA and the Parkes Multibeam survey. Fig. 1 shows vs. detection curves using a threshold for both surveys. For lower luminosities, sources are not visible to large enough distances for scattering to affect detectability and the inverse square law dominates the detection curve so that . For larger distances and smaller intrinsic pulse widths, scattering and (residual) dispersion smearing make pulses increasingly harder to detect and increases more slowly with .

III. Single Pulse Search Methods
This section describes processing methods employed by the Cornell pulsar search pipeline11 1 http://arecibo.tc.cornell.edu/PALFA/ at the Cornell Center for Advanced Computing and the Swinburne University of Technology. The PRESTO search code 22 2 http://www.cv.nrao.edu/sransom/presto is run independently at West Virginia University, University of British Columbia, McGill University and the University of Texas at Brownsville. PRESTO uses a similar matched filtering algorithm to the one described below, but a different RFI excision scheme and trial DM list.
We dedisperse raw data with 1272 trial DMs in the range pc cm-3. In order to find individual pulses from intermittent sources we operate on dedispersed time series with two time domain algorithms: matched filtering, which has been the standard in single pulse searching so far, and a friends-of-friends algorithm. After single pulse candidates have been identified we use a stacking method in the time-frequency plane to verify that the pulses are dispersed and the sweep observed across frequencies follows the dispersion relation, as expected for non-terrestrial sources. Certain types of terrestrial signals, e.g. swept-frequency radars, have pulses whose appearance in the time-frequency plane may approximate dispersion by ionized gas, but on closer inspection such pulses generally deviate significantly from the cold plasma dispersion relation.
III.1. Matched Filtering
Matched filtering detection of broadened pulses relies on the convolution of a pulse template with the dedispersed time series. Ideally, a pulse template would consist of one or several superimposed Gaussian templates, reflecting the diversity of pulsar pulse profiles, some of which exhibit multiple peaks. In addition, multipath propagation due to scattering adds an exponential tail to the pulse profile. We approximate true matched filtering by smoothing the time series by adding up to neighboring samples, where , and selecting events above a threshold after each smoothing iteration. The smoothing is done in pairs of samples at each -stage, so that the resulting template is a boxcar of length samples (Cordes & McLaughlin 11). The sampling time used in PALFA observations is 64 s and therefore our matched filtering search is most sensitive to pulse widths of 64 s to 8.2 ms. This search strategy is not optimal for single pulses from heavily scattered pulsars because the templates are symmetric, while the scattered pulse shape with an exponential tail is not, and significantly scattered pulses can be wider than ms.
III.2. Finding Time-Domain Clusters
Two issues make a complement to matched filtering necessary. The pulse templates described above have discrete widths of samples by algorithm design and there is decreased sensitivity to pulses with widths that are significantly different. In addition, the matched filter search output may be dominated by bright, wide pulses from radio frequency interference (RFI). In that case, a single RFI burst is detected as an overwhelming number of individual events instead of a single event. The cluster algorithm is similar to the friends-of-friends search algorithm used to find galaxies in optical images (Huchra & Geller 21), and complements matched filtering by not restricting the width of expected pulse detections. The dedispersed time series is processed sequentially. Each event above a threshold which is found is designated as the first of a cluster. A cluster of events is augmented by broadening it to include any adjacent samples above a threshold. Gaps of samples are allowed within a cluster, and PALFA data is processed with . The brightest sample of a cluster is recorded as the event amplitude, and the total number of samples in the cluster as its width. This approach is less sensitive to weak, narrow pulses but results in significantly fewer spurious events due to RFI.
A limiting factor for the largest pulse width detectable by both the matched filtering and friends-of-friends search algorithms is the fact that data are analysed in blocks much shorter than the complete time series length. The mean and standard deviation of a block are used for thresholding events found within the block. This approach minimizes the effect of baseline variations with time scales much longer than typical pulsar pulse widths of a few to a few tens of ms. The disadvantage is that only pulses with can be detected. In processing PALFA data, we use blocks of length s s. According to the NE2001 model of ionized gas in the Galaxy (Cordes & Lazio 10), a scattering broadening time of that magnitude in the inner-Galaxy part of the PALFA survey corresponds to pc cm-3 and a maximum search distance well outside of the Milky Way for most directions we survey. However, lines of sight intersecting HII regions can result in large dispersion measures and scattering times and are therefore selected against. Any intergalactic scattering that broadens pulses beyond about 0.1 s will also cause events to be selected against.
III.3. Example Results
Fig. 2 shows standard single pulse search output for the discovery observation of PSR J0627+16 (§ 8.1). The main panel shows signal-to-noise ratio (S/N) vs. DM and time for events with . The panels on top illustrate event statistics for the observation: from left to right, number of events vs. S/N and DM, and DM vs. S/N. The pulsar detection is manifested as a peak in the histogram of number of events vs. DM. There is a corresponding peak in the DM vs. S/N plot, since the several detected pulses are significantly brighter than background noise in the dedispersed time series.

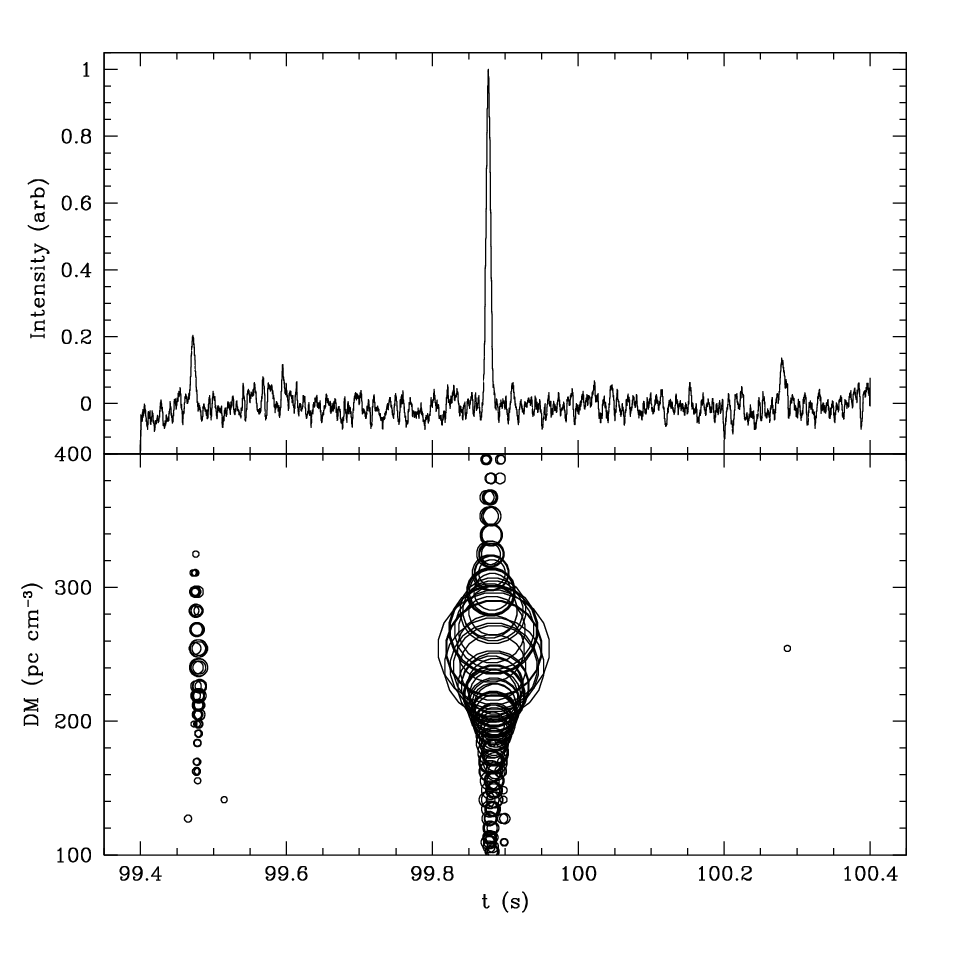
Fig. 3 shows events in DM-time space for another PALFA single pulse discovery, PSR J1928+15 (§ 8.5). In this case, three closely spaced bursts were found at s, pc cm-3. The pulsar is detected at a range of DMs, with the signal to noise ratio increasing as trial DM values approach the actual pulsar DM and decreasing as trial DMs further on recede from the pulsar DM. In contrast, events due to interference from terrestrial signals at s span the entire range of trial DMs and their signal to noise ratios do not show a significant variation with DM.

If an excess of candidate pulses is identified in the dedispersed time series for a particular trial DM, we use the expected dispersion sweep across the frequency band in order to test if the pulses are from non-terrestrial origin. For a pulse with in the time series, we extract a chunk of raw data centered on its time of arrival and look for a sweep across frequency that follows the dispersion relation (Fig. 4 a, b).

III.4. Time-Frequency Plane Stacking
In the case of multiple weaker pulses detected in the same beam, we extract a raw data chunk centered on the arrival time of each pulse, stack the chunks and look for a dispersion sweep in the resulting cumulative dynamic spectrum (Fig. 4 c, d).
Stacking can induce spurious dispersion sweeps in the time-frequency plane even when the data consist of only Gaussian-distributed noise. Single pulse events identified in dedispersed time series by definition correspond to sums over a given dispersion path that are above average. When these are used to select chunks for summing, the statistical fluctuations will build up to show a dispersed pulse in the time-frequency plane that follows the cold-plasma dispersion law perfectly. We simulated this effect by generating a time-frequency plane of Gaussian noise, dedispersing it, and selecting events above threshold from the resulting time series. We extracted chunks from the fake time-frequency plane centered on each event and stacked them, thus reproducing the procedure used on real data.
Selecting events with signal-to-noise above a threshold in the dedispersed time series yields a biased set of noise-only samples in the time-frequency plane. On the other hand, when stacking dynamic spectra, points in the stacked dynamic spectrum must have a minimum signal-to-noise for a dispersion sweep to be discernible by eye. The rms noise in the dedispersed time series after summing channels is a factor of larger than the rms noise in the time-frequency plane. The rms noise in the stacked dynamic spectrum after stacking chunks is a factor of larger than the rms noise in the time-frequency plane. We calculate the average deviation from the mean in the time-frequency plane implied by the two thresholds and , equate them, and obtain
| (5) |
For the PALFA survey and our processing pipeline, and . Therefore if data chunks are added there will be a spurious, dispersed pulse in the resulting stacked dynamic spectrum even if the chunks contain only noise. Since the noise decorrelates over samples, the pulse will have a width on the order of s. To avoid the induced spurious-event effect, the width and S/N of stacked dynamic spectra should be compared with those that would result from noise only. All of our detections that use stacking satisfy the criteria s and . Typically we sum chunks centered on the brightest pulses for a single pulse candidate, which is safely below the limit. In the case of PSR J1909+06 (Fig. 4d) only 2 chunks were added and the dispersed swath in the time-frequency plane is 1 ms wide.
III.5. RFI Excision
The RFI environment at the Arecibo telescope and the 7-beam configuration of the ALFA receiver present both challenges and opportunities for RFI mitigation to facilitate searching for single pulses. PALFA survey data are dedispersed with trial dispersion measures of pc cm-3. RFI pulse intensity typically peaks at pc cm-3, and incidental low-intensity pulses whose S/N peaks at DM = 0 pc cm-3 tend to be smeared below the detection threshold for dedispersed time series with trial pc cm-3. A more complex signature is observed for Federal Aviation Administration (San Juan airport) radar pulses, which are unfortunately common in Arecibo observations. The radar rotation period is s, and each pulse has an envelope that is s wide and consists of sub-pulses with variable period on the order of ms. Depending on telescope orientation, radar pulses may be detected in all, some, or none of the ALFA beams due to reflections off the telescope structure. Radar pulses are up to two orders of magnitude brighter than pulsar pulses and, without mitigation, can completely dominate single pulse search results. In addition, the modulation of the radar signal is manifested as detections with pc cm-3 so that unlike other non-radar RFI, their S/N vs. DM signature cannot be used for excision.
We exploit the known radar characteristics as well as the pattern of pulse detection in the 7 ALFA beams to excise both radar and non-radar RFI. The first part of our excision algorithm targets radar pulses. After a list of single pulse events is generated for all trial DMs, we bin the events for trial pc cm-3 in time (by 0.1 s) and record the number of events in each time bin. Then we treat the histogram as a time series and perform a discrete Fourier transform. A peak near the radar rotation frequency indicates a significant number of radar pulses in the data. From the Fourier components we extract the phase and find the arrival time of the earliest radar pulse, . Since the envelope width is s, events within 0.5 s of that location are excised, and the procedure is repeated for events near , where is an integer. The more radar pulses are present, the better the performance of this technique because the radar peak in the DFT is more prominent and the pulses’ arrival times are determined more precisely. However, if only a couple of strong radar pulses are present within the typical 268 s PALFA integration time, they may be bright enough to dominate event statistics, yet the DFT method does not excise non-periodic incidental RFI. Consequently, after applying the DFT-based method we use an additional RFI filter that handles aperiodic cases.
The second filter uses the number and proximity of beams in which an event is detected in order to determine if it is due to RFI. Again events for trial pc cm-3 from each beam are binned in time. After detecting peaks indicating an excess of events for the respective time bins, the algorithm cross-checks between results for all seven beams, and each event falling within a histogram peak receives a penalty grade based on how many beams’ histograms exhibit a peak and how close to each other they are on the sky. Most pulsars detected blindly via a single pulse search appear in one beam or two adjacent beams, and very bright pulsars may be detected in three or four adjacent beams. We set the excision penalty threshold just below the value corresponding to the latter configurations and excise events accordingly. This method complements the DFT cleaning scheme and effectively excises sparse radar blasts as well as non-periodic RFI detected in multiple beams. The application of the two excision algorithms makes a marked difference in the final single pulse search output for pointings contaminated with RFI (Fig. 5). The figure shows some false positives, for example a clump of pulsar pulses in beam 4 around s are excised due to low-level RFI at low DMs occurring in non-adjacent beams in the same 0.1 s time bins as the pulses. Lowering the threshold according to which an excess of events is defined and time bins are marked for excision reduces false positives but also diminishes the effectiveness of RFI excision. While tens of pulses are detected within 134 s from the bright pulsar B2020+28 (Fig. 5), for sources discovered via a single pulse search the number is an order of magnitude smaller (see § 7). Therefore the chance of RFI occurring simultaneously with pulses of intermittent sources and causing them to be excised is much lower.


IV. PALFA Pulsar Detection Statistics
The PALFA survey has made a total of 354 blind detections of 172 pulsars up to late 2008. Following quick-look processing of the data with degraded time and frequency resolutions at the time that data are acquired (Cordes et al. 7), data are shipped to external sites for processing through the Cornell pulsar search code and PRESTO. Table 2 shows a breakdown of Cornell detections, including pulsars originally discovered by the quick-look pipeline, by the periodicity (FFT) and single pulse (SP) search algorithms for known pulsars and new discoveries, and Table 3 lists parameters for PALFA single pulse discoveries that are discussed in more detail in § VII. Columns in Table 3 are (1) Pulsar name; (2)-(3): equatorial coordinates; (4) period; (5) pulse width (FWHM); (6) dispersion measure; (7) distance; (8) peak flux density of the brightest detected pulse; (9) total observation time; (10) total number of pulses detected; and (11) implied average pulse rate. The last column (12) points to the paper section that discusses the object.
| Pulsars | FFT only | SP only | FFT and SP | Total |
|---|---|---|---|---|
| Known | 48 (38%) | 5 (4%) | 73 (58%) | 126 |
| New | 28 (61%) | 6 (13%) | 12 (26%) | 46 |
| Pulsar | aaPosition uncertainties correspond to the angular radius (out to 50% of boresight power) of an individual ALFA beam in the discovery observation. | aaPosition uncertainties correspond to the angular radius (out to 50% of boresight power) of an individual ALFA beam in the discovery observation. | DM | bbEstimate from the NE2001 model of Galactic eletron density (Cordes & Lazio 10). | ccPeak flux density at 1.4 GHz defined as , where is the signal to noise ratio of the brightest detected pulse. | Rate | Comment | ||||
|---|---|---|---|---|---|---|---|---|---|---|---|
| (hh:mm:ss) | (dd:mm) | (s) | (ms) | (pc cm-3) | (kpc) | (mJy) | (s) | (h-1) | |||
| J0627+16 | 06:27:13(7) | 16:12(2) | 2.180 | 0.3 | 113 | 3.2 | 150 | 7454 | 48 | 23 | § VII.1 |
| J0628+09 | 06:28:33(7) | 09:09(2) | 1.241 | 10 | 88 | 2.5 | 85 | 1072 | 42 | 141 | § VII.2 |
| J1854+03 | 18:54:09(7) | 03:04(2) | 4.559 | 50 | 216 | 5.5 | 14 | 388 | 9 | 84 | § VII.3 |
| J1909+06 | 19:09:24(7) | 06:40(2) | 0.741 | 1.5 | 35 | 2.2 | 82 | 536 | 10 | 67 | § VII.4 |
| J1919+17 | 19:19:47(7) | 17:44(2) | 2.081 | 100 | 148 | 5.3 | 12 | 393 | 35 | 320 | § VII.5 |
| J1928+15 | 19:28:20(7) | 15:13(2) | 0.403 | 5 | 242 | 7.4 | 180 | 2880 | 3 | 4 | § VII.6 |
| J1946+24 | 19:46:00(7) | 23:58(2) | 4.729 | 4 | 96 | 4.3 | 101 | 268 | 4 | 54 | § VII.7 |
More than half of the detected known pulsars and only a quarter of the newly discovered objects were seen by both the periodicity and single pulse search algorithms. There is also a significant difference in the fraction of pulsars detected only via a single pulse search. In total, 74% of the new pulsars as opposed to 42% of the known pulsars were detected either only by FFT search or only by single pulse search. The much higher percentage of new pulsars to be detected only by one algorithm means that most of the PALFA discoveries are either periodic emitters too weak to show up in single pulse searches or intermittent objects whose emission is too heavily modulated be detected by a periodicity search. Considering that bright pulsars are more likely to be seen by both the FFT and SP search, and they are also more likely to have already been found by previous, less sensitive surveys, this indicates that PALFA is probing deeper and finding pulsars that are farther away or less bright than the known objects in the same region of the Galactic plane.
Single pulse searches have not been routinely carried out on survey data in the past, with the exception of [42], [40], who discovered PSR J1918+08 via a single pulse search, and [37], who found 11 RRATs. Therefore, the proportion of single-pulse-only detections is higher for the PALFA discoveries than the known pulsars. The five known pulsars detected only by single pulse search are known steady emitters which were seen away from the beam center and therefore with reduced sensitivity.
V. Selection Effects and Intermittency
The sample of PALFA single pulse discoveries (§ VII) includes one object which has not been detected again despite reobservations (J1928+15), two sources detectable in re-observations through their time-averaged emission (PSR J0628+09 and PSR J1909+06), and four long-period objects, one of which has the smallest known duty cycle for any radio pulsar (PSR J0627+16).
Among the 11 Parkes RRATs, 10 were successfully redetected in subsequent Parkes observations, and one (J183901) has not been redetected despite multiple attempts (McLaughlin et al. 37). PSR J084843 and PSR J175430 can sometimes be detected through their time-averaged emission with sensitive, low-frequency observations (McLaughlin 39). Six of the sources have periods greater than 2 s.
In this section we discuss selection effects which may account for some of the observational characteristics of intermittent sources. Characteristics of this population which remain unexplained by observational biases may indicate underlying intrinsic differences between these objects and conventional radio pulsars. They may belong to a genuinely intermittent and physically different class of neutron stars.
V.1. Multiplicative Effects
We can define a general model for observed signal intensity in terms of the time and frequency-dependent flux density as
| (6) |
where is the telescope gain, is the variation factor due to interstellar scintillation, is radiometer noise, and is the contribution from terrestrial radio frequency interference.
Variations in telescope gain across the beams of the multi-beam receiver or within the power pattern of a single beam impact the detectability of a pulsar as either a single pulse or periodic source. As shown by the reobservations of PSR J0627+16, PSR J1909+06, PSR J084843 and PSR J175430, classifying a source as intermittent may be due to insufficient sensitivity to detect its periodic emission during the discovery observation. The effectiveness of single pulse vs. FFT-based periodic search depends on the pulse amplitude distribution, and the observed pulse amplitude distribution in turn depends on the pulsar location with respect to the telescope beam power pattern. Fig. 6 shows the probability density function (PDF) of event amplitude for PSR B1933+16, a strong pulsar detected in two beams of the same PALFA pointing. One beam of the ALFA receiver is pointing directly at the pulsar and the low-intensity tail of the distribution is clearly visible since all pulses are above the detection threshold. The pulsar is also detected in the first sidelobe of an adjacent beam, in which case only the brightest pulses are above the detection threshold and only the high-intensity tail of the distribution is visible. Thus an off-axis detection of a steadily emitting pulsar may misrepresent it as an intermittent source.

A different set of effects which affect detectability in single pulse vs. periodic search is due to intervening ionized gas. Turbulence in the ionized interstellar gas and the motion of the pulsar with respect to the gas introduce phase modulations in the pulsar emission which cause the observed intensity to change over time and frequency. In general, the scintillation gain factor has contributions from both diffractive (DISS) and refractive (RISS) interstellar scintillation, such that [46]. The detectability of nearby pulsars with low DMs can be significantly affected by DISS, which can have time scales comparable to typical survey pointing times (minutes) and frequency scales . In terms of the observing frequency and the pulsar distance , the DISS time scale . The scintillation bandwidth and scattering timescale are related through . An empirical fit from [4] for in GHz and in ms gives an estimate for based on DM:
| (7) |
but there is significant scatter about this relationship. When the scintillation bandwidth and time scale are small, averaging over the observation time and bandwidth can quench DISS.
For refractive scintillation, and . Unlike for DISS, the time scale of RISS increases with distance and therefore it can become very long for distant pulsars with relatively high DMs. Both RISS and DISS can either help or hinder pulsar detection due to the time-variable constructive or destructive interference of wave fronts they cause. For a single-pass survey, this means that some weak pulsars may be detected because they are modulated above the detection threshold, and some pulsars that are otherwise bright enough may be missed because of scintillation modulation. [9] discuss in detail the detection probability for scintillating pulsars by single-pass and multi-pass surveys. Since PALFA is a single-pass survey, it may have missed pulsars that scintillate on time scales comparable to or longer than the observation time. None of our discoveries in Table 3 appear to be affected by DISS, though RISS over long time scales may affect the objects with higher DMs.
V.2. Observation Time vs Pulsar Period
The detectability of a pulsar as a periodic source depends on the integrated pulse flux within the observation, which is determined by the number of periods within the observation time, , along with the pulse amplitude distribution. For the same integrated flux per pulse, fewer periods within a fixed mean that long-period pulsars are less likely to be detected than short-period pulsars by any method relying on detecting integrated flux such as an FFT-based search or a continuum imaging survey. For FFT searches in particular, this effect is compounded by the fact that when is small, the harmonics of interest are in the low-frequency part of the power spectrum, which is often dominated by non-Gaussian red noise and RFI. Hereafter we use the term “small- bias” to refer to the combined influence of these effects on pulsar detectability.
VI. Intermittency Measure
Both the periodicity and single pulse searches perform with varying efficiency depending on an object’s degree of intermittency. In this section we present an intermittency measure method to quantify the relative performance of the two search algorithms, apply it to results from the Parkes Multibeam and PALFA surveys, and discuss general implications for surveys.
VI.1. Definition
We can compare the detectability of objects by periodicity and single pulse search and attempt to narrow down different classes of intermittent emitters by calculating the intermittency ratio
| (8) |
for each object in our sample of PALFA and Parkes detections. [36] derive
| (9) |
where and for a Gaussian pulse shape, is the maximum expected pulse intensity within periods and is a modified average pulse peak intensity.
The intermittency ratio is a system-independent measure of the efficiency of the two types of search for objects with different degrees of intermittency. In Fig. 7, expected values of vs. are shown for an exponential pulse amplitude PDF and power-law distributions with various indices. Lower limits on are given for intermittent sources which were not detected via periodicity search. In addition, we show values for pulsars that were detected using both the periodicity and single-pulse search algorithms in the PALFA and Parkes Multibeam surveys. A total of 283 PALFA pulsar detections and 255 Parkes Multibeam detections are shown in the plot, including multiple detections of some objects.

VI.2. Implications for Surveys
In Fig. 7, long-period pulsars are predominantly found in the upper left (small , large ) and millisecond pulsars in the lower right (large , small ).PSR B0525+21, with , has s and pc cm-3, which make it susceptible to both the small- bias and diffractive scintillation and therefore it is detected more readily as a single pulse source. At the other extreme is PSR B1937+21, a millisecond pulsar which emits giant pulses but is nevertheless detected with a much higher S/N in the periodicity search than in the single pulse search () because its period is small compared to the PALFA observation time and the normal pulse amplitude is exceptionally steady (Jenet & Gil 23). This indicates that the effect of on detectability can overshadow individual properties, and in survey mode millisecond pulsars will show up overwhelmingly as periodic sources. In that case, processing the data with a single pulse search algorithm can reveal the presence of giant pulses in an otherwise steady emitter.
In-between PSR B0525+21 and PSR B1937+21, from upper left to lower right is a relatively smooth distribution of pulsars whose intermittency ratios are predominantly determined by the influence of on the detectability of all types of periodic emitters. We look for unusual objects among the outliers from that trend. There are a number of pulsars detected both in periodicity and single pulse search in the region where , including PSR B0656+14, which occasionally emits bursts much brighter than the average pulse and would arguably be classified as a RRAT if located farther away (Weltevrede et al. 52). Interspersed among them in the region are most of the PALFA and Parkes intermittent sources. PSR J1909+06, which was not detected in a periodicity search but is visible as a periodic source when folded with its known period, has , and the long-period PALFA intermittent sources PSR J1854+03 and PSR J1946+24 have and 1.8, respectively. Of the Parkes intermittent sources, seven have . PSR J175430 () and PSR J084843 () were detected through their time-averaged emission in low frequency follow-up observations. In the region we find only five objects: PSR B0525+21, the Crab pulsar, Parkes intermittent sources PSR J13175759 and PSR J18191458, and PALFA intermittent source PSR J1928+15. The Crab pulsar has a high intermittency ratio due to its giant pulses but is otherwise a relatively steady emitter as periodic emission is consistently detected even if the giant pulses are ignored. Of the remaining three intermittent sources none are young pulsars like the Crab. The pulse amplitude distributions of PSR J13175759 and PSR J18191458 are described by power laws with indices (McLaughlin et al. 37), smaller than measured giant pulse indices of (e.g. Kinkhabwala & Thorsett 26, Cordes et al. 8).
We conclude from Fig. 7 is that periodicity and single pulse searches should be used in combination by pulsar surveys since there are types of sources which are best detected by either method. As more intermittent objects are found, placing them in space may help us identify physically distinct populations. In addition, repeated sky coverage can probe intermittency at time scales of days to months.
VII. Single Pulse Discoveries
Table 3 lists parameters of the seven pulsars discovered by PALFA via a single pulse search. In this section we discuss each object’s properties in detail and describe the steps taken in addition to the PALFA processing pipeline in order to verify the signals’ celestial origin and calculate the pulsar period from times of arrival of single pulses.
VII.1. PSR J0627+16
PSR J0627+16 was discovered when nine single pulses were detected at a trial pc cm-3 (Fig. 2). The period estimated from the pulse arrival times in the discovery observation is s. What is unusual about this object is its very narrow peak in S/N vs. DM space, indicating a narrow pulse (Cordes & McLaughlin 11). Fig. 4c shows the cumulative dynamic spectrum after stacking raw data chunks aligned around the five brightest pulses. A fit to the dispersion sweep in the time-frequency plane gives a best DM of 113 pc cm-3 and when the raw data chunk around the brightest pulse is dedispersed with this DM, the FWHM pulse width is only 0.3 ms.
Two follow-up observations at 0.33 and 1.4 GHz yielded 17 pulses in 50 minutes and 22 pulses in 72 minutes, respectively. After removing bright single pulses from the dedispersed time series and replacing the respective time samples with a running average, periodic emission with s was detected throughout the 0.33 GHz observation, confirming the period estimate from the discovery observation at 1.4 GHz and the presence of underlying normal emission.
Many of the RRATs detected by [37] have short duty cycles, calculated as the ratio between the average width of single pulses and the period. PSR J0627+16 has the smallest known duty cycle, by this definition. However, for steady emitters the duty cycle is typically defined as the ratio of the folded pulse profile FWHM and the period. Individual pulses may occur in a phase window wider than any individual pulse and corresponding to the folded profile width. At 1.4 GHz, the individual 0.3 ms pulses of J0627+16 occur in a 8 ms window, while at 0.33 GHz individual pulses have widths of ms and occur in a 15 ms window. The folded pulse profile at 0.33 GHz has FWHM of 60 ms, suggesting that bright pulses may be confined to a narrower window than pulses comprising the underlying normal emission.
The detection of bright single pulses and a weak periodic signal from PSR J0627+16 when data are folded with an accurate period estimate, along with the absence of a periodic detection in search mode weighs in favor of the proposition of [52] that some RRATs may have periodic emission with highly variable pulse amplitudes.
VII.2. PSR J0628+09
PSR J0628+09 was discovered by detecting three pulses at pc cm-3. The period estimated from the pulse times of arrival was 2.48 s. In follow-up observations the pulsar was also detected in periodicity searches as it emits on average several bursts per minute. The periodicity detections and the larger number of single pulses in subsequent observations allowed the actual pulsar period of 1.241 s to be determined (Cordes et al. 7).
VII.3. PSR J1854+03
PSR J1854+03 was discovered in 2008 via a single pulse search performed on full-resolution survey data. Four pulses were detected at pc cm-3 during the 268 s observation. The period s was estimated by taking the smallest difference between times of arrival (TOAs) of two consecutive pulses and verifying that intervals between all four TOAs are integer multiples of it. A confirmation observation with the more sensitive central ALFA beam yielded within 120 s five pulses whose arrival times match the estimated period.
VII.4. PSR J1909+06
PSR J1909+06 was observed in 2006 but not identified as a candidate until 2007 when the full-resolution data were searched for single pulses. Two pulses with a width of ms and signal to noise ratio of 6 and 9 were detected at pc cm-3. The stacked dynamic spectrum clearly shows a dispersion sweep (Fig. 4d). PSR J1909+06 was discovered in data from the off-axis beam 2 of the multi-beam ALFA receiver. Since the on-axis gain of the center beam is 10.4 K/Jy compared to 8.2 K/Jy for the other six beams (Cordes et al. 7), we aimed the center beam at the discovery coordinates for a confirmation observation. For the same integration time of 268 s, 8 pulses with were detected in the confirmation observation. We used the pulse arrival times to determine a period and arrived at a best estimate of s.
VII.5. PSR J1919+17
During the 2007 discovery observation of PSR J1919+17, multiple pulses at pc cm-3 were detected in beam 4 of the ALFA receiver, with no corresponding periodic detection. A Fast Folding Analysis (Staelin 48, Kondratiev et al. 27) was used to narrow down the period to s, which was confirmed in 2008, when the pulsar was detected as a normal periodic emitter with the more sensitive central ALFA beam. The pulsar has a double-peak profile with the two peaks ms apart, which most likely made it difficult to find its period from pulse arrival times alone.
VII.6. PSR J1928+15
PSR J1928+15 was discovered in 2005 by detection of what looked like a single bright pulse at pc cm-3 in a 120 s observation (Fig. 3, top). More detailed analysis revealed that the event was in fact composed of 3 separate pulses occurring at intervals of 0.403 s, with the middle pulse being brighter by an order of magnitude than the other two (Fig. 3, bottom). In Fig. 4a the dispersion of the brightest pulse by ionized interstellar gas is shown in the time-frequency plane, evidence of the non-terrestrial origin of the pulses. A fit to the pulse signal in the time-frequency plane resulted in a refined estimate of pc cm-3. Despite multiple follow-up observations, the source has not been detected again.
Given the DM of this source, 242 pc cm-3, it is unlikely that the non-detection can be attributed to diffractive scintillation. Since the three pulses are equally spaced, they can be interpreted as a single event seen in successive rotations of a neutron star. This signature might be accounted for by an object that is dormant or not generally beamed toward the Earth and whose magnetosphere is perturbed sporadically by accretion of material from an asteroid belt [12].
VII.7. PSR J1946+24
PSR J1946+24 has pc cm-3 and s and was discovered by detecting 4 individual pulses. The intervals between detected pulses in this case were all s. The brightest detected pulse of PSR J1946+24 has and its dispersion sweep is visible in the time-frequency plane without any stacking (Fig. 4b).
VII.8. Summary of Timing Solutions
Single pulse arrival times collected over multiple follow-up observations were used to obtain partial timing solutions for PSR J0628+09, PSR J1909+06, PSR J1919+17, PSR J1854+03 and PSR J1946+24 and verify their estimated periods. The periods of PSR J0627+16 and PSR J1909+06 were verified by manually folding raw data and detecting a periodic signal. Finally, despite the fact that PSR J1928+15 was not detected after the discovery observation, the s intervals between the three pulses detected from that source differ by only ms, which is approximately half the FWHM pulse width and therefore provides a period estimate to that precision. We are currently timing the six sources which were successfully redetected. Obtaining phase-connected timing solutions will enable us to compare them to other neutron star populations and will yield positions which will facilitate observations at higher wavelengths.
VIII. Constraints on Fast Transients
The PALFA survey was designed to detect pulsars and pulsar-like objects by identifying either (or both of) their periodic or single-pulse emission, as discussed earlier in this paper. The same data may also be used to detect transient events from other Galactic and extragalactic sources. At minimum, the PALFA survey can place limits on the rate and amplitude distribution of radio transients that are shorter than about 1 second in duration. Possible source classes for short-duration transient events, to name a few, include flare stars, magnetar bursts, gamma-ray bursts (GRBs), and evaporating black holes. GRBs have diverse time scales spanning ms to 1000 s. Mergers of double neutron-star (DNS) binaries and neutron star-black hole (NS-BH) binaries are proposed sources for short bursts, and they may also emit contemporaneous radio pulses (Paczynski 41, Hansen & Lyutikov 19). Merger rates in the Galaxy are estimated to be to 150 Myr-1 for DNS binaries from pulsar surveys and a factor of 20-30 less for NS-BH binaries from population synthesis studies (E.g., Rantsiou et al. 45). Event rates of detectable events depend critically on the luminosity of radio bursts but are likely to be comparable to the rate of short-duraction GRBs, and thus smaller than event day-1 hemisphere-1. Another phenomenon that may produce rare, bright pulses is the annihilation of primordial black holes (Rees 44). [42] estimate the Galactic rate for such events to be kpc-3 yr-1. Other possibilities are discussed in [6].
Motivated by these considerations, we discuss the constraints that can be made on transient events from PALFA survey data obtained to date. First, we note that most — but not all — of the aperiodic events detected to date in PALFA data (as reported in § VII) and in the Parkes Multibeam Survey by [37], appear to be periodic when they are reobserved sufficiently to establish a periodicity. Additionally, all events detected so far in both surveys have dispersion measures that can be accounted for by ionized gas in the Galaxy (using the NE2001 model), suggesting that the emitting sources are closely related to the standard Galactic pulsar population. By constrast, [32] recently detected a strong (30 Jy), isolated burst with duration ms that shows DM pc cm-3, too large to be accounted for by modeled foreground material in the Galaxy or by plasma in the Small Magellanic Cloud, which is somewhat near the direction the event was found.
VIII.1. Discriminating Celestial Events from RFI
In addition to detecting radio sources on axis in data streams from each of the seven beams of the ALFA system, it is possible to detect strong events off axis with low but non-zero sensitivity over almost the entire hemisphere centered on the zenith. Consequently, it is possible to detect relatively low-rate but very bright transients off axis as well as the much weaker but higher rate single pulses that we have detected in the on-axis parts of the beam pattern.
To establish that a given event is celestial in nature, we need to distinguish it from terrestrial interference. For on-axis events, this classification process is aided by the directionality of the seven beams and the expectation that most real events are likely to be seen in three or fewer contiguous beams rather than in all seven beams. Bright events may violate this expectation, however, because near-in sidelobes are fairly large (c.f. Figure 1 of Cordes et al. 7). Celestial and terrestrial radio signals can also enter the seven beams of the ALFA receiver indirectly — far off the nominal pointing axis — through reflection and scattering off telescope support structures, as with any antenna. Extremely bright signals (celestial or terrestrial) may be detected after scattering into one or more beams, and the effective gain is approximately that of an isotropic radiator with small gain for events incident far off axis from the pointing direction. For the Arecibo telescope, which has an intricate support structure with many possible scattering surfaces, such wide-angle incidence is likely to provide multiple paths for radiation to enter the feed optics. Radiation arriving along multiple paths will constructively and destructively interfere across ALFA’s focal plane, so that the event’s strength will be nonuniform in the different data streams.
When radiation enters the telescope optics from wide angles, it is difficult to distinguish celestial from terrestrial signals based on the nominal pointing direction of the telescope and on whether they are detected in a single beam, a subset of beams, or all beams. Conceivably, extremely bright events from a single radio source could be emitted at very rare intervals that would be detected when the telescope is pointed nominally at directions separated by tens of degrees (but within the same hemisphere). Such sources and events will be exceedingly difficult to disentangle from terrestrial RFI.
Of course the most powerful confirmation of a particular event is the detection of similar events in reobservations of the same sky position. For most of the events reported in § VII and by [37], redetections have been made in this manner. They have also relied on establishing that their signatures in the frequency-time plane conform to what is expected. The simplest celestial signals are narrow pulses that show differential arrival times in accord with the cold-plasma dispersion law (e.g. Cordes & McLaughlin 11). Celestial objects may also show the effects of multipath propagation through the interstellar medium (ISM) either in the frequency structure that is produced in the spectra of nearby pulsars or in the asymmetric broadening of the pulses from more distant objects. For cases where spatial information associated with the nominal telescope pointing direction is insufficient to constrain the celestial nature of a particular event, we must rely especially on a detailed study of the event’s structure in the time-frequency plane. Indeed the time-frequency structure of the event discussed by [32] was a key part of the argument for its classification as a celestial event.
VIII.2. Simple Model for ALFA Beam Patterns
A given reflector and feed antenna have a net antenna power pattern with a main lobe and near-in sidelobes that is similar to an Airy function with a main-lobe angular width , where is the effective reflector diameter. The wide-angle part of the antenna pattern has far-out sidelobes that are independent of and have average gains , similar to that of an isotropic antenna. However peaks in the far-out sidelobe pattern can have gains significantly larger than , corresponding to special directions where scattering from the telescope support structure is especially efficient. For the Arecibo telescope, we expect sidelobes to have the same general properties, with the caveat that support structures will introduce further complexity in the far-out sidelobe pattern that varies as the telescope is used to track a source. Tracking a sky position is done by rotating the azimuth arm and moving the Gregorian dome along the azimuth arm, thus changing the scattering geometry. We therefore expect the sidelobe structure to change significantly with azimuth and elevation of the targeted position on the sky. For the seven-beam ALFA system, the main beams by design sample different parts of the sky, as do the near-in sidelobes. At wider angles, the power pattern of each feed overlaps the others but with considerable variation in gain from feed to feed.
To derive simple constraints on burst amplitudes and rates, we expand the gain for each feed into inner beam and wide-angle terms:
| (10) |
where and are polar and azimuthal angles, respectively; is the power pattern for the main beam and near-in sidelobes; is the main-beam efficiency, and is the average level of the far-out sidelobes. The boresight gain is
| (11) |
where is the effective telescope area, and and are the solid angles of the antenna power pattern and of the main beam, respectively. The system equivalent flux density is
| (12) |
where is the Boltzmann constant and is the system temperature. The minimum detectable flux density is
| (13) |
which is a function of the event duration, , as well as system parameters. It is useful to define as the minimum detectable flux density for unit gain using Eq. 12 with . Substituting into Eq. 13 yields, for two polarizations and MHz,
| (14) |
we note that for some directions, the system temperature can differ from the fiducial 30 K used.
IX. Constraints on Event Rates and Amplitudes
We now derive limits that can be placed on the rate and amplitudes of transient events using our simple model for the antenna power pattern. Let be the event rate per unit solid angle from a population of sources, which implies a total number in a total observation time . If no events are detected, we can place an upper limit on the rate for minimum flux density, . We treat the response of the antenna power pattern as azimuthually symmetric about the bore axis, so , and calculate the gain as a function of polar angle from the bore axis. For each annulus of solid angle , the upper bound on the rate is
| (15) |
for flux densities greater than
| (16) |
The multiplier accounts for whether a given ALFA feed and receiver combination samples the same patch of sky or not. For the main lobes, while for the far-out sidelobes, .
We evaluate fiducial values by integrating respectively over the main beams and over the remainder of the power patterns. For a main-lobe beam width of 3.5 arc min, deg2 and . Using the average gain over the main beam out to the half-power point, , we have
| (17) |
and
| (18) |
Integrating over wide angles, and using , we estimate
| (19) |
where the far-out sidelobes have an average gain of , and
| (20) |
where is the fraction of the hemisphere actually covered by the far-out sidelobes.
Results for PALFA data are shown in Fig. 8. Within the half-power beam width the constraints are strong on the flux density but weak on the event rate while the opposite is true for the far-out sidelobes, represented by the part of the curve below h-1 deg-2. The asympotic value of the curve corresponding to the maximum, boresight gain differs from the fiducial value calculated above because the latter is an average over the main beam. In our simple model the near-in sidelobes are not included explicitly so our curves overestimate at the corresponding polar angles. However, the limits change rapidly, so this does not change the salient features of the figure, which are the seven order-of-magnitude difference in constrained amplitudes and the eight order of magnitudes on the event rates between the main lobs and the far-out sidelobes.

IX.1. Comparison with Other Results
A brief summary of our results is that (a) a small number of events has been detected from sources that are consistent with their membership in the radio pulsar population, but with a much greater deal of modulation in some cases; (b) no very strong pulses have been identified in the far-out sidelobes of the Arecibo telescope and (c) no bursts have been detected that are extragalactic in origin.
Here we compare our results with those of [32], who surveyed high-Galactic-latitude regions that included the Magellanic Clouds and who discovered a single reported pulse, with amplitude 30 Jy. They surveyed deg2 with a detection threshold mJy, about 100 times fainter than the detected pulse amplitude. To compare any two surveys, we initially assume a population of radio sources that is homogeneously distributed in Euclidean space and we ignore propagation effects that might limit the detectability of bursts from distant sources. The number of events detected for a survey of duration that samples instantaneously a solid angle . For multibeam systems with pixels, , where is the solid angle of a single beam. We assume events have the same peak luminosity and pulse width and are detectable to a distance . The ratio of number of detected events in two surveys with total observation times and , and bandwidths and is
| (21) | |||||
As pointed out by [32], the same survey that detected the 30-Jy pulse should have yielded many more detections if the assumptions of a volume limited sample apply. Using Eq. 21, the lone 30 Jy pulse implies there should have been additional detections above a 100-times fainter threshold. In the 90 h of follow up observations, there should have been additional detections. Comparing the Parkes and PALFA surveys33 3 For PALFA, we use 7 pixels each of size 3.5 arcmin, 461 h of observations, a threshold of , a system-equivalent flux density of 4 Jy, and 100 MHz bandwidth. For the Parkes survey we use 13 beams of 14 arcmin diameter, 480 h, a threshold of 600, Jy, and 288 MHz bandwidth., we estimate that the PALFA survey should have identified pulses above threshold.
The PALFA survey’s null result on extragalactic events is therefore in accord with Lorimer et al.’s non-detection of events weaker than the single strong event they reported. With the assumptions made, these results suggest that the non-detections of pulses weaker than the 30-Jy pulse are inconsistent with the source population having a distribution that is homogeneous and isotropic.
IX.2. Caveats
There are caveats on these results related to the assumptions about the source population and to the possible role of propagation effects in limiting detectability. The minimum detectable flux density for the PALFA survey is 30 mJy for a 5-ms pulse, implying that a pulse of 30 Jy strength emitted at a distance is detectable to a distance given by . If the lone event detected by Lorimer et al. is from a source at the attributed distance Gpc (based on assigning about half of the DM to the intergalactic medium), the PALFA survey would detect fewer pulses than estimated above (for constant luminosity) because the universe is not old enough and from redshifting of the spectrum if it is steep in frequency. Nonetheless, a cosmological population of constant-luminosity sources would extend to times the attributed distance, implying from the first form of Eq. 21 that pulses should have been detected in the PALFA survey, on average, while weaker pulses should have been seen in the discovery survey with Parkes. The difference in yield under this alternative scaling results from the fact that the PALFA survey can detect sources well beyond the cosmological population while the Parkes survey is comparatively shallower (by a factor of ten in flux density, i.e. 300 compared to 30 mJy), but covers a factor of 30 greater solid angle. Consideration of a broad luminosity function does not alter these conclusions qualitatively. However, we would generally expect the pulse amplitude distribution to extend to lower flux densities (from lower luminosities) given that the sole reported event was much larger than the threshold and that, therefore, many more pulses are expected compared to the constant-luminosity assumption.
Pulse broadening from multipath propagation in either the ISM or the intergalactic medium (IGM) can also limit the numbers of events detected in a survey because the broadening increases with source distance. The maximum detectable distance is therefore diminished, as demonstrated for the ISM in Figure 1. Lorimer et al. argued that the strong frequency dependence of the width of the 30-Jy pulse was consistent with multipath propagation through a turbulent, ionized IGM. If so, sources from a greater distance would be less-easily detectable. In the simplest scattering geometries, scattering conserves the area of the pulse, so matched filtering yields a test statistic with S/N when the pulse broadening time is much larger than the intrinsic pulse width (Cordes & McLaughlin 11). The 30-Jy pulse therefore could have been broadened by an additional factor of and the S/N still would have been above threshold. The much longer pulses ( ms = 50 s) would have been difficult if not impossible to identify in the time series owing to high-pass filtering used to mitigate baseline fluctuations. The high-pass filtering was explicit in the Parkes Multibeam data acquisition but is part of the post-processing in the PALFA analysis. Such very broadened pulses could be detected by imaging surveys with relatively short integration times like the NRAO VLA Sky Survey (NVSS) and future surveys with the Australian Square Kilometer Array Pathfinder44 4 http://www.atnf.csiro.au/projects/askap or the Allen Telescope Array55 5 http://ral.berkeley.edu/ata.
In between this extreme case of 50-s broadening and the reported pulse width of ms is a substantial search volume in which more distant sources could have produced detectable events. Broadening from sources at redshifts greater than one is increased by the larger electron density but is lessened by the frequency redshift, so the net scaling of the pulse broadening with redshift depends on how the scattering material is distributed along the line of sight.
X. Conclusions
We have examined the current state of knowledge about various classes of intermittent radio-loud neutron stars, summarized selection effects that may affect the classification of intermittent sources, and presented our data processing methods and results from single pulse searches performed on PALFA survey data. One of our single-pulse discoveries is a relatively persistent emitter that, like many other pulsars, shows a broad amplitude distribution, from which a few bright pulses were detected. Two sources were detected as normal periodic emitters when observed at a lower frequency (PSR J0627+16) and with the more sensitive central beam of the ALFA receiver (PSR J1919+17). Four objects were most likely not detected via periodicity search because of their long periods ( s) compared to the PALFA observation time of s, and one intermittent object (PSR J1928+15) was discovered by detecting three pulses emitted on successive rotations but it was not detected again despite multiple reobservations.
Most of the PALFA sources that were discovered solely through the single-pulse analysis have subsequently been found to be sporadic but with measureable and consistent rates of detectable pulses. The Parkes survey had similar results. However, two sources (the Parkes source PSR J183901 and the PALFA source PSR J1928+15) are much more irregular even though an underlying periodicity has been found in each case. We therefore distinguish between cases where the apparent sporadic behavior is due to a detection threshold that selects only the strongest pulses from a broad distribution (e.g. Weltevrede et al. 52) and those where emission is truly intermittent.
A major issue is related to the question, if we see transients from a given sky direction only once, how can we figure out what phenomena produce them. We must archive radio survey data and characterize the wide variety of detected radio transients outside the framework of rotating neutron stars if necessary. Archived data may yield new discoveries if reprocessed with improved search algorithms and a database of transient signals would be an invaluable reference as theoretical understanding of energetic radio events and prediction of their signatures improves. The PALFA survey is taking steps in both directions: raw data are stored in a tape archive and data processing products are indexed in a database at the Cornell Center for Advanced Computing and currently work is under way to make them publicly available via a web portal.66 6 http://arecibo.tc.cornell.edu
We thank the staff at NAIC and ATNF for developing the ALFA receiver and the associated backend systems. In particular, we thank Jeff Hagen, Bill Sisk and Steve Torchinsky at NAIC and Graham Carrad at the ATNF. We are also grateful to the Parkes Multibeam survey team for providing the results incorporated in Fig. 7. This work was supported by the NSF through a cooperative agreement with Cornell University to operate the Arecibo Observatory. NSF also supported this research through grants AST-02-05853 and AST-05-07376 (Columbia University), AST-02-06035 and AST-05-07747 (Cornell University) and AST-06-47820 (Bryn Mawr College). M.A.M., D.R.L. and P.C.C.F. are supported by a WVEPSCoR Research Challenge Grant. M.A.M. is an Alfred P. Sloan Research Fellow. F. Crawford is supported by grants from Research Corporation and the Mount Cuba Astronomical Foundation. J.W.T.H. is a NWO Veni Fellow. Pulsar research at UBC is supported by NSERC and the Canada Foundation for Innovation. I.H.S. acknowledges support from the ATNF Distinguished Visitor program and the Swinburne University of Technology Visiting Distinguished Researcher Scheme. L.E.K. held an NSERC Canada Graduate Scholarship while most of this work was performed. V.M.K. holds a Canada Research Chair and the Lorne Trottier Chair, and is supported by NSERC, FQRNT, CIFAR, and by the Canada Foundation for Innovation. The Parkes telescope is part of the Australia Telescope, which is funded by the Commonwealth Government for operation as a National Facility managed by CSIRO. NRAO is a facility of the NSF operated under cooperative agreement by Associated Universities, Inc. Research in radio astronomy at the NRL is supported by the Office of Naval Research.
References
- [1] Backer, D.C. 1970, Nature, 228, 42
- [2] Berger, E. 2002, ApJ, 572, 503
- [3] Berger, E. et al. 2001, Nature, 410, 338
- [4] Bhat, N.D.R., Cordes, J.M., Camilo, F., Nice, D.J. & Lorimer, D.R. 2004, ApJ, 605, 759
- [5] Champion, D. J. et al. 2008, Science, 320, 1309
- [6] Cordes, J. M. 2007, Square Kilometer Array Memo 97, http://www.skatelescope.org
- [7] Cordes, J. M. et al. 2006, ApJ, 637, 446
- [8] Cordes, J. M., Bhat, N. D. R., Hankins, T. H., McLaughlin, M. A. & Kern, J. 2004, ApJ, 612, 375
- [9] Cordes, J.M. & Lazio, T.J.W. 1991, ApJ, 376, 123
- [10] Cordes, J.M. & Lazio, T.J.W. 2002, astro-ph/0207156
- [11] Cordes, J.M. & McLaughlin, M.A. 2003, ApJ, 596, 1142
- [12] Cordes, J.M. & Shannon, R.M. 2008, ApJ, 682, 1152
- [13] Dowd, A., Sisk, W., Hagen, J. 2000, ASPC, 202, 275
- [14] Farrell, W. M., Desch, M. D., & Zarka, P. 1999, JGR, 104, 14025
- [15] Fender, R. P., Bell Burnell, S. J., Waltman, E. B., Pooley, G. G., Ghigo, F. D., & Foster, R. S. 1997, MNRAS, 288, 849
- [16] Fruchter, A. S., Stinebring, D. R. & Taylor, J. H. 1988, Nature, 333, 237
- [17] Garc´ia-S´anchez, J., Paredes, J. M., & Rib’o,M. 2003, A&A, 403, 613
- [18] Hankins, T. H., Kern, J. S.,Weatherall, J. C., Eilek, J. A., 2003, Nature, 422, 141
- [19] Hansen, M.S. & Lyutikov, M. 2001, MNRAS, 322, 695
- [20] Hessels, J. W. T. et al. 2008, ApJ, 682, L41
- [21] Huchra, J. P. & Geller, M. J. 1982, ApJ, 257, 423
- [22] Jackson, P. D., Kundu, M. R., & White, S. M. 1989, A&A, 210, 284
- [23] Jenet, F. A. & Gil, J. 2004, ApJ, 602, L89
- [24] Johnston, S., van Straten, W., Kramer, M.,& Bailes, M. 2001, ApJ, 549, L101
- [25] Kaspi, V. M., Ransom, S. M., Backer, D. C., Ramachandran, R., Demorest, P., Arons, J. & Spitkovsky, A. 2004, ApJ, 613, L137
- [26] Kinkhabwala, A. & Thorsett, S. E. 2000, ApJ, 535, 365
- [27] Kondratiev, V. I., McLaughlin, M. A., Lorimer, D. R., Burgay, M., Possenti, A., Turolla, R., Popov, S. B., Zane, S. 2009, submitted
- [28] Knight, H. S. 2006, ChJAA, 6, 41
- [29] Kramer M., Lyne A.G., O’Brien J.T., Jordan C.A. & Lorimer D.R. 2006, Science, 312, 549
- [30] Lazio, T. J. W., Farrell, W. M., Dietrick, J., Greenlees, E., Hogan, E., Jones, C., Hennig, L. A. 2004, ApJ, 612, 511
- [31] Lorimer, D. R. et al. 2006, ApJ, 640, 428
- [32] Lorimer, D.R., Bailes, M., McLaughlin, M.A., Narkevic, D.J. & Crawford, F. 2007, Science, 318, 777
- [33] Lyne, A. G., Biggs, J. D., Harrison, P. A. & Bailes, M. 1993, Nature, 361, 47
- [34] Manchester, R. N., Lyne, A. G., Camilo, F., Bell, J. F., Kaspi, V. M., D’Amico, N., McKay, N. P. F., Crawford, F., Stairs, I. H., Possenti, A., Kramer, M., Sheppard, D. C. 2001, MNRAS, 328, 17
- [35] Manchester, R. N., Hobbs, G. B., Teoh, A. & Hobbs, M. 1993-2006 (2005) AJ, 129
- [36] McLaughlin, M.A. & Cordes, J.M. 2003, ApJ, 596, 982
- [37] McLaughlin, M. A. et al. 2006, Nature, 439, 817
- [38] McLaughlin, M. A., Rea, N., Gaensler, B. M., Chatterjee, S., Camilo, F., Kramer, M., Lorimer, D. R., Lyne, A. G., Israel, G. L., Possenti, A. 2007, ApJ, 670, 1307
- [39] McLaughlin, M. A. 2007, in “Neutron Stars and Pulsars”, ed. W. Becker, 357, 373
- [40] Nice, D. J. 1999, ApJ, 513, 927
- [41] Paczynski, B. 1986, ApJ, 308, L43
- [42] Phinney, S. & Taylor, J.H. 1979, Nature, 277, 117
- [43] Popov, M. V., Soglasnov, V. A., Kondratiev, V. I., Kostyuk, S. V., 2004, Astronomy Letters, 30, 95
- [44] Rees, M. J. 1977, Nature, 266, 333
- [45] Rantsiou, E., Kobayashi, S., Laguna, P. & Rasio, F. A. 2008, ApJ, 680, 1326
- [46] Rickett, B. J. 1990, ARA&A, 28, 561
- [47] Sagiv, A. & Waxman, E. 2002, ApJ, 574, 861
- [48] Staelin, D. H. 1968, Proc. IEEE, 57, 724
- [49] Stappers, B. W., Bailes, M., Lyne, A. G., Manchester, R. N., D’Amico, N., Tauris, T. M., Lorimer, D. R., Johnston, S. & Sandhu, J. S. 1996, ApJ, 465, L119
- [50] Usov, V. V. & Katz, J. I. 2000, A&A, 364, 655
- [51] Waltman, E. B., Ghigo, F. D., Johnston, K. J., Foster, R. S., Fiedler, R. L., & Spencer, J. H. 1995, AJ, 110, 290
- [52] Weltevrede, P., Stappers, B.W., Rankin, J.M. & Wright, G.A.E. 2006, ApJ, 645L, 149
- [53] Zarka, P., Farrell, W. M., Kaiser, M. L., Blanc, E., Kurth, W. S. 2004, P&SS, 15, 1435