Magnetic Monopole Search with the SLIM experiment
Abstract
The SLIM experiment was an array of 427 of nuclear track detectors, exposed at a high altitude laboratory (Chacaltaya, Bolivia, 5230 m a.s.l.), for 4.22 years. SLIM was sensitive to downgoing intermediate mass magnetic monopoles with masses of GeV GeV. The analysis of the full detector gives a flux upper limit of (90% C.L.) for downgoing fast intermediate mass magnetic monopoles.
Keywords:
magnetic monopoles , rare particles , nuclear track detector1 Introduction
P.A.M. Dirac introduced the concept of the magnetic charge "g" in order to explain the quantization of the electric charge "e". He obtained the formula , from which , where (Dirac, 1931). Magnetic Monopoles (MMs) possesing an electric charge and bound systems of a MM with an atomic nucleus are called dyons (Giacomelli, 2000).
The electric charge is naturally quantified in Grand Unified Theories (GUT) of the strong and electroweak interactions which descrives phase transitions of the early Universe at the mass scale GeV. These models imply the existence of GUT monopoles with calculable properties such as their masses. The MM mass is related to the mass of the X, Y carriers of the unified interaction, , where G is the dimensionless unified coupling constant at energies E . If GeV and , GeV (Ambrosio, 2002).
Some GUT models and Supersymmetric models predict Intermediate Mass Monopoles (IMMs) with masses GeV and magnetic charges of integer multiples of . IMMs may have been produced in later phase transitions in the early Universe and could be present in the cosmic radiation and may be accelerated up to relativistic velocities in one coherent galactic magnetic field domain. Thus one may look for downgoing, fast () heavily ionizing IMMs (Balestra, 2008; Giacomelli, 2007).
The exposure at a high altitude laboratory allows to search for IMMs of lower masses, higher charges and lower velocities. The main purpose of the SLIM (Search for LIght magnetic Monopoles) experiment deployed at the Chacaltaya laboratory in Bolivia at 5230 m a.s.l., was the search for IMMs (Balestra, 2008; Bakari, 2000).Fig. 1 shows the accessible regions in the plane (mass, ) for experiments located at different altitudes. The SLIM detector was also sensitive to strange quark matter nuggets (Witten, 1984) and Q-balls (Coleman, 1985); the results on these dark matter candidates are discused in (Shanoun, 2008).

2 Experimental procedure
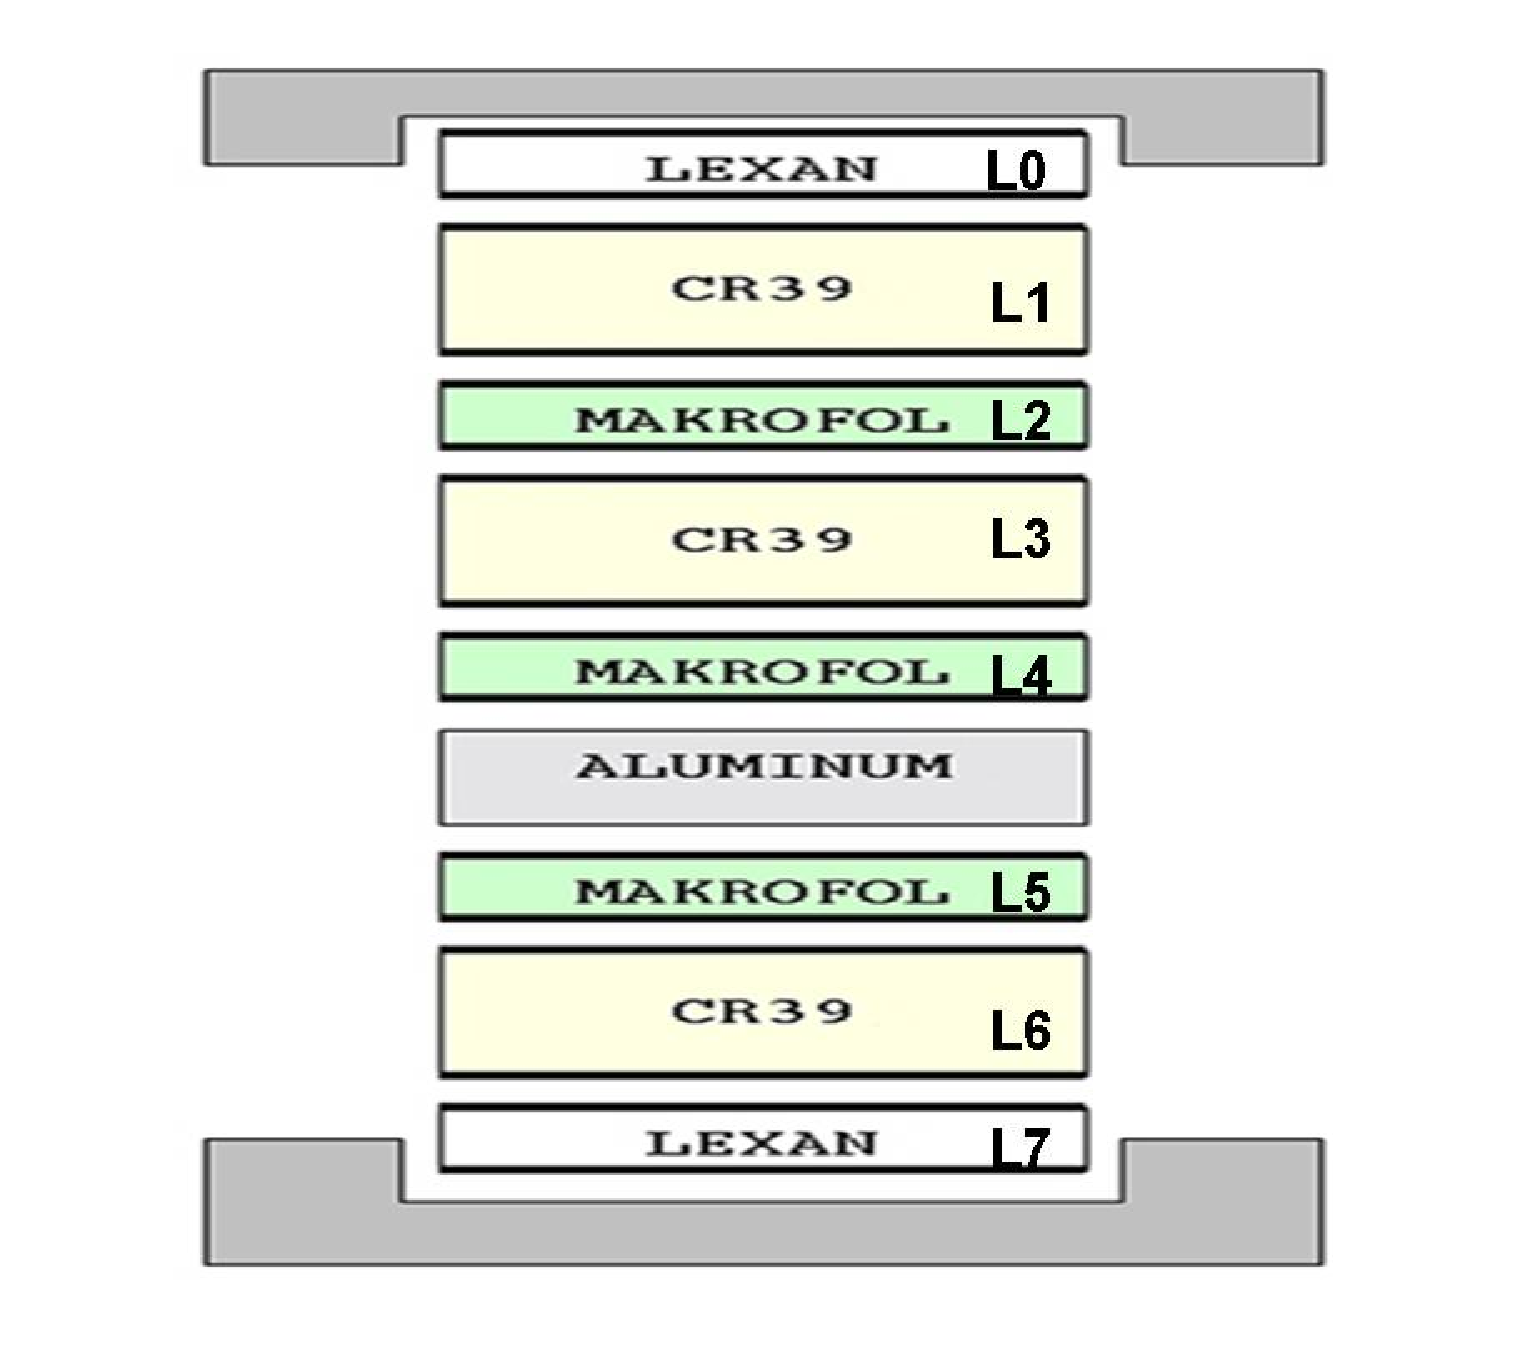
The SLIM detection area (427 ) was an array organized into 7410 modules, each one of area cm2 (Bakari, 2000).All modules were made up of: three layers of CR39® 11 1 The SLIM CR39 was produced by the Intercast Europe Co, Parma, Italy according to our specifications., each 1.4 mm thick; 3 layers of Makrofol DE® 22 2 Manufactured by Bayer AG, Leverkusen, Germany., each 0.48 mm thick; 2 layers of Lexan each 0.25 mm thick and one layer of aluminum absorber 1 mm thick (see Fig. 2). An special batch of 50 m2 of the total area, was composed of stacks using CR39 containing 0.1% of DOP additive. Each stack was sealed in an aluminized plastic bag (125 m thick) filled with dry air at a pressure of 1 bar. The stacks were deployed under the roof of the Chacaltaya Laboratory, roughly 4 m above ground.
The geomagnetic cut-off for cosmic rays at the detector latitude is . Environmental conditions at the Chacaltaya lab are: atmospheric preassure 0.5 atm; mean temperature , oscillating from 0 to 30; the radon concentration is 4050 . The neutron flux measured with BTI bubble counters at the detector site, in the range from few hundred keV to 20 MeV is (Zanini, 2001).
Etching proceadures and NTD calibrations: The passage of a magnetic monopole in NTDs, such as CR39, causes structural line damage in the polymer (forming the so called “latent track”). Since IMMs have a constant energy loss through the stacks, the subsequent chemical etching should result in collinear etch-pit cones of equal size on both faces of each detector sheet. In order to increase the detector “signal to noise” ratio different etching conditions (Cecchini, 2001; Balestra, 2007; Togo 2008) were defined. The so-called “strong etching” technique produce better surface quality and larger post-etched cones. This makes etch pits easier to detect under visual scanning. Strong etching was used to analyze the top-most CR39 sheet in each module. “Soft etching” was applied to the other CR39 layers in a module if a candidate track was found after the first scan.
For CR39 and CR39(DOP) the strong etching conditions were: 8N KOH +
1.5% ethyl alcohol at 75 ∘C for 30 hours. The bulk etching velocities
were m/h and for
CR39 and CR39(DOP), respectively. The soft etching conditions were 6N
NaOH + 1% ethyl alcohol at 70 ∘C for 40 hours for CR39 and
CR39(DOP). The bulk etching rates were and for CR39 and
CR39(DOP), respectively. Makrofol NTDs were etched in 6N KOH + 20%
ethyl alcohol at 50 ∘C for 10 hours; the bulk etch velocity was
m/h.
NTD Calibrations:

The CR39 and Makrofol nuclear track detectors were calibrated with 158 A GeV In49+ and Pb82+ beams at the CERN SPS and 1 A GeV Fe26+ at the AGS synchroton of the Brookhaven National Laboratory (BNL). The calibration layout was a standard one with a fragmentation target and CR39 (plus Makrofol) NTDs in front and behind the target (Cecchini, 2008).The detector sheets behind the target detected both primary ions and nuclear fragments.
We recall that the formation of etch-pit cones (“tracks”) in NTDs is regulated by the bulk etching rate, , and the track etching rate, , i.e. the velocities at which the undamaged and damaged materials (along the particle trajectory), are etched out. Etch-pit cones are formed if . The response of the CR39 detector is measured by the etching rate ratio .

In the calibration procedure, the track’s area of each fragment and survival beam ions are measured, and the of each resolved peak is identified via the average measured base areas.
For each calibration peak the is obtained and the reduced etch rate is computed. The Restricted Energy Loss (REL) due to ionization and nuclear scattering is evaluated, thus arriving to the calibration curve vs. REL. Fig. 3 and 4 shows the cases for both strong and soft etching conditions of the CR39 and CR39 with DOP, respectively. The detection thresholds are listed in table 1.
| detector type | |||
|---|---|---|---|
| [MeVcm2/g] | |||
| strong | CR39 | 14 | 200 |
| CR39 DOP | 21 | 460 | |
| Makrofol | 50 | 2500 | |
| soft | CR39 | 7 | 50 |
| CR39 DOP | 13 | 170 |
For magnetic monopoles with we computed the REL as a function of taking into account electronic and nuclear energy losses, see Fig. 5 (Derkaoui, 1999).

With the used etching conditions, the CR39 allows the detection of MMs with for and for ; MMs with for around and for ; the whole -range of is accessible for MMs with and for dyons.
For the Makrofol polycarbonate the detection threshold is at and REL GeV cm2 g-1 (Balestra, 2007);for this reason the use of Makrofol is restricted to the search for fast MMs.
Neutron induced background: A statistical study of the background tracks in the top-most CR39 layer, generated only by neutrons was made using Monte Carlo (MC) simulations. The neutron spectrum measured at the SLIM site is shown in Fig.6, plotted as the intensity times the energy of the neutrons vs. their energy (Zanini, 2001), was used in the simulations.

The CR39 polymer was defined by its chemical formula, its density and its post-etched (strong etching conditions) dimensions (Medinaceli, 2008).
For the exposure time, the total number of neutrons impinging on the detector was calculated, and the relative abundances of secondary particles generated inside the CR39 was obtained. Fig. 7 shows the relative abundance of each kind of secondary particle, obtained as the ratio of the number of particles of one specie to the total number of secondaries. The most abundant particles produced are protons, with a relative abundance of the 52.4%, then isotopes (12.5%), -particles (9.5%), secondary neutrons (9.3%), isotopes (8.5%), and particles (2%). The other species quoted on the plot contribute for less than 1%. The most important mechanism for neutron interaction is elastic scattering with the constituent elements of CR39 (H, C, O). Inelastic scattering is the second most frequent process that neutrons undergo; by-products of this mechanism are and particles.

A fraction of the 89% of the secondary protons have a REL
distribution with values over the detector threshold (considering the
obtained for strong etching). All the ,
ions and -particles have REL values over the
value; this implies that all such particles are detectable
by the SLIM detectors, neutrons mainly contribute to the surface
background found on the top-most layer of CR39.
Analysis:
The analysis of a SLIM module started by etching the uppermost CR39 sheet
using strong conditions in order to reduce the CR39 thickness from
1.4 mm to mm. After the strong etching, the CR39 sheet was scanned
twice, with a stereo microscope, by different operators,
with a 3 magnification optical lens, looking for any possible
correspondence of etch pits on the two opposite surfaces. The measured
single scan efficiency was about 99%; thus the double scan guarantees an
efficiency of for finding a possible signal.
Further observation of a “suspicious correspondence” was made with an optical stereo microscope and classified either as a defect or a candidate track. This latter was then examined by an optical microscope with magnification and the axes of the base-cone ellipses in the front and back sides were measured. A track was defined as a “candidate” if the computed and incident angle on the front and back sides were equal to within 20%. For each candidate the azimuth angle and its position referred to the fiducial marks were also determined. The uncertainties , , (the error associated to the depth of the lower-most layer of CR39) and defined a “coincidence” area ( cm2) around the candidate expected position in the other layers, as shown in Fig. 8. In this case the lowermost CR39 layer was etched in soft etching conditions, and an accurate scan under an optical microscope with high magnification (500 or 1000) was performed in a square region around the candidate expected position, which included the “coincidence” area. If a two-fold coincidence was detected, the CR39 middle layer was also analyzed.

3 Results
Since no candidates were found, the 90% C.L. upper limit for a downgoing flux of IMMs and for dyons was computed as
where is the mean exposure time (4.22 y), is the total acceptance, is the scanning efficiency estimated to be .
The global 90% C.L. upper limits for the flux of downgoing IMMs and dyons with velocities were computed, the complete dependence with is shown in Fig. 9. The flux limit for is cm-2 s-1 sr-1.

Acknowledgements
We acknowledge the collaboration of E. Bottazzi, L. Degli Esposti and G. Grandi of INFN Bologna and the technical staff of the Chacaltaya Laboratory. We thank INFN and ICTP for providing grants for non-italian citizens.
References
- [1] Ambrosio M. et al., 2002. Eur. Phys. J C25, 511. Ambrosio M. et al., 2002. Eur. Phys. J C26, 163.
- [2] Dirac P.A.M., 1931. Proc. R. Soc. London 133,p60; Phys. Rev. 74(1948)817.
- [3] Bakari D. et al., 2000. hep-ex/0003028; Cecchini S. et al., 2001. Il Nuovo Cimento 24C,639.
- [4] Balestra S. et al., 2008. Eur. Phys. J. C55, p57-63.
- [5] Balestra S. et al., 2007. Nucl. Instrum. Meth. B254, 254; Manzoor S. et al., 2005. Radiat. Meas. 40, 433; Nucl. Phys. B Proc. Suppl. 172, (2007) 296; Giacomelli G. et al., 1998. Nucl. Instrum. Meth. A411, 41.
- [6] Cecchini S. et al., 2001. Radiat. Meas. 34, 55.
- [7] Cecchini S. et al., 2008. Nucl.Phys. A807, 206.
- [8] Coleman S., 1985. Nucl. Phys.B262, 293; Kusenko A. and Shaposhnikov A., 1998. Phys. Lett. B418, 46.
- [9] Derkaoui J. et al., 1999. Astrop. Phys.10, 339.
- [10] Giacomelli G. et al., 2000. hep-ex/0005041.
- [11] Giacomelli G., Manzoor S., Medinaceli E., Patrizii L., 2007. arXiv:hep-ex/0720502v2.
- [12] Medinaceli E., 2008. Ph.D. Thesis, Univ. of Bologna.
- [13] Schraube H. et al., 1999. Rad. Prot. Dos. 84, 309; Zanini A. et al., 2001. Il Nuovo Cim.24C, 691.
- [14] Sahnoun Z., 2008. arXiv:0805.1797v1; Sahnoun Z. these proceedings.
- [15] Togo V. and I. Traore, these proceedings; Balestra S. et al., 2007. NIM B254, 254.
- [16] Witten E., 1984. Phys. Rev. D30, 272; De Rujula A. and Glashow S., 1984. Nature 31, 272.