IPPP/08/78
DCPT/08/156
August 24, 2026
Checking formalism for central exclusive production in the first LHC runs11 1 Based on a talk by A.D. Martin at the CERN - DESY Workshop ”HERA and the LHC”, 26 - 30 May 2008, CERN.
V.A. Khozea,b, A.D. Martina and M.G. Ryskina,b
a Institute for Particle Physics Phenomenology, University of Durham, Durham, DH1 3LE
b Petersburg Nuclear Physics Institute, Gatchina, St. Petersburg, 188300, Russia
We discuss how the early LHC data runs can provide crucial tests of the formalism used to predict the cross sections of central exclusive production.
1 Introduction
The physics potential of forward proton tagging at the LHC has attracted much attention in the last years, for instance, [1] - [5]. The combined detection of both outgoing protons and the centrally produced system gives access to a unique rich programme of studies in QCD, electroweak and BSM physics. Importantly, these measurements will provide valuable information on the Higgs sector of MSSM and other popular BSM scenarios, see [6] - [9].


The theoretical formalism [10] - [12] for the description of a central exclusive production (CEP) process contains quite distinct parts, shown symbolically in Fig. 2. We first have to calculate the subprocess, , convoluted with the gluon distributions . Next, we must account for the QCD corrections which reflect the absence of additional radiation in the hard subprocess – that is, for the Sudakov factor . Finally, we must enter soft physics to calculate the survival probability of the rapidity gaps (RG) .
The uncertainties of the CEP predictions are potentially not small. Therefore, it is important to perform checks using processes that will be accessible in the first LHC runs [13]. We first consider measurements which do not rely on proton tagging and can be performed through the detection of RG.
The main uncertainties of the CEP predictions are associated with
- (i)
the probability that additional secondaries will not populate the gaps;
- (ii)
the probability to find the appropriate gluons, that are given by generalized, unintegrated distributions ;
- (iii)
the higher order QCD corrections to the hard subprocess, in particular, the Sudakov suppression;
- (iv)
2 Gap survival factor
Usually, the gap survival is calculated within a multichannel eikonal approach [16]. The probability of elastic rescattering, shown symbolically by in Fig. 2 can be evaluated in a model independent way once the elastic cross section is measured at the LHC. However, there may be excited states between the blob and the amplitude on the r.h.s of Fig. 2. The presence of such states enlarges absorption. To check experimentally the role of this effect, we need a process with a bare cross section that can be reliably calculated. Good candidates are the production of or bosons with RGs [13]. In the case of ‘+gaps’ production the main contribution comes from the diagram of Fig. 2(a) [17]. One gap, , is associated with photon exchange, while the other, , is associated with the . In the early LHC data runs the ratio (+gaps/ inclusive) will be measured first. This measurement is a useful check of the models for soft rescattering [13].
A good way to study the low impact parameter () region is to observe boson production via fusion, see Fig. 2(c). Here, both gaps originate from -exchange, and the corresponding region is similar to that for exclusive Higgs production. The expected +gaps cross section is of the order of 0.2 pb, and =0.3 for and for quark jets with GeV [18].
3 Generalized, unintegrated gluon distribution
The cross section for the CEP of a system essentially has the form [10]
| (1) |
Here the factor arises from the integration over the proton transverse momentum. Also, denotes the generalized, unintegrated gluon distribution. In our case the distribution can be obtained from the conventional gluon distribution, , known from the global parton analyses. The main uncertainty here comes from the lack of knowledge of the integrated gluon distribution at low and small scales. For example, taking we find [13] . These are big uncertainties bearing in mind that the CEP cross section depends on .
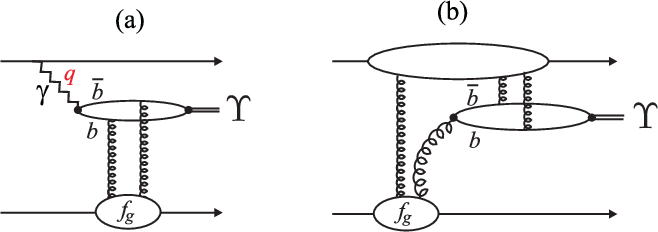
To reduce the uncertainty associated with we can measure exclusive production. The process is shown in Fig. 3(a). The cross section for is given in terms of the same unintegrated gluon distribution that occurs in Fig. 2. There may be competition between production via photon exchange, Fig. 3(a), and via odderon exchange, see Fig. 3(b). A lowest-order calculation (e.g.[19] ) indicates that the odderon process (b) may be comparable to the photon-initiated process (a). If the upper proton is tagged, it will be straightforward to separate the two mechanisms.
4 Three-jet events as a probe of the Sudakov factor
The search for the exclusive dijets at the Tevatron, , is performed [20] by plotting the cross section in terms of the variable , where is the mass of the whole central system. However, the distribution is smeared out by QCD radiation, hadronization, the jet algorithm and other experimental effects [20, 21]. To weaken the smearing it was proposed in Ref. [21] to study the dijets in terms of a variable , where only the transverse energy and the rapidity of the jet with the largest enter. Here , where is the rapidity of the central system. Clearly, the largest jet is less affected by the smearing. As shown in [13], it is sufficient to consider the emission of a third jet, when we take all three jets to lie in a specified rapidity interval . The cross section , as a function of , for the production of a pair of high dijets accompanied by a third jet is discussed in [21, 13]. It is shown that the measurements of the exclusive two- and three-jet cross sections as a function of of the highest jet allow a detailed check of the Sudakov physics; with much more information coming from the dependence study. A clear way to observe the Sudakov suppression is just to measure the dependence of exclusive dijet production. On dimensional grounds we would expect . This behaviour is modified by the gluon anomalous dimension and by a stronger Sudakov suppression with increasing . Already the existing CDF dijet data [20] exclude predictions which omit the Sudakov effect.
5 Soft-hard factorization: enhanced absorptive effects

The soft-hard factorization implied by Fig. 2 could be violated by the so-called enhanced Reggeon diagrams, see Fig. 4(a). The contribution of the first Pomeron loop, Fig. 4(b) was calculated in pQCD in Ref. [15]. A typical diagram is shown in Fig. 4(c). For LHC energies it was found that such effect may be numerically large. The reason is that the gluon density grows at low and, for low partons, approaches the saturation limit. However, as discussed in [13], the enhanced diagram should affect mainly the very beginning of the QCD evolution – the region that cannot be described perturbatively and which, in [11, 12], is already included phenomenologically.
Experimentally, we can study the role of semi-enhanced absorption by measuring the ratio of diffractive event rate for (or or dijet) as compared to the inclusive process [13]. That is
| (2) |
where and are the parton densities determined from the global analyses of inclusive and diffractive DIS data, respectively. We can measure a double distribution , and form the ratio using the inclusive cross section, . If we neglect the enhanced absorption, it is quite straightforward to calculate the ratio of (2). The results for a dijet case are shown by the dashed curves in Fig. 6 as a function of the rapidity of the dijet system. The enhanced rescattering reduce the ratios and lead to steeper distributions, as illustrated by the continuous curves.


Perhaps the most informative probe of is to observe the ratio for dijet production in the region GeV. For example, for 15 GeV we expect 0.25, 0.4 and 0.8 at and respectively.
6 Conclusion
The addition of forward proton detectors to LHC experiments will add unique capabilities to the existing LHC experimental programme. For certain BSM scenarios, the tagged-proton mode may even be the discovery channel. There is also a rich QCD, electroweak, and more exotic physics, menu.
The uncertainties in the prediction of the CEP processes are potentially not small. Therefore, it is crucial to perform checks of the theoretical formalism using reactions that will be experimentally accessible in the first LHC runs [13].
Most of the measurements discussed above can be performed, without detecting the protons, by taking advantage of the relatively low luminosity in the early LHC runs. When the forward proton detectors are operating much more can be done. First, it is possible to measure directly the cross section for single diffractive dissociation and also the cross section for soft central diffractive production. These measurements will strongly constrain the models used to describe diffractive processes and the effects of soft rescattering. The recent predictions can be found in [12]. For illustration we show in Fig. 6 the expectation for , see for details [12]. Next, a study of the transverse momentum distributions of both of the tagged protons, and the correlations between their momenta, is able to scan the proton optical density [17, 22].
References
- [1] V.A. Khoze, A.D. Martin and M.G. Ryskin, Eur. Phys. J. C23, 311 (2002).
- [2] A. De Roeck et al., Eur. Phys. J. C25, 391(2002).
- [3] J. Forshaw and A. Pilkington, In *Hamburg 2007, Blois07, Forward physics and QCD* 130-136.
- [4] M. G. Albrow et al. [FP420 R and D Collaboration], arXiv:0806.0302 [hep-ex].
- [5] P. J. Bussey, arXiv:0809.1335 [hep-ex].
- [6] A.B. Kaidalov et al., Eur. Phys. J. C33, 261 (2004).
- [7] S. Heinemeyer et al.,Eur. Phys. J. C53, 231 (2008).
- [8] B. Cox, F. Loebinger and A. Pilkington, JHEP 0710, 090 (2007).
- [9] J. R. Forshaw et al., JHEP 0804, 090 (2008).
- [10] V.A. Khoze, A.D. Martin and M.G. Ryskin, Eur. Phys. J. C14, 525 (2000).
- [11] V.A. Khoze, A.D. Martin and M.G. Ryskin, Eur. Phys. J. C18, 167 (2000).
- [12] M.G. Ryskin, A.D. Martin and V.A. Khoze, Eur. Phys. J. C54, 199 (2008); E.G.S. Luna et al.,arXiv:0807.4115 [hep-ph].
- [13] V.A. Khoze, A.D. Martin and M.G. Ryskin, Eur. Phys. J. C 55, 363 (2008).
- [14] A.B. Kaidalov et al., Eur. Phys. J. C21, 521 (2001).
- [15] J. Bartels et al., Phys. Rev. D73, 093004 (2006).
- [16] For a review see: E. Gotsman et al., arXiv:hep-ph/0511060.
- [17] V.A. Khoze, A.D. Martin and M.G. Ryskin, Eur. Phys. J. C24, 459 (2002).
- [18] V.A. Khoze et al., Eur. Phys. J. C26, 429 (2003).
- [19] A. Bzdak et al., Phys. Rev. D75, 094023 (2007).
- [20] T. Aaltonen et al. [CDF Run II Collaboration], Phys. Rev. D 77, 052004 (2008).
- [21] V.A. Khoze, A.D. Martin and M.G. Ryskin, Eur. Phys. J. C48, 467 (2006).
- [22] V.A. Khoze, A.D. Martin and M.G. Ryskin, Eur. Phys. J.C24, 581 (2002).