Are the kinematics of DLAs in agreement with their arising in the gas disks of galaxies?Note: AJ, in press
Abstract
We demonstrate in this paper that the velocity widths of the neutral gas in Damped Ly (DLA) systems are inconsistent with these systems originating in gas disks of galaxies similar to those seen in the local universe. We examine the gas kinematics of local galaxies using the high quality H i 21-cm data from the H i Nearby Galaxies Survey (THINGS) and make a comparison with the velocity profiles measured in the low-ionization metal lines observed in DLAs at high redshifts. The median velocity width of H i gas above the DLA column density limit of is approximately 30 , whereas the typical value in DLAs is a factor of two higher. We argue that the gas kinematics at higher redshifts are increasingly influenced by gas that is not participating in ordered rotation in cold disks, but is more likely associated with tidal gas related to galaxy interactions or processes such as superwinds and outflows. An analysis of the H i in the local interacting star-burst galaxy M82 shows that the velocity widths in this galaxy are indeed similar to what is seen in DLAs.
Subject headings
galaxies: ISM — ISM: evolution — ISM: kinematics and dynamics — radio lines: ISM — galaxies: statistics — quasars: absorption linesI. Introduction
Until the next generation of large radio telescopes systematically detects the 21-cm hyperfine line of neutral, atomic hydrogen (H i) in emission at redshifts beyond , our knowledge of the H i at high redshift will remain solely dependent on the study of absorption-line spectra of high redshift quasars. These spectra are dominated by Ly absorption lines originating in intervening H i clouds, and show a large range in H i column density. The systems with the largest column densities, termed Damped Ly Absorbers [72, DLAs;], are characterized by and are known to hold most of the H i atoms in the universe, at all redshifts [41, 79, cf.]. A popular explanation is that the DLAs are the progenitors of gas disks in present-day galaxies [71].
At it is well established that most of the H i atoms are locked up in the gas disks of -type galaxies [78]. These H i disks show an frequency distribution of H i column densities [] that is virtually identical in shape to that of the DLAs [53, 79, 44]. Furthermore, at redshifts there are approximately 20 identifications of galaxies giving rise to DLA absorption in spectra of background quasars [24, 57, 61, 6, 48, 23]. The properties of these galaxies (such as luminosities and impact parameters) are fully consistent with the idea that the DLAs arise in galaxies that are typical in the local universe [79]. Also the metallicities seen in low redshift DLAs are fully consistent with what is expected when gas disks of galaxies are intercepted randomly. Therefore, DLAs at low redshifts () probably arise in gas disks of galaxies like those seen in the local universe.
At higher redshifts () the situation becomes more complicated. Direct detection of DLA host galaxies has proven to be extremely difficult [see e.g., 35, 33, and references therein]. This may not be surprising if at these epochs the DLAs also arise in gas disks of normal spiral galaxies: the cross-section selection ensures that a large fraction of the DLA galaxies is fainter than , and thus difficult to detect [14, 79]. The shape of the column density distribution function, , at these redshifts is still consistent with what is seen at . Although this is consistent with the galaxy disk model, it is inconclusive evidence for this model. It is conceivable that the shape of is determined by rather simple physics, for example ionization at low column densities and H2 formation at high densities. This might produce the same at all redshifts, regardless of whether this gas is distributed in ordered disks or not.
Other observations of high- DLAs are also inconclusive [see 71, for a comprehensive review]. The inferred cosmic star formation rate density from DLAs is consistent with that measured from Lyman Break Galaxies [70]. However, metallicities of the DLAs are typically low [42, e.g.,], as are the molecular fractions [26, e.g.,], and analyses of elemental abundances show star formation histories typical of those of quiescent galaxies [9].
Perhaps one of the most conclusive tests of whether DLAs at high redshift arise in gas disks or not, can be made by studying their kinematics. The first work on this topic was presented by [46], who compiled high resolution, high signal-to-noise spectra of low-ionisation metal lines in DLAs, and compared them with the velocity profiles derived from simulations using model ensembles of artifical clouds with a range of velocities. They concluded that rapidly rotating thick disks are the most likely hosts of DLAs. This conclusion was contested by Haehnelt et al. [16], who showed that irregular protogalactic clumps can reproduce the absorption line properties of DLAs equally well. A direct comparison with 21-cm data of local galaxies was first made by Prochaska et al. [45], who found that low mass galaxies such as the Large Magellanic Cloud (LMC) display much lower velocity widths than normally seen in DLAs.
A fair comparison with DLA kinematics can only be made by studying a representative sample of local galaxies for which high quality 21-cm data cubes exist, and which have high spatial and frequency resolution and low H i column density limits. In this paper we make use of the THINGS [67, The H i Nearby Galaxy Survey;] data, which are ideal for this purpose.
It is important to note that the Ly lines that define the DLA carry little information on the kinematics of the absorbing systems themselves. The velocity width that would correspond to the total extent of the damping wings is much larger than the physical velocity width corresponding to the turbulence or large scale movements of the gas; any structure in the velocity distribution of the H i gas is completely washed out by the damping wings. Instead, workers in this field rely on low-ionization metal lines, such as Fe+, Si+, Ni+, which are believed to be good tracers of the neutral gas [46, e.g.,]. In the same system each of these transitions gives consistent velocity widths, as long as the lines are unsaturated. In principle, many small clouds in the outskirts of galaxy halos could contribute to the total velocity profile measured in these low-ionization lines. However, the parameter that we use to characterize the velocity width, (the velocity width that encompasses the central 90% of the total optical depth seen in the line) ensures that these low column density clouds do not contribute to the total width.
In section II we describe our strategy and data, in section III we present the results, and in section IV we discuss these results. Finally, we present the conclusions section V. Throughout this paper we use a value for the Hubble constant of , although the distances to some of the THINGS galaxies are derived using direct distance measurements.
II. The approach
For a quantitative comparison between the kinematics of DLAs and local galaxies, high quality 21-cm maps are required that are characterized by high signal to noise and high spatial and velocity resolution. A low noise level is required to sample all regions of the gas disks above the DLA column density limit of . A high spatial resolution is needed to avoid severe overestimation of the velocity profiles due to spatial smoothing [52, see]. Since for aperture synthesis interferometry the noise level (measured as the minimal detectable H i column density per beam) scales with the inverse of the beam area, these two requirements are very difficult to meet. The THINGS sample is currently the only sample with sufficient spatial resolution and depth, and contains a large enough number of galaxies such that the local universe galaxy population can be sampled representatively.
II.1. THINGS
We base our analysis on VLA observations of a sample of nearby galaxies drawn from THINGS: The HI Nearby Galaxy Survey [67]. THINGS provides high angular and velocity resolution data of uniform quality for 34 galaxies spanning a range of Hubble types, from dwarf irregular galaxies to massive spirals. The sample selection is mainly drawn from the Spitzer Infrared Nearby Galaxy Survey [20, SINGS,] but excludes targets with distances 15 Mpc, and elliptical galaxies. In addition, edge–on galaxies have been excluded. The observations and data reduction are discussed in detail in Walter et al. [67]. For our analysis, we use the robust-weighted data cubes, which produce typical beam sizes of (or 200 pc for the mean distance of 6.5 Mpc to our sample galaxies). We choose the robust-weighted data cubes in order to achieve the highest possible spatial resolution, which is required for making a comparison to DLA velocity profiles, which are measured along very narrow sight-lines to background quasars. The velocity resolution in all cases is equal or better than 5.2 (which we will smooth further, see below). Typical column density sensitivities are in the integrated H i maps/profiles, i.e., much below the DLA column density limit () discussed in this paper.
The different distances among the galaxies in the sample cause the beam to trace different physical scales within galaxies. As discussed in section II.3, beam smearing causes some increase in the measured velocity widths. Therefore, for the most distant galaxies the velocity width measurements are increased somewhat more than for the nearby ones. However, as we will see, this does not affect our main conclusions.
II.2. Biases in the THINGS sample
The THINGS sample is composed of galaxies from optical catalogues, whereas DLA systems are purely H i-selected. [see 67, for a discussion on the selection of THINGS targets]. However, in Zwaan et al. [79] it was argued that this optical selection does not lead to any biases for this application. The main argument is the following: Zwaan [76] has shown that the properties of H i-selected galaxies are not different from those of optically selected galaxies if compared at the same luminosity. Therefore, if the weighting of the sample is properly taken into account (using the luminosity function or H i mass function) no strong biases should be introduced by using optically selected galaxies. This fact is also corroborated by the calculation of Ryan-Weber et al. [53], who showed that the redshift number density calculated from H i-selected nearby galaxies is consistent with the values presented in Zwaan et al. [79] and in the present paper.
Another consideration is the distribution of inclinations of the THINGS sample. Ideally, the galaxies should be randomly oriented, that is, the distribution of should be consistent with a flat distribution. In practice, however, given the selection discussed in section II.1, the sample has a minor deficiency of edge-on galaxies. A Kolmogorov-Smirnov test shows that the null-hypothesis that the inclination distribution is consistent with being random can only be rejected at the 19% level. Because of projection effects, the most inclined galaxies have H i column densities and measurements at the high end of the total distribution of these values in the THINGS sample. On the other hand, the cross-section in highly inclined galaxies is very small, meaning that the fractional contribution of these galaxies to the total count of high column densities and high values is minor. If we assume that THINGS misses all galaxies with inclinations greater than , this would lead to a total incompleteness in the number of galaxies of % (assuming infinitely thin disks). However, since the area of a disk scales as , the total area missed in these highly inclined galaxies is only 3%. We conclude that the contribution from the missing highly inclined galaxies to the DLA cross-section is not a significant concern for this analysis.
II.3. Beam Smearing
If the kinematics of the H i change on spatial scales smaller than the beam size, measurement of the gas properties are subject to systematic uncertainties. This effect is known as beam smearing. Ryan-Weber et al. [52] demonstrate that decreasing the spatial resolution of 21-cm data systematically increases the measured median . This result was established by convolving a high resolution H i data cube of the Large Magellanic Cloud (LMC) with Gaussian beams of various widths to simulate data with different spatial resolutions. The increase in with beam width can be understood in terms of including adjacent pockets of gas that are offset in velocity. The resulting velocity width measurement of the total area will be greater than the values of the individual H i clouds. The LMC data has a physical resolution of 15 pc beam-1 and a velocity resolution of 1.6 . In comparison, the mean physical resolution of THINGS is 200 pc. Given this factor of difference in physical resolution, and employing the same technique used by Ryan-Weber et al. [52], we estimate that the THINGS velocity width measurements could be overstated by 40%. Despite this expectation of an increase, the velocity dispersion and measurements from the LMC and THINGS data are similar. Specifically, the distribution of velocity dispersion values in the LMC peaks at 6 , wheras values derived from the THINGS galaxies range from 6 to 10 , i.e. not larger in all lines-of-sight. Thus, we conclude that beam smearing may have a mild effect on the THINGS data, but is unlikely to cause a major systematic shift in the measured values. Of course the physical scales sampled by the highest resolution 21-cm measurements are still larger than those probed by QSO lines-of-sight. In any case, as we will see in Section III, if we have overestimated the velocity widths of galaxies at using the THINGS data this would imply an even stronger discrepancy between the true low redshift velocity widths and the high redshift values of in DLAs.
II.4. The column density distribution function
We have argued that THINGS provides the most suitable sample of 21-cm data cubes of nearby galaxies to perform the kinematic analysis. However, the number of galaxies in this sample is an order of magnitude smaller than the WHISP11 1 The Westerbork H i survey of Spiral and Irregular galaxies [62] is an H i survey of 355 galaxies carried out with the Westerbork Synthesis Radio Telescope. sample used in Zwaan et al. [79], which provides a very accurate measurement of the local H i column density distribution function .
To test whether the THINGS sample contains biases in the H i column densities it samples, we first calculate the H i column density distribution function . This function is defined such that is the number of systems with column density between and over a distance interval . We use the method described by Zwaan et al. [79], where is calculated as follows:
| (1) |
Here, is the space density of galaxy , measured via the H i mass function. For the H i mass function we adopt the most recent HIPASS measurement as published by Zwaan et al. [77]. The function is a weighting function that takes into account the varying number of galaxies across the full range of , and is calculated by taking the reciprocal of the number of galaxies in the range to , where is taken in this case to be 0.35 dex. ) is the area function that describes for galaxy the area in corresponding to a column density in the range to . In practice, this area function is simply calculated by summing for each galaxy the number of pixels in a certain range multiplied by the physical area of a pixel. Finally, converts the number of systems per Mpc to that per unit redshift.
Figure 1 shows the resulting column density distribution function measured from the THINGS data (solid points), compared to the one published by Zwaan et al. [79] based on the WSRT maps of the WHISP sample (open points). Given the different sample definitions of THINGS and WHISP and the different resolutions achieved in both surveys, there is a remarkable agreement between the two data sets, reaffirming our earlier conclusion that selection effects are not an important issue for the THINGS sample, and thus that this sample is well suited for this kind of analysis. Note that we only calculated the points above the DLA column density limit of (corresponding to ), since this is the limit we apply for our kinematic analyses. In principle, the THINGS H i column density sensitivity would allow us to calculate down to much lower values.
Some differences between the two samples can be seen at high column densities, above . This is due to the dearth of high inclination galaxies in THINGS. Although the effect shows up clearly in the logarithmic representation of , we showed in section II.2 that the effect of missing edge-on galaxies on the total H i cross section and on the calculation is not important for this analysis.


The zeroth moment of gives the redshift number density of gas above the DLA H i column density threshold in the universe. This quantity simply represents the number of encounters with H i gas above the DLA limit that a hypothetical observer would have if they were traveling through the local universe for a total path length of . From the THINGS sample we find , compared to from the WHISP analysis, which again is in excellent agreement.
II.5. The velocity widths
The standard metric used in DLA studies to characterize the profile width of metal absorption lines is , the velocity width that encompasses the central 90% of the total optical depth seen in the line. This definition assures that weak velocity components that are not good tracers of the large-scale velocity field, as well as statistical fluctuations, are not taken into account. In practice, is calculated by taking the cumulative optical depth distribution, and finding the velocities at which this distribution crosses the 5% and 95% levels. In DLA studies, the data used for this analysis are normally limited to those with high signal to noise, where the peak optical depth exceeds . These spectra are mostly products of the High Resolution Echelle Spectrometer (HIRES) on the Keck telescope and the Ultraviolet and Visual Echelle Spectrograph (UVES) on the Very Large Telescope (VLT). This signal-to-noise level is calculated on smoothed spectra with typical velocity resolutions of 15 to 20 .
In order to make an equitable comparison, we first smooth the THINGS data cubes in velocity with a boxcar filter, to a velocity resolution of approximately 15 to 20 , varying slightly from cube to cube, depending on the original channel width. Next, we calculate normalized cumulative velocity profiles at every spatial pixel in the cube. Using the same strategy as defined above (just cutting the distribution at the 5% and 95% levels) does not give good results, because for the lower column densities the H i data typically possess lower S/N than the optical spectra (of which only the highest S/N examples are regarded). Therefore, the cumulative distribution can cross these levels several times, leaving us with no unique definition of . To avoid this problem, we first identify the 50% level and travel outward in both directions to find the first instance where the 5% and 95% levels are crossed. The difference between the two velocities at which this happens is then defined as . In principle, this method could cause an underestimation of , but tests with synthetic spectra show that this effect is minimal.
Figure 2 shows four examples of the calculations for the THINGS galaxies. We choose to show the nearly face-on barred spiral NGC 925, the M81-group member NGC 3077 know for its extended tidal HI, the isolated nearly edge-on early-type spiral NGC 2841, and the barred nuclear starburst galaxy NGC 2903. The top row of panels shows the H i column density distribution for these galaxies. The bottom row of panels shows the distribution of over the regions of these galaxies where the H i column densities exceed the DLA threshold of . The black regions are those where exceeds 100 . The black spots that can be seen for example in the northern and southern outskirts of NGC 2903 are due to noisy spectra, where the calculation is unreliable. In NGC 2841, the extended dark regions in the map are associated with high regions and indicate true high values of .
Examples of velocity profiles through THINGS galaxies are shown in Figure 3. We chose 25 random profiles, with values between 31 and 165 . This figure gives an idea of quality of the THINGS data and the accuracy of the measurements. The shaded areas correspond to the inner 90% of the optical depth and define the measurement of . The number in the upper left corner of each panel shows the value of for each profile. To indicate the reliability of our method for determining by using the first crossing of the 5% and 95% levels from the center, we also show in parenthesis the values of based on the second crossing of these levels. For most profiles, the cumulative distribution crosses the 5% and 95% levels only once, in which case the definition of is unique. In the few cases where the profiles are more noisy and a second crossing occurs, it is clear that the measurements based on the first crossings are superior; measurements based on the second crossing clearly overestimate . These example profiles show that our method of determining is accurate and not introducing a significant bias.

II.6. Do low ionization metal lines trace only the neutral gas?
Before presenting the results, we would like to come back to the statement made in the introduction that low ionization metal lines such as Fe+, Si+, Ni+ trace the neutral gas only. The fundamental premise of this paper is that these lines trace the kinematics of the high column density neutral gas, and can therefore be compared directly to local 21-cm measurements.
It is well established that approximately 25% of a spiral galaxy’s hydrogen mass is in a layer of ionized gas, known as the diffuse ionized gas [50, DIG, e.g.]. The scale height of this gas is 0.9 kpc in the Milky Way Galaxy, much larger than that of the neutral gas seen in 21-cm. If a large fraction of the optical depth seen in low-ionization lines observed in DLAs would arise in such a medium, our results might be biased because this medium does not contribute to the profile of the H i 21-cm line.
Sembach et al. [55] present model calculations of ionization corrections in the DIG of the Milky Way, and conclude that elemental abundances in ionized gases might be biased without significant ionization corrections. However, much more relevant in the context of the present paper are studies directed at DLAs specifically since our concern is whether the ionized gas influences the low-ionization metal line measurements of DLA profiles. A main motivation for such studies of ionization effects in DLAs is the observation that Al+2 is present in DLAs with the same radial velocity distribution as that of low ionization lines [30]. However, the results of e.g., Viegas [63], Vladilo et al. [64] and Lopez et al. [29] show conclusively that ionization effect corrections for low-ionization lines observed in DLAs are negligible. The direct implication of this is that the velocity width measured in low-ionization lines is not affected significantly by an ionized medium. For systems below the DLA H i column density limit, the situation might be very different [8], but these are not considered in the present analysis.
III. Results
We first use the THINGS data to calculate the probability distribution function of the velocity width of galaxies responsible for high column density H i absorption at . This function defines the number of systems above a certain column density limit that would be encountered along a random 1 Mpc path through the universe, as a function of . The function is calculated by multiplying the cross sectional area of H i as a function of by the space density of galaxies. If DLAs at arise in galaxies similar to those observed in the local universe, this function would describe the expected distribution of values for DLAs. For the details of calculating the probability distribution function we refer to Zwaan et al. [79].
Figure 4 shows the result. The lines show the distributions above column density limits of 20.3, 20.6, 20.9, 21.2, and 21.5, from top to bottom, respectively. For all column densities above the DLA limit of the distribution peaks at , and shows a long tail toward higher values. As one progresses to higher column density cut-offs, the peak of the distribution shifts toward larger values, but the upper tail remains. We will discuss this further in section III.1.

Immediately obvious from this distribution is that the peak in is much lower than what is typically seen in DLAs at higher redshifts. This is illustrated directly in Figure 5, where we show on a linear scale the total probability distribution function of for gas above the DLA limit (as a dashed line), together with the measured distribution of in DLAs at redshifts between and from Prochaska et al. [43]. Note that the dashed line is the same as the top solid line in Figure 4, but now on a linear scale. The shape of the two distributions is very similar – a sharp peak with a high tail – but the location of the peak is approximately a factor two higher for the DLAs than for the local galaxies based on THINGS.
This result reaffirms the conclusions of Prochaska et al. [45], which showed that the gas kinematics in local galaxies are inconsistent with the majority of DLA sightlines. Prochaska et al. [45] concentrated on the gas kinematics of the Large Magellenic Cloud and we have shown that the same conclusion holds if a more representative sample of local galaxies is considered. Whereas the kinematics of H i gas above the DLA limit at is dominated by ordered rotation in cold disks, the velocity fields of DLA systems at high redshifts must be influenced by other physical processes such as outflows, superwinds, and interactions. We discuss this in more detail in section V.

III.1. The relation between and H i column density
It is interesting to investigate how the velocity spread of the H i gas depends on the H i column density range considered. The contours in Figure 6 show the probability distribution of H i cross section in the - plane. The THINGS data were used to calculate the cross sectional area contributed by each element on a fine grid in the - plane. The H i mass function has again been used to assign weights to individual galaxies. The weighting scheme is similar to that used for the calculation of , which is expressed in Equation 1. The points in this figure are the DLA data from Prochaska et al. [43], over the redshift range to .

There are two notable effects visible in this diagram. First, the peak of the distribution occurs at values of around 30 , and increases slowly toward larger H i column densities, as already seen from Figure 4. For Gaussian profiles, the value of =30 translates to a velocity dispersion of , which is a typical value for the gas disks in spiral galaxies. Observationally the line-of-sight velocity dispersion ranges from in the outer parts to in the center [32, 7, 13, e.g.,]. From the THINGS data it is found that the dispersions in the regions away from obvious H i shells is , averaged over the galaxy disks [28]. The increase of toward larger values is consistent with the observation that the H i velocity dispersion in gas disks typically decreases with galactocentric radius [10, 19, e.g.,], and the fact that radial H i column density profiles usually show a decline toward larger radii [5, 1].
The other notable feature in Figure 6 is that the larger values of are mostly associated with the lower column densities. To understand this, we need to investigate further the origin of the high-end tail in the distribution. There are several components contributing to this tail. One of the most obvious contributions is that of pixels near the centers of galaxies, where the gradient in the rotation curve is large. A line of sight through these regions is likely to encounter gas over a large range in velocity. The steepest gradients are seen in earlier type spiral galaxies [38, e.g.,], where typically the H i densities are depressed in the center because of the conversion of H i to molecular hydrogen [73, e.g.,]. These factors combined cause a large contribution of low , high points.
To illustrate that the larger values of are more likely to occur near the centers of galaxies we constructed Figure 7, which shows the probability distribution of H i cross section in the - plane, where is the distance from the center of the galaxy. It is important to note that this diagram is also made in such a way that it represents probabilities for - pairs to occur for random sight-lines through the local universe. Therefore, can be regarded as an “impact parameter”, similar to that defined in QSO absorption line studies as the projected distance between the position of a background quasar and that of the center of a galaxy giving rise to an absorption line. Clearly, there is an upper envelope in the distribution: the maximum seen at any value of the impact parameter decreases toward larger .
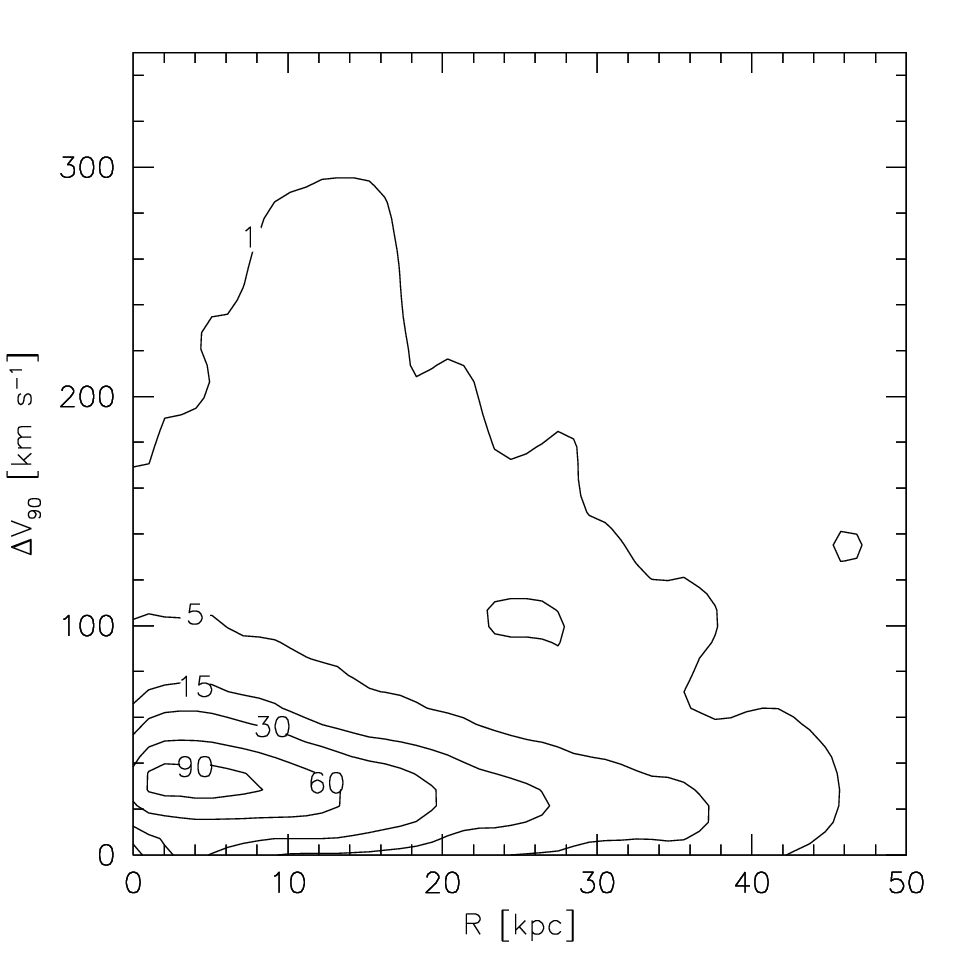
The simple fact that the lower pixels show noisier spectra causes another important contribution of high points. In lower signal-to-noise spectra, noise peaks more easily contribute to the central 90% flux contained in the spectra. This fact can be seen in Figure 3, where we showed random velocity profiles through THINGS galaxies. For the lowest values, the profile is clearly dominated by a single component. For , the profile typically shows two components, or one strong component with a lower flux tail. This continues to be true for even higher profiles, but here irregular profiles seem to get increasingly important.
Comparing the contours and the points in Figure 6, we note that there is some indication for the DLA data to show the same trend as the THINGS local galaxies data: higher values of are more likely to occur at lower H i column densities.
III.2. Qualitative comparison of DLA and galaxy velocity profiles
So far, our analysis has concentrated on the parameter , but it is interesting also to consider the shape of the profiles in more detail. In the previous section we noted that for sightlines where , the profile typically shows two components. In fact, it appears that the individual line components have widths within the main peak of the distribution in Figure 4, and the high - tail is mostly due to line splitting and multiple components.
Interestingly, this same behavior is seen in the metal absorption line profiles of DLAs. For example, Fig 1 of Prochaska & Wolfe [46] shows 17 examples of velocity profiles of low-ionization transitions from DLAs. The narrow profiles are characterized by a single component with , very similar to what we observe in the local universe for most of the sightlines through galaxy disks (cf. Figure 5). For DLA profiles with larger widths, a shoulder or tail becomes progressively more important, and a pronounced second peak starts to separate from the main component for values exceeding . Apparently, the second peak in Figure 5 beyond is mostly due to profiles clearly showing multiple components, whereas the main peak corresponds mostly to profiles displaying a single component with a weaker tail. The profiles with multiple components are seen at as well (see Figure 3), but are very rare. When we consider just the profiles that correspond to the main peaks in Figure 5, we see that at they are mainly symmetric, single component profiles, whereas the DLAs at higher redshift typically show a tail. This characteristic is important for understanding the mechanisms repsonsible for shaping the profiles and will be discussed more in section IV.
III.3. Is a good estimator of galaxy mass?
There is accumulating evidence for the existence of a relation between DLA (and sub-DLA) velocity spread and metallicity at high redshifts [34, 25, 36, 43]. The interpretation of this correlation, assuming that is correlated with mass, is that the well-known luminosity-metallicity relation observed in local galaxies [60, e.g.,] was already in place at redshifts all the way down to . As a proxy for luminosity (or galaxy mass), Ledoux et al. [25] use measurements of . The authors argue that measured in low ionization lines is dominated by motions governed by gravity, irrespective of whether the gas is following the rotation of the galaxy or related to infall or outflow of gas or to merging of galaxy sub-clumps. In principle, a large collection of sightlines through the gaseous regions of galaxies should show a relation between depth of the potential well and .
Only at are we in the situation that we can test whether the assumption that is a statistical measurement of galaxy mass or luminosity is valid. The result is shown in Figure 8. Here we show the conditional probability distribution of as a function of absolute -band magnitude. This figure a created by first calculating the bivariate distribution of cross-section in the , plane, and then normalizing at each the distribution function of cross-section as a function of .
Obviously, the likelihood of finding a high value goes up only marginally toward brighter galaxies: the median does not rise significantly from low luminosity to high luminosity, but for more luminous galaxies the high tail becomes more pronounced. Therefore, in a statistical sense, is a very weak proxy for host galaxy mass. At any absolute magnitude, the median value of is , which for a Gaussian profile translates to a velocity dispersion of 9 .
In conclusion, at the velocity profile measured along a thin line of sight at a random position through a galaxy gas disk is a very weak indicator of the galaxy mass or luminosity. Although we have presently no means of testing this indicator at high redshift, the local relation does not lend much support to the suggestion that the observed –metallicity relation at high redshift can be interpreted as a mass–metallicity relation.

IV. Interpretation
Modeling of DLA velocity profiles already suggested that high redshift DLAs cannot simply arise in rotationally supported cold gas disks such as those observed in local galaxies [46, 16]. ”In this paper we have demonstrated empirically that the typical velocity profiles of H i gas above the DLA limit have lower widths than those seen in DLAs. This result is fully consistent with that of Prochaska et al. [45], based on the analysis of a single low mass galaxy. How can these large velocity widths in DLAs be interpreted?
It is well established that most actively star-forming high-redshift galaxies show large-scale outflows, with velocities of several 100 up to 1000 . Several authors have suggested that these outflows could be related to a large fraction of the DLA cross-section at these redshifts [39, 54]. Nulsen et al. [39] argued that the starburst accompanying the formation of dwarf galaxies blows out most of the available gas, which results in a weakly collimated wind. Once the starburst has subsided, the (largely ionized) ejected gas recombines and shows H i column densities typical of DLAs. Schaye [54] built on these results and showed that the incidence rate of DLAs is in agreement with the wind scenario. He concluded that both disk gas and winds contribute to the high redshift DLAs cross section.
IV.1. H i shells
At , less extreme examples of star-formation driven blow-out can be found in H i shells, which are ubiquitous in high resolution 21-cm maps of nearby galaxies [4, 47, 66, 22, see e.g.]. Radiative and kinematic pressure of stellar winds and supernovae from young massive stars in OB associations are thought to lie at the origin of these expanding shells. Prochaska et al. [44] looked specifically at the issue of whether measurements are affected by these shells in the 30 Doradus region in the LMC. It was found that velocity widths of sight-lines through the H i bubbles were only enhanced by approximately 15 with respect to the average LMC value. This result may not come as a surprise, because the typical expansion velocities of the shells range from 10 to 30 in the LMC [22]. Similar numbers are found for other nearby galaxies [66, e.g.,]. Not only is the velocity width small in shell regions, the area filling factor of H i shells is also small. Prochaska et al. [45] quote a covering factor of % for regions above the DLA limit.
If the physics of supernova feedback at high redshifts is similar to what is seen in local galaxies, the above results imply that H i shells are unlikely to explain the high velocity widths observed in DLAs. In order to explain the kinematics in high- DLAs with outflows, one has to invoke more extreme outflow scenarios, such as that seen in star-burst galaxies.
IV.2. Superwinds and tidal features
To investigate this further, we focus on M82, the prototypical starburst galaxy in the nearby universe. This galaxy displays a well-documented example of the superwind phenomenon, driven by the molecular driven central starburst, which is very prominent in X-ray and H emission [31, 27, e.g.,]. M82 is also a member of the M81 group of galaxies and experiences a strong tidal interaction with its neighbors M81 and NGC 3077 [75, 68]. This interaction results in several H i tidal features in the close vicinity of M82. At a distance of only Mpc, the galaxy can be observed in great detail, and therefore has been the object of studies at wavelengths ranging from the X-rays to the radio [see 11, for references]. Here, we investigate the H i distribution in M82, making use of the original C-array and D-array Very Large Array (VLA) data of Yun et al. [74], augmented with B-array data from the VLA archive. The final H i column density map is very similar to the one published in Taylor et al. [58].

We use the same procedure as described for the THINGS galaxies to calculate values from the M82 data for the regions of the H i gas above the DLA column density limit. Figure 9 shows the distribution of in M82. We find that the median from these data is . Very high values of are seen in the central region over an area of several kpc2. Along the minor axis of M82 these high velocity widths are attributed to interactions of M82’s gaseous medium with the superwind [74]. Interestingly, similarly high velocity widths along the minor axis are observed in CO [58, 68]. The tidal features in M82 also show high velocity widths. The south-west tail that connects up to M81 is not well seen in our map, but the north-east tail shows values around 100 .
Obviously, M82’s high inclination to the line-of-sight () will contribute to the high median observed in this galaxy. However, the gaseous regions in this galaxy that are clearly identified as either tidal features or those related to the superwind display similarly high velocity spreads. As we investigated only a single starburst galaxy it is difficult to draw quantitative conclusions on the basis of these data. However, we argue that M82 clearly demonstrates that the superwind phenomenon and tidal interactions, which are both more frequent at higher redshifts, could go a long way in explaining the high values observed in DLAs. Both winds and tidal features could contribute to the main peak of the DLA distribution in Figure 5, as well as to the high bump.
In this context it is interesting to mention the results of Bouché et al. [3], who find that the equivalent width of MgII absorbers is anti-correlated with the mass of the halo that hosts them. These authors interpret this as evidence that the MgII absorbers are not virialized in the gaseous haloes of the galaxies, but, instead, are produced by superwinds. A fair fraction of these MgII systems are DLAs. Rao et al. [49] showed that 35% of the MgII systems with EW (MgII , FeII ) 0.5 Å have H i column densities above the DLA threshold of .
Additional evidence for a contribution to the DLA cross-section from tidal gas in galaxy groups like M81, comes from the recent observations of a much smaller sample of strong MgII systems by Nestor et al. [37]. These authors find that these very strong intermediate redshift MgII absorption systems often arise in pairs or small groups of galaxies. An estimated 60% of these systems are DLAs. Nestor et al. [37] argues that the likely origin of the high equivalent width MgII absorption is kinematically disturbed gas around interacting galaxies.
The different peaks in the distribution of velocity width in the low and high redshift samples in Figure 5 could be interpreted as being due to an increase in the number of interacting systems with redshift. Gottlöber et al. [15] use N-boby simulations to show that the number of interacting systems (i.e. major mergers) scales as . Thus, we would expect a significant increase in lines-of-sight with large velocity widths at higher redshifts.
IV.3. High velocity clouds
Haehnelt et al. [16] have argued that irregular protogalactic clumps could (partly) produce the large velocity widths of DLAs at high redshift. Perhaps the most closely related examples of such clouds in the nearby universe are Galactic high velocity clouds [65, HVCs,]. The H i column densities in the clouds themselves very rarely exceed the DLA limit, but it is conceivable that along a sight-line through the gas disk, HVCs could contribute sufficiently to the integrated optical depth to influence the measurements. Several authors have noted the similarity between the properties of Galactic HVCs and those of MgII absorption systems [51, 3, e.g.], of which DLAs are a subset.
Because of the unknown distances to the vast majority of the Galactic HVCs, their physical properties are difficult to ascertain. In this respect, the recent identification of HVCs around M31 is particularly interesting [59]. Synthesis folow-up observations by Westmeier et al. [69] show that these clouds have typical sizes of 1 kpc and column densities in the range to , i.e., below the DLA threshold. If these HVCs really are the relics of galaxy formation, it is likely that they present a much higher cross-section at higher redshifts when galaxy formation was more actively taking place. As such, they could have a significant effect on the measurements in high- DLAs. We note that this component is closely related to (and perhaps partly a variant of) the tidal streams and winds discussed above.
Also interesting in this context are the recent very deep 21-cm observations of NGC 2403 [13] and NGC 891 [40]. These observations reveal low column density extended H i haloes, which typically contain 10 to 30% of the total H i mass of the galaxies22 2 Related to these observations are the results of Heald et al. [17] who show evidence for diffuse ionized extraplanar gas, decoupled from the main rotation of the disk. However, analogs of this ionized gas in DLAs at higher are unlikely to add much to the velocity widths measured in the low-ionization lines, for reasons explained in section II.6. Again, the H i column densities in the haloes are too low to cause DLA absorption by themselves, but along sight-lines through the gas disks, the haloes can have a significant effect on measurements. These haloes show structures such as clouds and filaments, which resemble the properties of Galactic HVCs. Detailed modeling of the H i haloes [12] shows that their origin lies partly in a fountain mechanism [56], as demonstrated by the close link between the extra-planar H i and H emission [2, and references therein]. The driving force behind this fountain is star formation in the disk. The cosmic star formation rate density was much higher in the past, up to a factor 20 higher at compared to the present epoch [18]. The increase in the cosmic neutral hydrogen mass density is much less dramatic, approximately a factor 2 over same redshifts range [44]. These two results combined imply that the energy input into the cold gaseous medium per unit gas mass was much higher in the past. This may lead to a relatively high contribution of fountain gas to the kinematics of cold gas at these redshifts. This high velocity gas would probably be characterized by profiles very similar to the ones observed in DLAs displaying a main peak and a weaker tail. In passing, we note that the higher energy input into the gas disk would also lead to an increase in the gas turbulence, which also causes larger velocity widths.
In order to fully explain the properties of the gaseous haloes, Fraternali & Binney [12] speculate that accretion from the surrounding intergalactic medium is also required. This “cold mode” of gas accretion is increasingly more important at higher redshifts in the smoothed particle hydrodynamics simulations of Keres et al. [21], indicating that this halo gas could play an important role in the gas kinematics of DLAs.
V. Conclusions
In this paper we have tested whether the kinematics of damped Ly absorbers at high redshift are consistent with the idea that these systems arise in the gas disks of galaxies such as those in the local universe. We have examined the gas kinematics of local galaxies using the high quality H i 21-cm data from the H i Nearby Galaxies Survey (THINGS). To characterize the velocity widths, we adopt the parameter , the width that encompasses the central 90% of the total flux seen along any sightline through the galaxies. The same parameter is used for DLAs to measure the width of the low-ionization lines, which are believed to trace the kinematics of the neutral gas.
We can use the THINGS data to calculate in detail how depends on H i column density, and we find that larger values are more likely to occur at low H i column densities. A similar (but weak) trend is seen for the DLAs, albeit at at higher values of . We also investigate how depends on impact parameter from the center of a galaxy and on galaxy luminosity. However, at present it is difficult to make a quantitative comparison between these calculations and the DLA data because of the very few identifications of DLA galaxies in the literature. For a proper understanding of the kinematics and other properties of DLAs, it is important that more DLA galaxies be identified at low and high redshifts.
The most important result is that the median at is approximately 30 , a factor of two lower than what is seen in DLAs at redshifts . We discuss several processes that could increase the velocity widths in DLAs, and conclude that tidal tails, superwinds, accretion, as well as fountain gas are all likely to contribute to the kinematics of DLAs. Each of these processes are enhanced at higher redshifts, where galaxy interactions are more common, superwinds are more frequently observed, ‘cold mode’ accretion is more efficient, and the star formation rate density is higher.
References
- [1] Bigiel, F. Y., Walter, F., Brinks, E., & de Blok, W. J. G. 2008, AJ, in press
- [2] Boomsma, R. 2007, Ph.D. Thesis, University of Groningen
- [3] Bouché, N., Murphy, M. T., Péroux, C., Csabai, I., & Wild, V. 2006, MNRAS, 371, 495
- [4] Brinks, E., & Bajaja, E. 1986, A&A, 169, 14
- [5] Cayatte, V., Kotanyi, C., Balkowski, C., & van Gorkom, J. H. 1994, AJ, 107, 1003
- [6] Chen, H.-W., & Lanzetta, K. M. 2003, ApJ, 597, 706
- [7] de Blok, W. J. G., & Walter, F. 2006, AJ, 131, 363
- [8] Dessauges-Zavadsky, M., Peroux, C., Kim, T. S., D’Odorico, S., & McMahon, R. G. 2003, Monthly Notices of the Royal Astronomical Society, 345, 447
- [9] Dessauges-Zavadsky, M., Prochaska, J. X., D’Odorico, S., Calura, F., & Matteucci, F. 2006, A&A, 445, 93
- [10] Dickey, J. M., Hanson, M. M., & Helou, G. 1990, ApJ, 352, 522
- [11] Engelbracht, C. W. et al. 2006, ApJ, 642, L127
- [12] Fraternali, F., & Binney, J. J. 2006, MNRAS, 366, 449
- [13] Fraternali, F., van Moorsel, G., Sancisi, R., & Oosterloo, T. 2002, AJ, 123, 3124
- [14] Fynbo, J. U., Møller, P., & Warren, S. J. 1999, MNRAS, 305, 849
- [15] Gottlöber, S., Klypin, A., & Kravtsov, A. V. 2001, ApJ, 546, 223
- [16] Haehnelt, M. G., Steinmetz, M., & Rauch, M. 1998, ApJ, 495
- [17] Heald, G. H., Rand, R. J., Benjamin, R. A., & Bershady, M. A. 2006, Astrophysical Journal, 647, 1018
- [18] Hopkins, A. M., Rao, S. M., & Turnshek, D. A. 2005, ApJ, 630, 108
- [19] Kamphuis, J., & Sancisi, R. 1993, A&A, 273
- [20] Kennicutt, R. C., J. et al. 2003, PASP, 115, 928
- [21] Keres, D., Katz, N., Weinberg, D. H., & Davé, Romeel, R. 2005, MNRAS, 363, 2
- [22] Kim, S., Dopita, M. A., Staveley-Smith, L., & Bessell, M. S. 1999, AJ, 118, 2797
- [23] Lacy, M., Becker, R. H., Storrie-Lombardi, L. J., Gregg, M. D., Urrutia, T., & White, R. L. 2003, AJ, 126, 2230
- [24] Le Brun, V., Bergeron, J., Boisse, P., & Deharveng, J. M. 1997, A&A, 321, 733
- [25] Ledoux, C., Petitjean, P., Fynbo, J. P. U., Møller, P., & Srianand, R. 2006, A&A, 457, 71
- [26] Ledoux, C., Petitjean, P., & Srianand, R. 2003, MNRAS, 346, 209
- [27] Lehnert, M. D., Heckman, T. M., & Weaver, K. A. 1999, ApJ, 523, 575
- [28] Leroy, A., Brinks, E., Walter, F., & de Blok, W. 2008, AJ, in press
- [29] Lopez, S., Reimers, D., D’Odorico, S., & Prochaska, J. X. 2002, Astronomy and Astrophysics, 385, 778
- [30] Lu, L., Sargent, W. L. W., Barlow, T. A., Churchill, C. W., & Vogt, S. S. 1996, Astrophysical Journal Supplement Series, 107
- [31] Martin, C. L. 1998, ApJ, 506, 222
- [32] Meurer, G. R., Carignan, C., Beaulieu, S. F., & Freeman, K. C. 1996, AJ, 111, 1551
- [33] Møller, P., Fynbo, J. P. U., & Fall, S. M. 2004, A&A, 422, L33
- [34] Møller, P., Fynbo, J. P. U., & Fall, S. M. 2004, A&A, 422, L33
- [35] Møller, P., Warren, S. J., Fall, S. M., Fynbo, J. U., & Jakobsen, P. 2002, ApJ, 574, 51
- [36] Murphy, M. T., Curran, S. J., Webb, J. K., Ménager, H., & Zych, B. J. 2007, MNRAS, 376, 673
- [37] Nestor, D. B., Turnshek, D. A., Rao, S. M., & Quider, A. M. 2007, ApJ, 658, 185
- [38] Noordermeer, E., van der Hulst, J. M., Sancisi, R., Swaters, R. S., & van Albada, T. S. 2007, Monthly Notices of the Royal Astronomical Society, 376, 1513
- [39] Nulsen, P. E. J., Barcons, X., & Fabian, A. C. 1998, MNRAS, 301, 168
- [40] Oosterloo, T., Fraternali, F., & Sancisi, R. 2007, AJ, 134, 1019
- [41] Péroux, C., Dessauges-Zavadsky, M., D’Odorico, S., Sun Kim, T., & McMahon, R. G. 2005, MNRAS, 363, 479
- [42] Pettini, M., Ellison, S. L., Steidel, C. C., & Bowen, D. V. 1999, ApJ, 510, 576
- [43] Prochaska, J. X., Chen, H.-W., Wolfe, A. M., Dessauges-Zavadsky, M., & Bloom, J. S., 2008, ApJ, 672, 59
- [44] Prochaska, J. X., Herbert-Fort, S., & Wolfe, A. M. 2005, ApJ, 635, 123
- [45] Prochaska, J. X., Ryan-Weber, E., & Staveley-Smith, L. 2002, Publications of the Astronomical Society of the Pacific, 114, 1197
- [46] Prochaska, J. X., & Wolfe, A. M. 1997, ApJ, 487, 73
- [47] Puche, D., Westpfahl, D., Brinks, E., & Roy, J.-R. 1992, AJ, 103, 1841
- [48] Rao, S. M., Nestor, D. B., Turnshek, D. A., Lane, W. M., Monier, E. M., & Bergeron, J. 2003, ApJ, 595, 94
- [49] Rao, S. M., Turnshek, D. A., & Nestor, D. B. 2006, ApJ, 636, 610
- [50] Reynolds, R. J. 1993, Back to the Galaxy, 278
- [51] Richter, P., Westmeier, T., & Brüns, C. 2005, A&A, 442, L49
- [52] Ryan-Weber, E. V., Staveley-Smith, L., & Webster, R. L. 2005, MNRAS, 364, L51
- [53] Ryan-Weber, E. V., Webster, R. L., & Staveley-Smith, L. 2003, MNRAS, 343, 1195
- [54] Schaye, J. 2001, ApJ, 559, L1
- [55] Sembach, K. R., Howk, J. C., Ryans, R. S. I., & Keenan, F. P. 2000, Astrophysical Journal, 528, 310
- [56] Shapiro, P. R., & Field, G. B. 1976, ApJ, 205, 762
- [57] Steidel, C. C., Bowen, D. V., Blades, J. C., & Dickinson, M. 1995, ApJ, 440, L45
- [58] Taylor, C. L., Walter, F., & Yun, M. S. 2001, ApJ, 562, L43
- [59] Thilker, D. A., Braun, R., Walterbos, R. A. M., Corbelli, E., Lockman, F. J., Murphy, E., & Maddalena, R. 2004, ApJ, 601, L39
- [60] Tremonti, C. A. et al. 2004, ApJ, 613, 898
- [61] Turnshek, D. A., Rao, S., Nestor, D., Lane, W., Monier, E., Bergeron, J., & Smette, A. 2001, ApJ, 553, 288
- [62] van der Hulst, J. M., van Albada, T. S., & Sancisi, R. 2001, in ASP Conf. Ser. 240: Gas and Galaxy Evolution, Vol. 240
- [63] Viegas, S. M. 1995, Monthly Notices of the Royal Astronomical Society, 276, 268
- [64] Vladilo, G., Centurion, M., Bonifacio, P., & Howk, J. C. 2001, Astrophysical Journal, 557, 1007
- [65] Wakker, B. P., & van Woerden, H. 1991, A&A, 250, 509
- [66] Walter, F., & Brinks, E. 1999, AJ, 118, 273
- [67] Walter, F., Brinks, E., de Blok, W. J. G., Bigiel, F. Y., Kennicutt, R. C., J., & Thornley, M. D. 2008, AJ, in press
- [68] Walter, F., Weiss, A., & Scoville, N. 2002, ApJ, 580, L21
- [69] Westmeier, T., Braun, R., & Thilker, D. 2005, A&A, 436, 101
- [70] Wolfe, A. M., Gawiser, E., & Prochaska, J. X. 2003, ApJ, 593, 235
- [71] —. 2005, ARA&A, 43, 861
- [72] Wolfe, A. M., Turnshek, D. A., Smith, H. E., & Cohen, R. D. 1986, ApJS, 61, 249
- [73] Wong, T., & Blitz, L. 2002, ApJ, 569, 157
- [74] Yun, M. S., Ho, P. T. P., & Lo, K. Y. 1993, ApJ, 411, L17
- [75] —. 1994, Nature, 372
- [76] Zwaan, M. A. 2000, Ph.D. Thesis, Univ. of Groningen
- [77] Zwaan, M. A., Meyer, M. J., Staveley-Smith, L., & Webster, R. L. 2005a, MNRAS, 359, L30
- [78] Zwaan, M. A. et al. 2003, AJ, 125, 2842
- [79] Zwaan, M. A., van der Hulst, J. M., Briggs, F. H., Verheijen, M. A. W., & Ryan-Weber, E. V. 2005b, MNRAS, 364, 1467