Multiwavelength spectral and high time resolution observations of SWIFT J1753.50127: new activity?
Abstract
We have conducted an extensive observational campaign of SWIFT J1753.50127 during June 2007 after its bright outburst episode in 2005. We have performed multi-band optical photometry, optical spectroscopy, X-ray spectroscopy and timing and ULTRACAM optical photometry simultaneously in three bands. Both the optical spectrum and the X-ray spectrum, along with enhanced brightness in broad-band photometry point to recent increased activity. We analyze the different spectral regions, finding a smooth optical continuum with a remarkable lack of lines and a very blue component modulated with a period of 3.2 hr and a hard power-law X-ray spectrum. Both the X-ray and optical power spectra are flat at low frequencies up to the 0.1 Hz (10 s) range, then decreasing roughly as a power law consistent with flickering. Furthermore, the optical data show quasi-periodic oscillations (QPOs) near 0.08 Hz (13 s). Together with a dynamical and auto-correlation analysis of the light curves we attempt to construct a complete physical picture of this intriguing system.
Keywords:
X-rays: binaries, binaries: individual (SWIFT J1753.5-0127), timing analysis.1 Introduction
Soft X-ray Transients (SXRTs) are a subset of the low mass X-ray binaries (LMXBs) which are thought to contain a black hole primary, and undergo periodic brightening episodes lasting a few months, with recurrence times of a few years (Tanaka & Shibazaki, 1996). The outburst episodes typically coincide with spectral and timing changes, for example the X-ray high/soft state (thermal emission when accretion is high) and the X-ray low/hard state (coronal/jet or optically thin disc emission when accretion is low; review in Remillard & McClintock, 2006). Such changes are attributed to varying contributions from the various emission mechanisms e.g., dense disc, jet, low density zone (e.g., van der Klis, 2006). It turns out, however, that such a classification may be simplistic, as some systems have been seen to go into outbursts without changing their X-ray state. It is a challenge to understand, in these cases, what indeed is changing (e.g., Meyer-Hofmeister, 2004).
Two main models exist as possible explanations for the low/hard state in accreting binaries. The first and oldest is the Advection-Dominated Accretion Flow (ADAF, e.g., Czerny et al. 2000) model, in which the accretion disc is truncated at a large inner radius, and the relatively inefficient ADAF channels matter to the compact object and to any jets; this region is low-density and responsible for the high-energy emission. In a typical outburst cycle, the accretion disc gains enough mass to overwhelm the ADAF, and fast accretion progresses until the disc is depleted, whereupon the ADAF reforms from small radii to large. The contender model, the Accretion Disc Corona (ADC; e.g., Malzac, 2007) is not dissimilar in its effects, but the mechanism is subtly different. A hot corona of energetic particles may form above and below an accretion disc, and most of the accretion power is carried by strong magnetic fields. When the fields in the corona are strong, the emission from the corona is strong, and a higher proportion of in-falling material is channelled into the jets. When the mass-flow rate increases beyond a critical level, however, enough soft X-ray photons are emittied by the disc to efficiently cool the corona, causing it to condense onto the disc, halting the chanelling of energy and particles away from the core region, which then dominates the emitted spectrum with thermal radiation from small radii. Note that this model was developed initially fpr sources where the central accretion disc is obscured by the outer torus of material, making the ADC relatively more important.
In general, it may be assumed that both processes, with their different physical mechanisms, occur in systems either simultaneously or episodically. The most obvious difference between the two is that for the ADC, the accretion disc extends down to very small radii, to the last stable orbit in the case of a black-hole system. The transitions between accretion modes and feedback in the systems is very poorly understood, however. It seems not to be purely a function of accretion rate, and there certainly appears to be hysteresis in all the transient systems, as typically depicted by their path through the X-ray hardness-luminosity diagram (Homan & Belloni, 2005).
One object which has received a lot of attention in recent times, being an out-lier in the SXRT population, is XTE J1118+480 (Chaty et al. 2003). This system was thoroughly observed through outburst to quiescence in X-rays, UV, optical and radio (Hynes at al. 2003), and showed interesting breaks and possible QPOs in its periodograms (Shahbaz et al. 2005). Being high above the Galactic plane, it has been suggested that XTE J1118+480 belongs to a new population of black hole binaries, with the question of how they can appear in the halo still open (McClintock et al. 2001). XTE J1118+480 is one of the few systems which does not follow the typical path for an SXRT through X-ray hardness/luminosity space: it stayed in the low/hard state throughout. It is also the only system for which a high signal-to.noise optical/X-ray cross-correlation has been calculated, which showed an unexpected “precursor” anti-correlation with optical leading X-rays (and a stronger positive resonse; Kanbach et al. 2001).
The SXRT SWIFT J1753.50127 is an X-ray transient system which has been of great interest recently following its outburst episode and detailed observations with the SWIFT satellite. First discovered by the SWIFT/BAT (Burst Alert Telescope; Palmer et al., 2005) in 2005, pointed -ray, X-ray, UV, optical and radio observations all detected a new bright source at this location (Morris et al., 2005; Still et al., 2005; Halpern et al., 2005; Fender et al., 2005). Swift/XRT (X-ray Telescope; Burrows et al. 2005), and RXTE (Rossi X-ray Timing Explorer; Jahoda et al. 1996) observations detected the existence of a strong 0.6 Hz quasi-periodic oscillation (QPO; Morgan et al. 2005; Ramadevi & Seetha, 2005), persistent for some time after the outburst episode. This QPO has so far only been seen in X-ray observations. Zhang et al. (2007) presented the evolution of the QPO frequency with time after the outburst, and its relationship to X-ray hardness. With a high Galactic latitude, comparisons with XTE J1118+480 promise to be very interesting.
Summarizing the above works very briefly, after a fast initial rise in X-ray flux, the source returned to its previous level, almost undetectable by the RXTE All-sky Monitor, in a few months (rise time of 4.5 days, decay of an exponential time-scale initially 32 d, later 100 d, peak flux 0.2 crab in the RXTE/PCA or SWIFT/XRT band). Throughout, it remained hard in X- and -rays (a rising spectrum in out to 200 keV), suggesting a hot Comptonizing corona (ADC). The optical counterpart also faded, but the fade slowed, and it remains relatively bright and blue. Hα and He lines were originally observed, double-peaked, but disappeared after the initial outburst (Torres, 2005). The accretion disc inclination is thus non-negligible, but neither is it extreme (°), since eclipses are never observed. The Hα line was not particularly strong (equivalent width Å) but very broad (FWHM2000 km s-1). From the NaI doublet and UV observations, the extinction equivalent to cm-2 and a distance of kpc have been estimated. The radio spectrum was variable and consistent with a flat power law () which lies underneath the optical points, if extrapolated (Fender et al. 2005). This suggests that, initially at least, the optical emission did not appear like a typical synchrotron spectrum.
Cadolle Bel et al. (2007; CB07 from hereon) performed follow-up simultaneous multi-wavelength observations. They identify SWIFT J1753.50127 as a likely Black-Hole Candidate, which stayed in a low/hard state throughout its outburst and gradual fade. They also detected a QPO in their X-ray data, but weaker, and at the somewhat lower frequency of 0.24 Hz. Such a reduction in the frequency is consistent with what would be expected for the inner radius of an accretion disc, which expands during the decaying lifetime of the outburst in the ADAF model. The INTEGRAL count-rate during their observation was constant at 43 cts s-1 ( mCrab between 20–320 keV), with a hardness ratio . They also found a flat radio spectrum with fluxes of the order 0.65 mJy.
Miller et al. (2006a) observed SWIFT J1753.50127 some months after the outburst episode above with XMM-Newton and RXTE, when the source was assumed to have reached quiescence. Their spectral modelling indicated a prominent accretion disc was required by the X-ray spectrum with high significance. This disc is cool ( keV), and extends to very small radii near the last inner stable orbit. This model would pose problems for models of low-level accretion involving an ADAF region near the central source, and complicate jet-formation scenarios. An ADAF model is commonly invoked to explain the existence of a jet in the low/hard state and its absence in the high/soft state, in systems where both states have been observed (e.g., Fender, 2006).
We have conducted a comprehensive observational campaign of SWIFT J1753.50127, including optical photomety in different filters on five successive nights, with min time resolution, contemporary X-ray observations, optical spectroscopy and high time-resolution optical observations with ULTRACAM. Here we present the results of this campaign, particularly timing analyses of the data-sets and comparisons between them. In the companion paper, Durant et al. (2008) analyze the cross-correlation of the X-ray and optical light curves from the simultaneous high-speed observations, finding suprisingly that the optical precedes the X-rays with a broad anticorrelation peak, followed by a weak positive response for the optical lagging the X-rays. The only contemporaneous radio observation of SWIFT J1753.50127 we are aware of were taken by Soleri et al. (2008), who did not detect the source with the Westerbrook Synthesis Radio Telescope in July 2007, establishing a 3 limiting flux of 1.1 mJy at 5 GHz and 8 Ghz. Zurita et al. (2008) also observed this system in the optical band, but over a much longer time base-line (several months) and they discuss the long-term optical brightness trend and newly discovered hr superhump/orbital period.
In the following section we describe the various observations and processing. In Section 3, we give the results of this, and further analysis comparing the different data, including timing and spectral analyses. In Section 4, we discuss the results and attempt to draw physical conclusions from them.
2 Observations
Table 1 lists all the observations of SWIFT J1753.50127 that are analyzed here. Of the observations listed there, only the WHT/ISIS spectrum was not obtained during the same week of 2007 (it is from one year earlier), whereas the radio limits of Soleri et al. (2008) were approximately contemporary with our observations.
Further to our own observations below, we retrieved the Rossi All Sky Monitor (AMS; Levine et al., 1996) daily average count rates for SWIFT J1753.50127, as well as regular monitoring observations by the gamma-ray satellite INTEGRAL’s wide-field lower energy-band imaging instrument ISGRI (Integral Soft Gamma-ray Instrument; Lebrun et al. 2003). These are shown in Figure 1. The ASM observes the whole sky, and INTEGRAL surveys the Galactic Centre regularly, and all interesting bright objects are automatically measured. These data are publicly available (the reduction is not described here, see the references above).
2.1 X-ray
SWIFT J1753.50127 was observed for 53.6 min each on 11 Jun 2007 and 13 Jun 2007 with the Rossi X-ray Timing Explorer (RXTE). RXTE comprises three instruments: the Proportional Counting Array (PCA; Jahoda et al. 1996) for soft-band pointed observations with large effective area, the High-Energy X-ray Timing Experiment (HEXTE; Rothschild et al. 1998) for energies up to 200 keV and the All-Sky Monitor (ASM, see above), with a very large effective field of view. None are imaging instruments, but provide high temporal resolution. For the first observation, only two of the PCA units were functional, and in the second observation, three. We use only the PCA light curves in our timing analysis, since the count rates are so much higher than the high-energy HEXTE count rates. The latter we only use in the spectral fitting.
Events were processed through the standard pipeline for both the PCA and HEXTE data-sets. Standard Good Time Intervals were applied and we selected all events flagged as good for further analysis. We generated light curves by binning the events on a regular grid; uncertainties on each sample are dominated by photon counting noise.
When a fluxed spectrum is generated from the data, using the instrument response functions, the HEXTE and PCA parts of the spectrum do not appear to meet: there seems to be a 15% discrepancy, which corresponds to the effect of dead time. We corrected for this and performed our spectral analysis on these data.
2.2 Optical Photometry
We observed SWIFT J1753.50127 with the 2.2 m Nordic Optical Telescope (NOT; 2007 Jun 16, 17) and the 1.5 m Mercator (2007 Jun 18, 19, 20) telescopes at Roque de los Muchachos Observatory, La Palma, Spain. In each case, we performed CCD-based imaging with exposure times of 60 s. With the NOT we acquired images in the and filters, and with the Mercator in the filters. Standards were imaged with the NOT in the and filters, and the Mercator photometry was calibrated via images of both the science field and standards fields with the IAC80 telescope at the Teide Observatory, Tenerife. The weather was generally good, especially for the NOT run, with some variability and thin cloud during the Mercator run.
Images were in every case first bias-subtracted, then flat-fielded using drift images of the twilight sky. Note that the NOT/Alfosc images were affected by unrepeatable electronic pick-up, and that the photometry was therefore somewhat degraded. Photometry was measured in small apertures relative to a bright local reference in the field. For this, we used the ULTRACAM pipeline, as below with the ULTRACAM data. The local reference was in each case calibrated relative to the Landolt standard list (Landolt, 1992), correcting for a colour term for each filter set. Having other stars in the field of similar brightness to SWIFT J1753.50127 enabled us to check that the analysis process was not introducing any systematic signal into the light curves. The uncertainty on each measurement is estimated from the photon statistics of the counts within an aperture and the sky background. Our measurements are source photon noise dominated.
2.3 Optical Spectroscopy
We obtained spectra across the optical range with the Intermediate dispersion Spectrograph and Imaging System (ISIS11 1 http://www.ing.iac.es/Astronomy/observing/manuals/ html_manuals/wht_instr/isis_hyper/isis_hyper.html) on the 4.2 m William Herschel Telescope (WHT) at the Observatorio Roque de los Muchachos, La Palma, Spain. ISIS features twin spectrographs optimized for the red and blue end of the optical, which can be used simultaneously with the use of a dichroic in the main beam. We obtained 1.72 Å/pixel mean dispersion in the blue arm, and 1.65 Å/pixel in the red, with a mean resolution Å throughout, under good conditions. The two spectra were wavelength calibrated and extracted using standard iraf tools, and co-added into master spectra. In order not to lose any resolution when co-adding, each spectrum was first re-sampled to 0.5 Å.
To flux and produce the final spectrum, we observed a spectral standard at a similar airmass, and for both the object and the standard spectrum, summed together the red and blue parts into a single master spectrum (sampled at 0.5 Å). Since the dicroic provides a sharp but finite cut-off, calculating the response function for any one arm in the cut-off region is hard, but yet there are enough photons in total at any given wavelength to find the overall sensitivity. The final response curve we used to flux the data was a heavily smoothed version of the ratio of the tabulated flux to the measured counts for the standard. These observations were done one year after the outburst of SWIFT J1753.50127, during the faintest part of the ASM light curve since detection (Figure 1).
We also obtained a spectrum of SWIFT J1753.50127 during our June observing campaign with the Focal Reducer and low dispersion Spectrograph (FORS2, Appenzeller et al. 1998) on the 8.2 m Unit Telescope 1 (Antu) of the VLT, Cerro Paranal, Chile. This observation was simultaneous with one RXTE and one ULTRACAM observation. The spectral scale was 3.17 Å/pixel, and resolution Å. Conditions were mediocre, with variable cloud cover, transparency and seeing. Since the whole spectral range is obtained in a single go, the problems associated with matching two spectra (above) were not encountered here, and the extraction was straight-forward.
2.4 ULTRACAM
In addition, SWIFT J1753.50127 was also observed with ULTRACAM, mounted on the VLT/3 (Melipal) telescope on the nights of 2007 Jun 12 and 17, for 1.3 hr and 0.5 hr respectively. ULTRACAM is an instrument employing dichroic beam splitters, frame-transfer CCDs and a GPS-based timing system in order to be able to make simultaneous multi-wavelength optical light curves at very high time resolution, up to 500 Hz (Dhillon et al. 2007). We used two small windows on each CCD (one for the source of interest, one for a local standard), with exposure times of 140 ms for the 12th and 39 ms for the 17th (and duty cycles of 142 ms and 41 ms respectively). The reason for the difference in exposure times was thin cloud on the first of the two nights, giving similar signal-to-noise per image.
The object was visible in every frame in the and bands, but not in the band. For the latter, therefore, the source could only be detected by co-adding many images, resulting in reduced temporal resolution but better signal-to-noise. On the first night, with the poor conditions, the effect was particularly strong, and we do not attempt to analyze these data. On the 17th, however, it was possible to get reasonable measurements from averages of every 50 images. Thus it was not possible to search for high-frequency variability in these data, but timescales 4 s were accessible.
Fluxes were extracted by aperture photometry with a variable aperture size scaled to the FWHM of the reference star on each image. This enables some optimization for signal-to-noise under variable conditions. The optimal extraction method (Naylor, 1992) did not yield appreciably different results, since that method is more applicable to the faint, background-dominated regime.
The night of the 2007 June 12 was badly affected by transparency variations. In addition, the comparison star chosen was of similar brightness to our source in and significantly redder, introducing additional uncertainty in and even more in . This is evidenced by the difference in the -band and -band light curves. Only for the 17th can we give reliable average magnitudes, based on the calibrated zero-points of the instrument. These are on the SDSS photometric system (systematic uncertainties here are 0.03–0.05 mag, increasing to the blue). By the transformations given in Jester et al. (2005), the SDSS average magnitudes correspond to V16.62(5), B16.92(7), consistent with the slow photometry above. The slow photometry has a better absolute calibration.
| Date (UT) | Type | Instrument | Filter(s) | Duration (min) |
|---|---|---|---|---|
| 2006-06-17 | Spectrum | WHT/ISIS | red, blue | 160 |
| 2007-06-11 | X-ray | RXTE | 54 | |
| 2007-06-13 | Photometry | ULTRACAM | 78 | |
| 2007-06-13 | X-ray | RXTE | 54 | |
| 2007-06-13 | Spectrum | VLT1/FORS2 | 3 | |
| 2007-06-16 | Photometry | NOT/Alfosc | 434 | |
| 2007-06-17 | Photometry | NOT/Alfosc | 420 | |
| 2007-06-17 | Photometry | ULTRACAM | 30 | |
| 2007-06-18 | Photometry | Mercator/Merope | 411 | |
| 2007-06-19 | Photometry | Mercator/Merope | 290 | |
| 2007-06-20 | Photometry | Mercator/Merope | 432 |
3 Analysis and Results
3.1 Long-term trend
Figure 1 shows the long-term luminosity trend of SWIFT J1753.50127 as seen in the X-ray and gamma-ray bands.
It appears that, after the initial outburst and fade, the source has been steadily increasing in flux to a peak at the time of our observation, of the order of the flux in the tail of the initial outburst. Note that on the left-hand extreme of Figure 1, one can see the zero level for the default extraction for this source. The ASM count rate at the time of the June 2007 observations is clearly higher than this, near 2 cts s-1. This corresponds to a flux of order erg s-1cm-2 in the 1–10 keV range (estimated using WebPIMMS). Note further, that the INTEGRAL rate ratios in the observations available were similar in each epoch, and the light curve follows that of the ASM, indicating that the high-energy portion of the emission changed little in spectral slope/hardness. Unfortunately, observations closer in time to our campaign are not yet publicly available.


In the optical, as detailed in Zurita et al. (2008), the counterpart also settled to a steady optical magnitude, which has periodic and aperiodic variability superposed.
3.2 Orbital Modulation
The light curves from our photometric observations with the NOT and Mercator telescopes are shown in Figure 2.
NOT


Mercator


In each night and each band (), the hr modulation reported in the band by Zurita et al. (2008) is clearly apparent, confirming their result. We are unable, however, to aproach the accuracy of their period determination from our four nights’ data. Furthermore, simultaneous light curves in each filter show remarkably similar shapes. (Note that the observations here were not strictly simultaneous: they were made through each filter in turn) This variabilty has a shape typical of superhump modulations (the conclusion reached by Zurita et al), but we cannot exclude eclipsing (of the disc) or emission from the irradiated side of the donor star from these data alone. Clearly, the colours vary very little through the modulation period. The overall brightness does vary during each night and from one night to the next. Table 2 lists the mean magnitudes and colours from each of the five nights. The variability within each night is smooth and at the % level.
| Date (start) | ||||
|---|---|---|---|---|
| 2007-06-16 | 16.43(15) | 17.05(9) | ||
| 2007-06-17 | 16.51(19) | |||
| 2007-06-18 | 16.89(15) | 16.49(14) | ||
| 2007-06-19 | 16.89(12) | 16.49(10) | 16.29(8) | |
| 2007-06-20 | 16.94(13) | 16.55(11) | 16.34(11) |
All magnitudes are in the Johnson-Cousins system. Numbers in parentheses indicate the spread in values.
Interestingly, our average magnitudes do not match those of Zurita et al (2008), which were determined on 2007 June 7, not far in time from our own observations. We find that the object is typically brighter by mag in each of the bands in our data.
3.2.1 Pulsed Fraction

The light curves presented also give information about the amount of flux involved in the 3.2 hr modulation. This can be measured directly from the graphs from the peak-to-peak amplitude. In Figure 3 we plot both the total flux (as an average across the observations) and modulated flux in the optical region. Here the uncertainties in the pulsed flux come from the scatter in points on the light curves rather than variability between nights - a caveat for comparing the points. Although there is night-to-night variability, it is clear that the pulsed flux increases with energy, whereas the total flux is flat or turns over. It appears that the pulsing component is hotter than the DC component (or fast-varying component); specifically, a linear function fitted to the log-log points in Figure 3 yields slopes of -0.1(2) and 0.7(2) for the total and modulated components respectively. We can speculate that modulated emission would dominate in the near-UV. Note that these points have not been de-reddened in order not to add additional uncertainty to the plot. De-reddening the pulsed flux points by would yield a spectrum which is roughly consistent with a Wien slope. The dependence of the pulsed fraction on wavelength rules out that this component originates from X-ray reprocessing.
3.3 Spectrum
3.3.1 X-ray
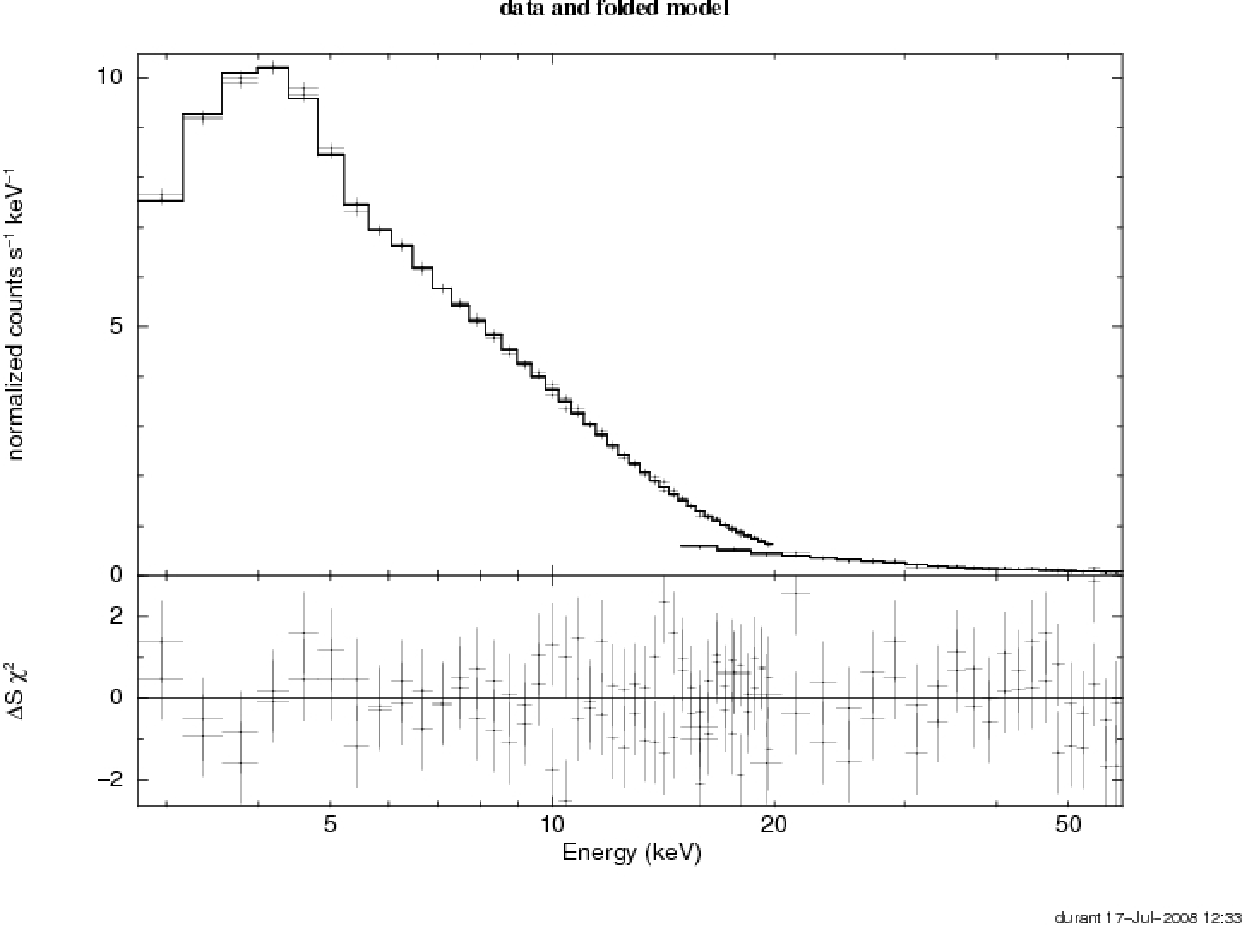
The spectrum was extracted from the valid photon events, and the nominal background subtracted. We fit the resulting spectrum (using Xspec) in the range 2–50 keV (including both PCA and HEXTE observations) to an absorbed power law, and find a statistically satisfactory fit with () and normalization ph keV-1cm-2s-1 – see Figure 4. A thermal disc component at low energies and a Gaussian feature at an energy keV are consistent with the data and modestly improve the statistic of the fit, each with a significance of , after taking into account the uncertainty on the column density for the former. The broad line might be consistent with a Fe Kα line with a rest-frame energy of keV.
Specifically, using the hydrogen column found by CB07, we fitted the X-ray spectrum with a model consisting of a power-law continuum as above, summed with a disc thermal model (diskbb in Xspec) and Gaussian emission feature. The best-fit parameters we find are as follows: disc temperature keV, normalization22 2 defined in Xspec as where is an effective inner radius, from Kubota et al. (1998) , emission peak energy keV, normalization ph cm-2s-1. The plotted points and fitting included only photon-counting uncertainties and assume that the pipeline deals correctly with the calibration. It should be noted, that the RXTE/PCA calibration for the low energies of these putative detections is somewhat uncertain, and further complicated by non-negligible background contamination, which increases rapidly to lower energies (Jahoda et al. 2006). The fit values and implied significance of the components should therefore be read cautiously, particularly for the thermal component. We did, however, include the most recent calibrations available, which fixed previously unknown problems with the background estimation, such as correctly recording the time since last passage through the South-Atlantic Anomaly 33 3 see http://www.universe.nasa.gov/xrays/programs/rxte/ pca/doc/bkg/bkg-2007-saa/.
We regard the detection of a disc component and of a broad emission feature as suggestive, however the line would fit with a gravitationally red-shifted, velocity-broadened Iron K line, as has been seen for some other black hole accreting systems (Miller, 2007). For the neutral Iron K line at keV, the gravitational red-shift would correspond to 3.6 Schwarzschild radii.
Ramadevi & Seetha (2007) had found strong evidence for a very soft thermal component in the X-ray spectrum of SWIFT J1753.50127 during the brighter emission near the outburst of 2005. The temperature of this component was keV, whereas Miller et al. (2006a) report a much cooler thermal component of 0.2 keV at a later time, further after the outburst. The latter was based on XMM-Newton EPIC and grating spectra, which are much more sensitive at low energies than RXTE. Our marginal detection of a thermal component is consistent with the later temperature. A comparison of preferred fit parameters by different authors (at different times since the outburst) are shown in Table 3.
Note that Ramadevi & Seetha (2007) reported finding an absorption edge at keV. In their analysis, this improved the quality of the fit from to 1.3. This may explain the departure from a power law in our spectrum. The shape around this energy does not look like an absorption edge feature, however.
| Parameter | Ramadevi & Seetha | Miller et al. | Cadolle-Bel et al. | This work |
|---|---|---|---|---|
| (2007)1 | (2006)2 | (2007) | ||
| Satellite | RXTE | XMM | RXTE | RXTE |
| July-November | March | August | July | |
| 2005 | 2006 | 2005 | 2007 | |
| 1.660.01 | 1.5480.005 | |||
| (keV) | 0.210.02 | 0.190.03 | ||
| 3 (km) | 100 | 2–6 | 170 | |
| 4 | 0.170.1 | 0.54 | ||
| 4 | 1.030.01 | 1.060.02 | ||
| 1.3 | 1.15 | 1.17 | 1.01 | |
| (cm-2) | ||||
| (Hz) | 0.8910.008 | 0.2410.006 | See §3.4.1 | |
| (Hz) | 0.2 | 0.03 | ||
| %RMS | 23 | 5.4 |
Note that each fit is for a different combination of instrument, spectral range and fitted model, and that the hydrogen column is not necessarily variable in the fit. values are for the best fit in each case.
1: Parameters at the start of the outburst.
2: The power law plus black-body model, and the Comptomized model parameters both given.
3: At 8 kpc.
4: Comptomized models, seed photon energy and corona optical depth.
The total flux in the spectrum is 1.610-9 erg s-1cm-2 in the 2–20 keV range. This is fainter than the flux reported by CB07, which was measured in the tail of the initial outburst, and brighter than the flux reported by Miller et al. (2006), who performed their observations some months after the outburst (the times of the various follow-up observations are indicated in Figure 1, and the fluxes measured match the ASM curve well).
3.3.2 Optical
The signal-to-noise ratio throughout the WHT spectrum (Figure 5) is significantly better than for the later VLT/FORS2 spectrum, the latter of which was taken in the same epoch as the rest of the observations. Some of the features are apparent in both spectra, however, and the equivalent widths for the most significant features is given in Table 4. Uncertainties are derived by measuring the standard deviation of the flux in the continuum at either side of the line in question. The continuum is assumed to be a straight line, and determined from the data at either side of each spectral line. Assuming that the continuum is a straight line and that the standard deviation is a measure of the uncertainty on each point is clearly not the case for such a undulating spectrum (in fact, it is an over-estimate). Additional systematic uncertainty due to this is not included in the errors presented in Table 4.
The broad-band photometry measurements in Table 2 are equivalent to average fluxes in their respective band-passes (e.g., the zero points of Bessel, 1995). These fluxes appear to be some 20% above the continuum level of our spectroscopy. Note, however, that the flux scale shown in Figure 5 is affected by slit losses and poor transparency during the observations. This accounts for the apparent discrepancy between the typical flux shown here and the broad-band magnitudes in Table 2, which are more reliable. The photometry values show beyond doubt that the spectrum shown has the correct shape (i.e., it is not affected by broad-band mis-calibration of the continuum) and has reddened signifiacntly since the optical spectrum of CB07.
The Na-I interstellar absorption appears to be somewhat higher than previously measured by CB07. Since this measurement is based on relative fluxes (across the lines, compared to the continuum on either side), and the intrument response functions do not change significantly across the width of a narrow line in the centre of the sensativity range, the statistical uncertainties given should be a fair measure of the accuracy of the EW measurements, affected only by the underlying spectrum and not by the instrument calibration, resolution etc. Here we refer only to the WHT/ISIS equivalent width, which should be more reliable. This implies a higher reddening to the object and therefore correspondingly higher distance; see below. Since the interstellar extinction should not have changed, we infer that the extinction internal to the binary varies. The difference in the equivalent width between the WHT and VLT spectra is
We can use the depths of the interstellar lines to estimate the total extincting column to the source. Following the calculation in CB07, cm-2. The uncertainty on this from the measurement of the equivalent width alone is cm-2, but one must keep in mind the uncertainty in determining the continuum and of the conversion factors. We estimate that our column density is accurate to 10%.
From this we can in principle estimate distance to SWIFT J1753.50127 by comparison with field stars of known distance and extinction or H-II clouds. Zurita et al’s (2008) distance puts SWIFT J1753.50127 well above the Galactic plane, in the halo ( kpc). Unfortunately, at such a distance there are few field stars, HII regions or other fiducial distance indicators to compare with. The bulk of the stars along the line of sight are foreground Galactic Plane stars, so it is not possible to find the main sequence or red clump at large distance in this direction. The hydrogen column we estimate from absorption lines above, larger than CB07’s, is consistent with the total Galactic extinction (Still et al. 2006), so the distance 7 kpc estimated by Zurita et al. from the lower column, is consistent with our analysis. Note that there is no clear way to determine how much of the extinction is internal to the binary system. Hopefully, in a future quiescent state we would be able to determine the donor type spectroscopically, and thus find the distance and extinction independently.
Beyond this, all features remain surprisingly weak, with a notable lack of absorption, similar to the results of CB07, who see only a faint hint of H and He absorption. Early in the outburst, there had been significant Hα and He emission, initially double-peaked (Torres et al. 2005), but there is very little evidence of this in our data. For a line of similar width to the interstellar ones seen, we place a 99% upper limit on the equivalent width of Å, whereas Torres et al. found Å (no uncertainty given, except S/N30). Finally, the spectrum still appears blue (as seen also from the multi-colour photometry, Section 3.2), but less so than at the peak of the outburst.
The shape of the continuum in the VLT/FORS2 spectrum is qualitatively more similar to the early spectrum in CB07 than to our intermediate spectrum from WHT/ISIS. The blue part of the continuum appears to have recovered somewhat, although the red has stayed rather similar throughout. We note that, although much closer to a power-law shape, the undulations or deviation froma straight line by %, apparent in the FORS spectrum are real and not an artefact of the flux calibration (the calibration function was calculated for each wavelength bin and smoothed, rather than attempting to fit with a polynomial or other analytic function, which can easily introduce such undulations).
To check the evolution of the continuum shape, we performed further optical spectroscopy with the ALFOSC intrument of the 2.5 m Nordic Optical Telescope (NOT), La Palma, in April 2008. The NOT/ALFOSC spectrum, taken almost a year after our main observation campaign, is also shown in Figure 5. Intriguingly, absorption lines are even less obvious in this spectrum than before, and we do not list them; even the strongest Na-D line seems to have decreased in strength. Using different telescopes, instruments and resolutions, it is hard to say whether these changes are real. If so, they hint at a fair amount of extincting material within the system, the amount of which evolves with time. The undulations in the continuum (i.e., departure from a power law) are still clearly present, however.

| Element | (Å) | Equivalent Width (Å) | |
|---|---|---|---|
| WHT/ISIS | VLT/FORS2 | ||
| Ca | 3934 | 0.380.02 | ¡0.3 |
| Ca | 3969 | 0.430.02 | ¡0.3 |
| DIL | 4430 | 0.660.03 | 0.860.10 |
| DIL | 4885 | 1.000.06 | 1.150.11 |
| DIL | 5780 | 1.090.05 | ¡0.6 |
| DIL | 5797 | 0.2220.007 | ¡0.5 |
| Na | 5892 | 1.690.09 | 2.10.2 |
| Ca | 6283 | 0.770.05 | 0.910.05 |
| DIL | 6614 | 1.200.11 | ¡0.5 |
Slight undulations or humps are apparent in each of the spectra to a greater or lesser degree. These are on the scale of a few percent in flux and of order 500Å broad in Figure 5, compared to a power law (straight line in these plots); such features have now appeared in each of the four optical spectra since SWIFT J1753.50127’s discovery. We must note that H and He emission lines were seen in the initial phases of SWIFT J1753.50127’s outburst (Torres, 2005), so there is no lack of hydrogen or helium in the system.
The existance of broad humps throughout the optical spectral range is suggestive of cyclotron emission, but offers little clear evidence; in theory they could be extremely broadened lines or combinations of lines. The lack of sharp lines argues strongly that the optical emission is not thermal emission from a dense disc over-layed by less dense material, as this would result in absorption and/or emission lines, depending on the dominant temperature. A pure black-body or multi-colour dics would have smooth power laws either side of a single peak. Likewise, synchrotron may well exist in the spectrum, but is generally thought to have a flat spectrum. Charateristic strong cyclotrons humps are not seen, but this is not a similar situation to the more obvious cyclotron emission in the case of Schwope et al. (2003): that is for a polar system, where the emission region has a well-defined magnetic field strength. In our case there could be combined emission from various active patches with various field strengths throughout the disc, not necessarily resulting in a series of clear, well-defined humps.
Thus although there is no clear evidence for cyclotron emission, the spectra do not look like what might be expected from other typical emission mechanisms, so cyclotron may be a successful description.
3.3.3 SED
In Figure 6 we show the spectral energy distribution of SWIFT J1753.50127 in our observations, compared to the comprehensive multi-wavelength campaign of CB07 over a year earlier. We have included limits in the radio from Soleri et al (2008, taken two weeks after our observations), and de-reddened the optical with , the value used by CB07 (so that the comparison is fair).
We find the overall luminosity has dropped by a factor 3, but that the X-ray spectrum has qualitatively the same shape as before (a hard power law). The optical is different: there appears to be a smooth break around the blue such that the V-band flux is significantly fainter, but R and I are consistent, and the slope is redder. One thing is clear: the X-rays and optical require separate emission components, and if the radio is at similar levels to before or lower by a similar factor as the X-rays, then it too requires a separate emission component: synchrotron emission from a jet cannot be dominant in the optical region, if it has a typical flat spectrum. Intriguingly, the black body component suggested in the X-ray spectrum (and not present in CB07) may connect the softest X-rays with the optical. This is merely speculation, however, as the optical spectrum itself does not appear black-body-like.
Any radio emission, if synchrotron in origin (such as the flat spectrum in CB07) would be too weak to account for any significant fraction of the optical emission. Synchrotron does not, however, have to be flat: emission from a single optically-thick clump rises as . Such a spectrum has not, to our knowledge, been seen thus far, although de-convolving the various mechanism possible in the optical is tricky.

3.4 Timing
We produced light-curves for the X-ray observations of SWIFT J1753.50127. We used only PCA rates, since the HEXTE is far less sensitive. Note that there were three Proportional Countrer Units (PCUs) active in the second observation and only two in the first. Neither observation shows any general or long time-scale trend in flux.
We also produced optical light curves, for further analysis. For the optical light curve on the 17th, the more stable of the two nights, rapid variability is seen, on the order s, of a similar magnitude to the 3.2 hr modulation above. The typical uncertainty on each measurement is 0.03 mag in the band, and 0.05 mag in the and 0.08 mag in the band throughout the observation window.
3.4.1 Power Density Spectra
A comparatively high fraction of flux is involved in short-term ( min) variability in both X-ray and optical – 10%, similar or larger than the orbital-like modulation above. Figures 7 to 10 show the power spectra for all the light curves. Note that, for the optical, the Lomb-Scargle method is required, because the sampling is not strictly regular, and some points have null values. A Fourier analysis of these data do give indistinguishable results, if one assumes regular sampling. White noise can be calculated by assuming a standard deviation equal to the Poisson noise () on each sample, or obtained by fitting a function to the power spectra which includes a constant term. Fitting the power spectra and calculating from the known count rates give very similar values for the white noise.


| Parameter | RXTE/PCA | ULTRACAM | |||||
|---|---|---|---|---|---|---|---|
| 2007 June 11 | 2007 June 13 | 2007 June 13 | 2007 June 18 | ||||
| 1 | |||||||
| PL exponent | 1.20 | 1.18 | 0.95 | 0.90 | 0.92 | 0.89 | 1.7 |
| Width 1 (Hz) | 0.102(9) | 0.095(8) | 0.040(4) | 0.033(3) | 0.049(6) | 0.051(5) | 0.087(9) |
| %RMS | 12.0(7) | 13.1(7) | 9.70(8) | 37.7(3) | 4.00(5) | 15.8(2) | 4.8(3) |
| Width 2 (Hz) | 1.7(2) | 1.5(2) | 0.9(2) | 1.5(2) | 1.3(2) | 1.3(3) | … |
| %RMS | 9.3(8) | 9.1(7) | 6.15(15) | 32.2(5) | 2.55(5) | 10.7(3) | … |
| QPO? (Hz) | … | … | 0.0789(15) | 0.0791(16) | 0.079(2) | 0.074(12) | 0.08(3) |
| %RMS | 3 | 3 | 4.4(10) | 11(2) | 1.5(6) | 7(2) | 10 |
| 145/123 | 116/123 | 136/85 | 101/85 | 92/95 | 94/95 | 55/42 | |
Numbers in perentheses are 1-sigma uncertainties in the last digit, 95% confidence for limits.
1 Due to the smaller number of points available, the fitting function only included one Lorentzian.
Qualitatively, one can see a number of features common to the power spectra: a power law-like decay at high frequencies and a break around 0.07 Hz becoming flat in the 0.01 Hz range. Some possible QPOs can be seen at around 0.08 Hz in the optical power spectra but not in the X-ray ones, but with significance only at the 2–5 level. The optical power spectra are all similar to one-another in this respect also.
For the band, we obtained a light curve by co-adding groups of 50 images, and analyzing these. The temporal resolution was thus degraded (to about 2 s), with still significant scatter in the measurements. This accounts for the different appearence of the band power spectrum in Figure 10 (the -band power spectrum is the one with the least points). Many of the same features can be seen in the power spectrum: red noise power law, break, excess in the 0.01–0.1 Hz region and a flat power spectrum at low frequencies. Even a QPO is possibly seen, but not statistically significant.
By visual inspection, we find that the power spectrum continua are each well-fitted by zero-centred Lorentzian functions (as used by CB07, for example). We have, therefore, fitted each power spectrum accordingly, and the result of these fits are shown in Table 5. Also shown are what one would find assuming a power-law noise function for the high-frequency (0.1 Hz) part of each power spectrum. These numbers are consistent with flickering (superposition of discreet, stochastic flares of various heights and durations), for which one expects a power-law exponent of 1 (Bruch, 1992). The flattening of the power spectrum towards lower fequencies does not imply that this considerable power cannot be produced by micro-flares, but implies that the micro-flares cannot have arbritarily long durations.
Uttley & McHardy (2001) give arguments against a Lorentzian and/or power-law power spectrum necessarily being produced by flickering; specifically, if the average flux and variance of sections of the light-curve are linearly correlated, without the line passing through the origin. This is indeed to case here, and implies that although flickers can occur on a wide range of time-scales as measured by the power spectra, there is likely an extra component of constant or very small RMS, perhaps the process which feeds the larger amplitude variability (e.g., Merloni & Fabian, 2001).
Although the power spectra all look rather similar, the numbers presented in Table 5 are not. If the ideas of Uttley & McHardy are correct, then there seems to be a variable competition between the variable component and the low RMS/constant component which depents both on time and spectral range. For the simultanous r’ and g’ numbers, the variability is consistently higher for the shorter wavelength, yet we see generally more variability in the optical than in the X-rays (where, as already stated, we do not find significant QPOs). Any micro-flares must thus be rather blue, but damped in their effect on the X-ray emission.
3.4.2 Auto-correlation functions
Figure 11 shows the auto-correlation functions for the fast timing observations of SWIFT J1753.50127. This is a measure of how well each light curve is correlated with itself as a function of time difference, and therefore of the timescales dominant in the variability. In this sense, it complements the power spectrum, viewing the time-series from the point of view of individual events rather than coherent periodic signals. All the curves are well approximated by Lorentzian functions. The X-ray autocorrelation functions are very narrow (FWHM s), implying that the variability seen at longer time-scales in the power spectra above are not very coherent. The wings of the auto-correlation do, however, seem to extend to large values, with continued structure. Note that the apparent flat tops of the auto-correlations is due to excising the zero-lag value, which is contaminated by white noise. After this, the functions have simply been normalized to 1.


The optical auto-correlations in Figure 11 are all generally broader than their X-ray counterparts (FWHM4 s). One would normally expect this from a consideration of the energy scales: higher-energy emission is produced in an optically thin medium, and can escape easily. The curve is consistent with the others from the night of the 17th, given its lower sampling rate. The optical auto-correlation functions also show some structure at larger lags, which we haven’t shown as it would make the central peaks hard to see.
In Durant et al. (2008) we present the cross-correlation functions between various energy bands of the RXTE/PCU and the ULTRACAM observations. We find that there is a strong anti-correlation with the optical arriving earlier than the X-rays on timescales of 1–10 s, followed by a much weaker positive response after , for the softest X-ray energies. This is a similar result to the “precursor” signal in the cross-correlation function derived for XTE J1118+480 by Kanbach et al (2001). For medium energies, the correlation function is similar but narrower, and we find no correlation for high X-ray energies (where noise dominates). Please refer to this paper for further details.
3.4.3 Dynamic analysis
We produced dynamic power spectra (based on successive small sections of each light curve) from our rapid timing observations.
At first glance, the dynamic power spectra show the same information as the average power spectra above: power concentrated in the 0.01–0.1 Hz range, with no abrupt changes thoughout the observation windows. The two sets of optical dynamis power spectra taken simultanously look identical. For the X-ray, the fluctuation with time is totally consistent with noise. For the optical, however, there is a hint of structure, but again nothing that can be significantly distiguished from noise.
4 Discussion
A summary of our results:- SWIFT J1753.50127 has not returned to a quiescent state, either in X-rays (ASM data), gamma-rays (INTEGRAL data) or optical; rather, it seems to have re-brightened somewhat, compared to one year before our observations. We do not know the current state of radio emission, only the upper limits of Soleri et al. (2008). The optical light curves show superhump-like modulations with a period of 3.2 hr, increasingly significant towards the blue, but not detected in X-rays. The X-ray spectrum is well-described by a single power law of spectral index from 2–60 keV, with hints of a possible soft disc component and an emission line near 6 keV. The optical spectrum shows no sharp features beyond interstellar ones, only small deviations from a power law. The SED shows a need for separate components for each wave-band, in particular, that the optical cannot be a continuation of a flat synchrotron-dominated spectrum. In contrast to previous observations, we find no significant QPOs in power spectra of the X-ray light curves, but we do find 0.08 Hz QPOs in the optical; aside from these, all power spectra are well-described by two zero-centred Lorentzian functions, with widths 0.05 Hz and 1.5 Hz. Autocorrelation functions show a narrower peak (2 s) for the X-ray emission than the optical (–4 s), which are consistent with one-another for all the bands. The cross-correlation functions (Durant et al. 2008) show the optical leading by 1–10 s and strongly anti-correlated with the X-rays, for the lower energies of the RXTE range. Dynamic power spectra show features which may be short-lived QPOs in the 0.02-0.1 Hz region, more poorly defined in the X-rays than in the optical.
From the work of CB07 and Zurita et al. (2008), we suspect that the system contains a stellar-mass black hole and M2V-type companion (which has an undetectable contribution to the current total optical luminosity of the binary), and is located at a distance of several kpc, significantly above the Galactic Plane (in the halo, since its height of order kpc is much larger than the disc scale height). Our measurement of interstellar absorption, particularly of Na, strongly supports a large distance but also suggests an unknown amount of absorbtion internal to the system.
4.1 Evolution
The optical evolution of this source since its 2005 outburst and discovery is more completely analyzed in Zurita et al. (2008). It is clear that the compact object in the system, probably a black hole, is continuing to accrete material, which is powering the observed luminosity. The system was not observed to leave its low/hard state, indicating that some low density/high energy region continued to exist throughout the outburst phase and afterwards. The X-ray spectrum has changed very little, except for the bolometric luminosity.
There is apparent evolution in the overall shape of the optical spectrum between CB07, WHT/ISIS and VLT/FORS2 representing two years of the system’s life since outburst. This is also seen in the broad-band photometry values in Table 2 compared to CB07 - these are a more accurate measure of the change of spectral slope. The wiggles in the WHT/ISIS spectrum are not present either earlier (CB07) or later (out VLT/FORS and NOT/ALFOSC) spectra.
The smooth continuum and the lack of lines in maintained throughout, although hydrogen (Hα) emission was seen immediately after the outburst (Torres et al, 2005). The red part of the spectrum changes very little, and indeed the R-band magnitude has remained remarkably constant (see Zurita et al. 2008). The blue part of the spectrum has changed, however: the large peak at 4000Å dip at 4500Å and second peak at 5000Å seen in CB07 were not evident in 2006, but had recovered to some extent by 2007. It would appear that the process which had caused the enhanced emission during the outburst flare is continuing at a lower level, and that this had maintained the optical emission through the two-year period. Ongoing activity is also suggested by the ASM and INTEGRAL light curves.
In terms of timing, the gross power spectrum has remained qualitatively similar: flat at low frequencies and flickering at high frequencies. A QPO was, however, initially detected at 0.6 Hz by Morgan et al. (2005) and later at 0.4 Hz by Ramadevi & Seetha (2005); an evolution that was tracked in many RXTE observations by Zhang et al. (2007); in this work we see such a QPO, relatively weak, but only in the optical data and not in the X-rays, and at a much lower frequency.
The slowing of characteristic QPO frequencies and time-scales has been seen for other transient systems (McClintock & Remillard, 2006; Shahbaz et al. 2005, 2003), and is commonly taken to indicate an expanding inner radius of the accretion disc, inside of which a low density ADAF region forms. The linking of such a QPO frequency with Keplarian periods may be misleading, however: it is not obvious how a rotation rate translates into luminosity variations, and why there would exist preferred orbits within the disc. If for this system a disc existed at small radii well after the outburst (as suggested by Miller et al. 2006a), then the frequency characterised by the QPOs seen cannot have a Keplerian interpretation.
More simple origins for variability might be disc-corona-jet interaction, turbulence timescales or magnetic field production/migration timescales; these might depend on factors such as accretion rate, magnetic/particle energy balance, jet efficiency, disc density profile etc. Why these in turn should evolve raises further questions; recurrent outbursting episodes suggested hysteresis in X-ray transients (e.g., Malzac, 2007), but the maintenance of a low/hard state in this case would imply only a small change in the mass flow rate. The re-brightening of the source since 2006, and its associated bluer optical colours point to somewhat increasing mass flow from 2006 to 2007.
4.2 Emission mechanisms
The X-ray spectrum is typical of Comptonized emission from a population of energetic particles. This in turn requires a source of lower energy photons to scatter (possibly seen at the lowest edge of our X-ray spectrum, and claimed by Miller at al. 2006, and Ramadevi & Seetha, 2007) and a replenishable energy reservoir in the particles. At the same time, we suggested the possibility of a contribution of cyclotron emission in the optical, requiring significant energy content in the magnetic field. Note that Beloborodov (1999) showed that emission from magnetically driven clouds moving away from the disc would not produce significant re-processing in cooler material, if the bulk motion was mildly relativistic. We cannot exclude either a static optically thick syclotron emitting region nor multiple blackbodies where particular temperatures are favoured. From the cross-correlation, we can discount simple reprocessing being an important factor in the optical emission.
The case is further complicated by the superhump contribution. This accounts for about 10% of the variation in the optical region, but increasing towards the UV. If it is indeed due to a superhump process (i.e., either tidal resonance between the disc and orbital periods, or changing area of the disc; Haswell et al. 2001), then the emission is thermal and very hot with a black-body-like peak blueward of B. We do not see any lines from this emission, but we do not have good spectral sensitivity shortward of 400 nm. The 2006 WHT spectrum showed less of a blue component. This could also be the reason that no QPO was seen in the -band power spectrum - thermal emission may already be dominating at these energies.
Finally there is the case of jet emission. Malzac et al. (2007) presented a model for how jet and disc emission could be coupled in a black hole system such as this. Jet radio emission was certainly seen earlier, closer to the onset of the outburst (CB07; Fender et al. 2005), and Soleri et al’s limits are not stringent enough to exclude even a stronger jet than before. Jet/synchrotron emission cannot, however, be significant in the optical.
4.3 Dynamic behaviour
In Durant et al. (2008) we suggest that the cross-correlation function implies that the optically emitting region was driving rather than responding to the higher-energy emission. Here we add to this that the optical auto-correlation functions are broader than the X-rays, so it would appear that a relatively slowly building process in the optical leads to a faster and anti-correlated X-ray response. Furthermore, the power spectra show that this process occurs as a distribution of small flares (flickering), with a break at a characteristic time-scale corresponding to a period of s.
Although Malzac et al. (2007) produced a model considering the dynamic interaction of a jet and accretion disc, in an effort to explain the optical/X-ray cross-correlation function for XTE J1118+480, they explicitly consider only optical emission dominated by synchrotron emission, with some additional X-ray re-processing by dense disc material. In our case, the optical is not a simple continuation of a synchrotron spectrum int he radio (which extrapolates to below the optical emission); nevertheless, the idea of a magnetic energy reservoir may still be valid, as it can produce the types of dynamic behaviour and feedback observed here. We would be interested to see if their model has a parameter space to match the details given here.
4.4 Comparisons
It is interesting to note, that SWIFT J1753.50127 is the highest Galactic latitude SXRT after XTE J1118+480. The latter object shows some of the same characteristics, which set it apart from the bulk of the SXRT population: short-period superhump/orbital modulation of 4.1 hr, a persistent low/hard state, similar power spectra and unusually bright optical emission (Hynes et al., 2003; Shahbaz et al. 2005). The X-ray/optical cross-correlation function for XTE J1118+480 was the first to unambiguously show an optical-leading anti-correlation component (“precognition peak”, in some sources), although a positive, standard, optical lag signal was dominant (Kanbach et al. 2001).
Unlike SWIFT J1753.50127, XTE J1118+480 did settle into quiescence. In this state XTE J1118+480 also showed a power spectrum which could be described as a power law with break or power law plus QPO. One interpretation of this is to connect this characteristic frequency with the inner edge of the accretion disc: asthe disc-ADAF interface increases in radius, the system decreased in luminosity (Shahbaz et al., 2005). Can the changes of state really be explained by variable accretion rate alone?
A leading anticorrelation was seen once for GX 3394 in the past (Motch et al. 1983). Since this initial and unconfirmed measurement, based on a very short observation window, GX 3394 has changed markedly. In particular, Gandhi et al. (2008) find the cross-correlation is very different and weak, in a fainter state, although optical and X-ray spectral characteristics have not changed much.
Assuming that the threshold for an X-ray binary to leave the Low-Hard State (where the X-ray spectrum is predominantly a power law, rather than thermal) is 1 percent of the Eddington luminosity (McClintock & Remillard, 2006), we can place a limit on the black hole mass in this system, under several assumptions. If the bolometric luminosity can be scaled from CB07 to the peak observed luminosity at the time of outburst, i.e., if the spectrum remained the same throughout the process, then for a distance kpc we can place the limit
Zurita et al. (2008) suggest that a stellar-mass black hole () and M-type star adequately fit the orbital period and quiescent (i.e., pre-outburst) luminosity of the system. Only by obtaining a radial-velocity curve and rotational velocity of the donor star, combined with ellipsoidal light curves can the black hole mass be concretely established.
5 Conclusions
We have conducted optical and X-ray simultaneous spectral and timing observations of SWIFT J1753.50127, while the X-ray binary was still in an active state following its 2005 outburst. We find a superhump-like blue modulation and remarkably featureless emission in the optical, and hard power-law spectrum in the X-ray, with possible thermal and iron K-line contributions. The power spectra are similar in X-rays and optical, flat below 0.05 Hz and decreasing at higher frequencies, except that the optical power spectra show 0.08 Hz QPOs. Dynamic power spectra show these QPOs to be discreet signals wandering in frequency and persistent on timescales of 10 min. These, together with the respective auto- and cross-correlation functions and possible cyclotron emission, suggest that magnetic processes tie together the disc and high-energy emission.
Similar features have been seen for two other interesting SXRTs, XTE J1118+480 and GX 3394. One suggested reason for the difference of these sources to normal SXRTs is that the accretion disc extends right in to the inner-most stable orbit.
Acknowledgments
MD and TS are funded by the Spanish Ministry of Science under the grant AYA 2004 02646 and AYA 2007 66887. PG is a Fellow of the Japan Society for the Promotion of Science (JSPS). Based on observations carried out in ESO programmes 079.D-0535, and 279.D-5021, and during RXTE Cycle 12. ULTRACAM was designed and built with funding from PPARC (now STFC), and used as a visiting instrument at ESO Paranal, and RXTE is operated by NASA. We are grateful for rapid service observations by NOT. Partially funded by the Spanish MEC under the Consolider-Ingenio 2010 Program grant CSD2006-00070: “First Science with the GTC” (http://www.iac.es/consolider-ingenio-gtc/).
Thanks to Cadolle-Bel et al. and Paolo Soleri for use of their data in our SED plots.
References
- (1) Beloborodov, A., 1999, ApJ, 510, L123
- (2) Bessell, M., 1995, IAU Symposium, 167, 175
- (3) Bradt, H., Rothschild, R., Swank, J., 1993, A&AS, 97, 355
- (4) Bruch, A., 1992, A&A, 266, 237
- (5) Burrows, D. N., Hill, J. E., Nousek, J. A., Kennea, J. A., Wells, A., Osborne, J. P., Abbey, A. F., Beardmore, A., Mukerjee, K., Short, A. D. T., Chincarini, G., Campana, S., Citterio, O., Moretti, A., Pagani, C., Tagliaferri, G., Giommi, P., Capalbi, M., Tamburelli, F., Angelini, L., Cusumano, G., Bräuninger, H. W., Burkert, W., Hartner, G. D., 2005, SSRv, 120, 165
- (6) Cadolle Bel, M., Ribó, M., Rodriguez, J., Chaty, S., Corbel, S., Goldwurm, A., Frontera, F., Farinelli, R., D’Avanzo, P., Tarana, A., Ubertini, P., Laurent, P., Goldoni, P., Mirabel, I., 2007, ApJ, 659, 549
- (7) Chaty, S., Haswell, C., Malzac, J., Hynes, R., Shrader, C., Cui, W., 2003, MNRAS, 346, 689
- (8) Czerny, B., Rózȧśka, A., Janiuk, A., Zẏcki, P., 2000, NewAR, 44, 439
- (9) Dhillon, V., Marsh, T., Stevenson, M, Atkinson, D., Kerry, P., et al. 2007, MNRAS, 378, 825
- (10) Durant, M., Gandhi, P., Shahbaz, T., Fabian, A., Miller, J., Dhillon, V., Marsh, T., 2008, ApJL submitted
- (11) Fabian, A., Guilbert, P., Motch, C., Ricketts, M., Ilovaisky, S., Chevalier, C., A&A, 111, L9
- (12) Fender, R., Garrington, S., Muxlow, T., 2005, ATel, 558
- (13) Fender, R. & Belloni, T., 2004, ARA&A, 42, 317
- (14) Gandhi et al., 2008 in preparation
- (15) Halpern, J., 2005, ATel, 549
- (16) Haswell, C., King, A., Murray, J., Charles, P., 2001, MNRAS, 321, 475
- (17) Homan, J., Belloni, T., 2005, Ap&SS, 300, 107
- (18) Hynes, R., Haswell, C., Cui, W., Shrader, C., O’Brien, K., Chaty, S., Skillman, D., Patterson, J., Horne, K., 2003, MNRAS, 345, 292
- (19) Hynes, R., 2005, ASPC, 330, 237
- (20) Hynes, R., 2006, AIPC, 840, 88
- (21) Jahoda, K., Swank, J. H., Giles, A. B., Stark, M. J., Strohmayer, T., Zhang, W., Morgan, E. H., 1996, SPIE, 2808, 59
- (22) Jahoda, K., Markwardt, C., Radeva, Y., Rots, A., Stark, M., Swank, J., Strohmayer, T., Zhang, W., 2006, ApJS, 163, 401
- (23) Kanbach, G., Straubmeier, C., Spruit, H., Belloni, T., 2001, Nature, 414, 180
- (24) Lebrun, F., Leray, J. P., Lavocat, P., Crétolle, J., Arqués, M., Blondel, C., Bonnin, C., Bouére, A., Cara, C., Chaleil, T., Daly, F., Desages, F., Dzitko, H., Horeau, B., Laurent, P., Limousin, O., Mathy, F., Mauguen, V., Meignier, F., Molinié, F., Poindron, E., Rouger, M., Sauvageon, A., Tourrette, T., 2003, A&A, 411, L141
- (25) Levine, A., Bradt, H., Cui, W., Jernigan, J.., Morgan, E., Remillard, R., Shirey, R., Smith, D., 1996, ApJ, 469, L33
- (26) Liu, B., Taam, R., Meyer-Hofmeister, E., Meyer, F., 2007, ApJ, 671, 695
- (27) Malzac, J., Merloni, A., Fabian, A., 2004, MNRAS, 351, 253
- (28) Malzac, J., 2007, MmSAI, 78, 382
- (29) McClintock, J. E., Garcia, M. R., Caldwell, N., Falco, E. E., Garnavich, P. M., Zhao, P., 2001, ApJ, 551, L147
- (30) McClintock, J., Remillard, R., 2006, Chapter 4 of “Compact Stellar X-ray Sources”, eds. W. Lewin and M. van der Klis, CUP
- (31) Merloni, A. & Fabian, A., 2001, MNRAS, 328, 958
- (32) Meyer-Hofmeister, E., 2004, A&A, 423, 321
- (33) Miller, J., Homan, J, Miniutti, G., 2006, ApJ, 652, L113
- (34) Miller, J., 2007, ARA&A, 45, 441
- (35) Morgan, E., Swank, J., Markwardt, C., Gehrels, N., 2005, ATel, 550
- (36) Morris, D., Burrows, D., Racusin, J., Roming, P., Chester, M., Verghetta, R., Markwardt, C., Barthelmy, S., 2005, ATel, 552
- (37) Motch, C., Ricketts, M., Page, C., Ilovaisky, S., Chevalier, C., 1983, A&A, 119, 171
- (38) Palmer, D., Barthelmey, S., Cummings, J., Gehrels, N., Krimm, H., Markwardt, C., Sakamoto, T., Tueller, J., 2005, ATel, 546
- (39) Ramadevi, M., Seetha, S., 2007, MNRAS, 378, 182
- (40) Remillard, R. A., McClintock, J. E., 2008, ARA&A, 44, 49
- (41) Rothschild, R. E., Blanco, P. R., Gruber, D. E., Heindl, W. A., MacDonald, D. R., Marsden, D. C., Pelling, M. R., Wayne, L. R., Hink, P. L., 1998, ApJ, 496, 538
- (42) Schwope, A., Thomas, H-C., Mantel, K-H., Haefner, R., Staude, A., 2003, A&A, 402, 201
- (43) Shahbaz, T., Dhillon, V. S., Marsh, T. R., Casares, J., Zurita, C., Charles, P. A., Haswell, C. A., Hynes, R. I., 2005, MNRAS, 362, 975
- (44) Shahbaz, T., Dhillon, V. S., Marsh, T. R., Zurita, C., Haswell, C. A., Charles, P. A., Hynes, R. I., Casares, J., 2003, MNRAS, 346, 1116
- (45) Soleri, P., Altamirano, D., Fender, R., Casella, P., Tudose, V., Maitra, D., Mijnands, R., Belloni, T., Miller-Jones, J., Klein-Wolt, M., van der Klis, M., 2008
- (46) Stil, J., Taylor, A., Dickey, J., Kavars, D., Martin, P., Rothwell, T., Boothroyd, A., Lockman, F., & McClure-Griffiths, N., 2006, AJ, 132, 1158
- (47) Still, M., Roming, P., Brocksopp, C., Markwardt, C., 2005, ATel, 553
- (48) Tanaka, Y., & Shibazaki, N., 1996, ARA&A, 34, 607
- (49) Torres, M., Steeghs, D., Garcia, M., McClintock, J., Miller, J., Jonker, P., Callanan, P., Zhao, P., Huchra, J., U, Vivian, Hutcheson, C., 2005, ATel, 551
- (50) Uttley, P. & McHardy, I., 2001, MNRAS, 312, 880
- (51) Uzdensky, D., Goodman, J., 2007, MmSAI, 78, 403
- (52) van der Klis, M., in Compact Stellar X-ray Sources. (eds Lewin W. H. G., van der Klis M.), Cambridge Univ. Press, p. 39
- (53) Zhang, G.-B., Qu, J.-L., Zhang, S., Zhang, C.-M., Zhang, F., Chen, W., Song, L.-M., Yang, S.-P., 2007, ApJ, 659, 1511
- (54) Zurita, C., Durant, M., Torres, M., Shahbaz, T., Casares, J., 2008, ApJ, accepted