Deep 610-MHz Giant Metrewave Radio Telescope observations of the Spitzer extragalactic First Look Survey field – III. The radio properties of Infrared-Faint Radio Sources
Abstract
Infrared-Faint Radio Sources (IFRSs) are a class of source which are bright at radio frequencies, but do not appear in deep infrared images. We report the detection of 14 IFRSs within the Spitzer extragalactic First Look Survey field, eight of which are detected near to the limiting magnitude of a deep -band image of the region, at . Sensitive Spitzer Space Telescope images are stacked in order to place upper limits on their mid-infrared flux densities, and using recent 610-MHz and 1.4-GHz observations we find that they have spectral indices which vary between and 1.38, where we define such that , and should not be thought of as a single source population. We place constraints on the luminosity and linear size of these sources, and through comparison with well-studied local objects in the 3CRR catalogue demonstrate that they can be modelled as being compact ( kpc) Fanaroff-Riley Class II (FRII) radio galaxies located at high redshift ().
Keywords:
galaxies: high redshift — infrared: galaxies — radio continuum: galaxies1 Introduction
Infrared-Faint Radio Sources (IFRSs) are a class of radio-bright or infrared-faint objects identified in the Australia Telescope Large Area Survey (Norris et al.,, 2006, ATLAS;). The ATLAS survey consists of deep 1.4-GHz radio observations over two of the southern Spitzer Wide-area Infrared Extragalactic Survey (Lonsdale et al., 2003, SWIRE;) fields, which have deep infrared data between 3.6 and 160 m publicly available. The Spitzer Space Telescope (Werner et al., 2004) infrared observations of the SWIRE fields are sensitive enough that it was expected that all radio sources detected in the ATLAS survey which were in the local Universe would be visible in the SWIRE images (Norris et al., 2006), whether the radio emission was due to star-formation or an Active Galactic Nuclei (AGN). However, it was found that some radio sources did not have an infrared counterpart at any of the Spitzer wavelengths. A total of 55 IFRSs of varying flux densities have been detected within the Chandra Deep Field South (Norris et al., 2006, CDFS;) and European Large-Area ISO Survey South-1 (Middelberg et al., 2008, ELAIS-S1;) fields, with several having 1.4-GHz flux densities of greater than 5 mJy, and the brightest having a 1.4-GHz flux density of 26.1 mJy (Norris et al., 2006).
The possibility that these sources are obscured star-forming galaxies with infrared flux densities falling just below the sensitivity limit of Spitzer would seem to be ruled out by the production of stacked infrared images centred on the radio source positions of 22 IFRSs (Norris et al., 2006) which show no evidence for any infrared counterparts. Norris et al. (2007) made observations of two of their bright IFRSs using Very Long Baseline Interferometry (VLBI), and found that one of them had a compact core with angular size less than 0.03 arcsec (a linear size below 260 pc at any reasonable redshift), although they were unable to detect the second target. They concluded that the radio emission is driven by AGN activity rather than star-formation, making IFRSs either high redshift radio-loud quasars, or abnormally highly obscured radio galaxies at more moderate redshifts. Norris et al. (2007) considered the spectral energy distribution of the radio-loud quasar 3C273, and showed that placing it at low redshift could not reproduce both the detection at 1.4 GHz and non-detection at 3.6 m for the source with the compact core, but moving 3C273 to would fulfil the requirements. However, the lack of information at other wavelengths makes it difficult to determine exactly what type of source the IFRSs are. These sources are selected through being radio-bright, making the use of radio diagnostics important for determining their type.
The first of the large-scale surveys carried out by the Spitzer Space Telescope was the Spitzer extragalactic First Look Survey (xFLS). Four square degrees, centred on , (J2000 coordinates, which are used throughout this work), were observed with two instruments – the Infrared Array Camera (Fazio et al., 2004, IRAC;) at 3.6, 4.5, 5.8 and 8 m, and the Multiband Imaging Photometer for Spitzer (Rieke et al., 2004, MIPS;) at 24, 70 and 160 m. This data is comparable in depth to the SWIRE survey, with catalogue completeness limits (, apart from the 3.6-m band which has its completeness limit set at ) of 20, 25, 100 and 100 Jy in the four IRAC bands. There are two deep radio surveys of the region, at 1.4 GHz with the Very Large Array (Condon et al., 2003, VLA;) and at 610 MHz with the Giant Metrewave Radio Telescope (GMRT; Garn et al., 2007, hereafter Paper I). These have comparable resolution (5 arcsec2 at 1.4 GHz; arcsec2 at 610 MHz) and sensitivity (23 Jy beam-1 at 1.4 GHz; 30 Jy beam-1 at 610 MHz), and cover approximately the same region of sky as the infrared observations. An -band survey of the xFLS field has been carried out (Fadda et al., 2004) with a limiting Vega magnitude of = 25.5, and estimated 50 per cent completeness limit of = 24.5. The deep and complementary infrared, optical and radio observations make this region a good area to search for other IFRSs, and the availability of multi-frequency radio data will allow the spectral index 11 1 where we define the radio spectral index such that of any IFRS to be obtained, providing a much greater understanding of the source properties.
In section 2 we describe the selection criteria for forming a sample of Infrared-Faint Radio Sources. We consider the available radio and infrared properties of these sources in section 3, create stacked infrared images of the sources in order to test whether the sources lie slightly below the Spitzer detection threshold, and place upper limits on their infrared flux between 3.6 and 160 m. We calculate the radio spectral index of each source, and demonstrate that IFRSs are made up of flat, steep and ultra-steep spectrum sources. In section 4 we place limits on the luminosity and linear size of these sources, and compare well-studied sources from the Revised Revised Third Cambridge (3CRR) catalogue of Laing, Riley & Longair (1983) to the observed IFRS population. We demonstrate that it is possible to model the flat, steep and ultra-steep-spectrum IFRSs with the spectral energy distribution (SED) of a local radio galaxy, placed at high redshift, and conclude that it is possible to explain the IFRS population without requiring new, exotic source types. A flat cosmology with the best-fitting parameters from the Wilkinson Microwave Anisotropy Probe (WMAP) five-year data of and H0 = 72 km s-1 Mpc-1 (Dunkley et al., 2008) is assumed throughout this work.
2 Sample selection
2.1 Initial radio source sample
The xFLS region was observed at 1.4 GHz by Condon et al. (2003) with the Very Large Array (VLA), covering deg2 with a noise level of 23 Jy beam-1. We created a sample of radio sources at 1.4 GHz within the region covered by the VLA and GMRT surveys, using Source Extractor (Bertin & Arnouts, 1996, SExtractor;) and the technique described in Paper I. A peak flux density of greater than 0.5 mJy was required for all sources, equivalent to a signal-to-noise ratio of . This ensures that the sources are unquestionably real, and that sources which are found to be infrared-faint will be extreme examples of their class – the inclusion of fainter radio sources in the sample would reduce the significance of the lack of an infrared detection. Within the region covered by the VLA and GMRT surveys, 511 radio sources were detected. We reject 107 of these for being located outside the coverage area of one or more of the infrared images, leaving 404 1.4-GHz radio sources.
A similar catalogue of radio sources was created from the 610-MHz image, requiring sources to be detected at the level but with no further selection criteria. At the edges of the 610-MHz image, corresponds to a flux density of Jy beam-1, decreasing to Jy beam-1 towards the pointing centres. Sources at the 1.4-GHz peak flux limit will therefore be seen anywhere in the 610-MHz survey if they have a spectral index greater than 0.5, so some flat-spectrum 1.4-GHz sources may not be assigned 610-MHz counterparts using this criterion.
The majority of the 1.4-GHz sources (362/404; 90 per cent) had a 610-MHz counterpart within 1.5 arcsec, equivalent to one pixel in the radio images. A further 24 had counterparts within 3 arcsec. The remaining 18 sources were inspected in order to identify why no 610-MHz counterpart was found. Seven were either one component of a double radio source, or extended radio sources with 610-MHz counterparts arcsec away; two were close to a bright source and were concealed by the increased noise surrounding it (see Paper I for details on the effects of bright sources on the 610-MHz image); the remaining nine were near to the edge of the 610-MHz mosaic, and not detected due to the increased noise due to the decreasing gain of the GMRT primary beam. All 18 sources had an infrared counterpart (see section 2.2), and were rejected from the sample, leaving 386 sources to make up the initial ‘radio-bright’ sample.
2.2 Removing infrared counterparts


We follow Norris et al. (2006) in rejecting sources from the radio-bright sample if they have an infrared counterpart within 3 arcsec in any of the published Spitzer source catalogues (Lacy et al., 2005; Fadda et al., 2006; Frayer et al., 2006). This generated an initial list of 94 IFRS candidates, which required visual inspection in order to check for the presence of infrared counterparts which had not been identified as being related to the radio sources. Composite infrared-radio maps were generated for each source, after rotating the geometry of the IRAC images to match the radio observations. The majority of the candidate sources (49/94; 52 per cent) were definite components of double or triple radio galaxies with an infrared counterpart present, but not co-located with the radio emission – Fig. 1a shows an example of one of these sources, with 610-MHz contours overlaid on the 3.6-m image. The counterpart is sufficiently far from the centres of the radio components that it was not classified as a match, but is clearly associated with the double radio galaxy. Four sources were located close to very bright infrared sources, which would have concealed any true infrared counterparts. There were 21 radio sources which should have been matched to a source in the IRAC catalogue, due to either having extended radio emission which covered an infrared source, or having a slightly greater separation between the infrared and radio source centres than 3 arcsec due to the lower resolution of the radio images – Fig. 1b shows an example of one of these sources. One radio source showed no evidence for infrared emission, but was in a noisy region of the 610-MHz image, and the measurement of the radio flux was very uncertain. After rejecting all of these types of source, there were 19 remaining radio sources with no counterparts within the infrared catalogues.
Five of these sources showed clear evidence for an uncatalogued infrared counterpart in the 3.6-m image, with four of these also showing evidence for an uncatalogued counterpart in the 4.5-m image. Fig. 2a shows an example of one of the radio sources with a clear 3.6-m counterpart, which was not included in the IRAC catalogue. We reject these five sources from the sample. A further six sources show possible evidence for an uncatalogued infrared counterpart, with a slight increase in infrared emission being seen at or close to the centre of the radio emission. We retain these sources in the sample, but identify them as having possible counterparts in the remainder of this analysis – we will test for a statistical increase in infrared flux at the centre of each radio source in section 3.1. There are 14 IFRSs remaining in the sample, which are shown in Fig. 3. All images are arcsec2 in order to look for extended structure. The grey-scale ranges between for the 3.6-m image noise level of Jy pixel-1 in order to be sensitive to faint infrared emission. The 1.4-GHz contours, and 4.5, 5.8 and 8-m grey-scale have a similar morphology. The properties of the IFRSs are given in Table 1, and throughout this work, designations of the IFRSs will be taken from the 610-MHz FLSGMRT catalogue from Paper I.


2.3 Comparison with previous samples
Two previous samples of IFRSs have been constructed. Norris et al. (2006) found 22 IFRSs in the Australia Telescope (AT) observations of the 3.7 deg2 CDFS field, while Middelberg et al. (2008) found 31 IFRSs in the observations of the 3.9 deg2 ELAIS-S1 field. The source density of bright IFRSs (with 1.4-GHz flux greater than 1 mJy) is comparable in both studies to the sample presented in this work, which has a density of deg-2, although since we have set a lower limit to the radio flux for our sample selection, we find fewer faint sources. While large-area and relatively shallow radio surveys such as the 1.4-GHz Faint Images of the Radio Sky at Twenty-cm (Becker, White & Helfand, 1995, FIRST;) survey could be used to find bright IFRSs, the requirement for deep infrared observations means that future studies of this type of source are still likely to be limited to smaller well-studied regions such as the xFLS and SWIRE fields.
The number of radio sources which are detected increases rapidly with decreasing flux density (Seymour, McHardy & Gunn, 2004, e.g.), with the radio sky being dominated by AGN sources above mJy at 1.4 GHz, and the contribution from star-forming galaxies becoming important below mJy . The fact that we do not see a rapid increase in the number of IFRSs at lower radio fluxes is a further indication that these sources are unlikely to be obscured star-forming galaxies.
The resolution of the AT radio images, at arcsec2 (Norris et al., 2006) or arcsec2 (Middelberg et al., 2008), is poorer than either the VLA or GMRT observations used in this work (5 arcsec2 and arcsec2 respectively), while the SWIRE infrared observations used in the CDFS and ELAIS-S1 studies are slightly more sensitive than the xFLS observations. While both of these effects may slightly alter the selection biases behind the different IFRS samples, we have followed a similar selection procedure to that described in Norris et al. (2006) and believe that the sources identified in the three works should be comparable.
3 Infrared-Faint Radio Source properties
3.1 Source stacking
A ‘stacked’ infrared image will reveal whether the IFRS population is made up of sources that have infrared fluxes which are slightly below the detection threshold. If this is the case, the stacked images will show a faint infrared source co-located with the radio source centres. A stacking experiment implicitly assumes that the sources being stacked are all of the same type – in section 3.3 we demonstrate that this is not the case, with the IFRS population being made up of sources with flat, steep and ultra-steep radio spectra. However, stacked images will still give an indication of whether there is some infrared flux present which is just below the detection limit for individual sources.
Norris et al. (2006) looked at the mean flux in a series of stacked IRAC images, and found no detections of IFRSs. However, it has been shown (White et al., 2007; Beswick et al., 2008; Garn & Alexander, 2008, e.g.) that a median stacked image is more reliable than a mean image, since the median image is more robust to the presence of a few outlier pixels. We created 14 ‘cut-out’ infrared images with size arcsec2, centred on the radio source positions of the IFRS shown in Fig. 3. The infrared background varies slightly across the field (Lacy et al., 2005) and was calculated using SExtractor and subtracted from each cut-out image. Each pixel of the stacked image was then created by calculating the median value of that pixel from the 14 cut-out images.
| FLSGMRT | 1.4-GHz flux | 610-MHz flux | -band | Possible | ||
|---|---|---|---|---|---|---|
| designation | (mJy) | (mJy) | (Vega mag.) | (arcsec) | counterpart | |
| (1) | (2) | (3) | (4) | (5) | (6) | (7) |
| J171141.3591813 | Y | |||||
| J171141.8591910 | ||||||
| J171141.9591726 | ||||||
| J171149.8591727 | Y | |||||
| J171315.5590302 | Y | |||||
| J171404.0595317 | Y | |||||
| J171436.6594456 | Y | |||||
| J171453.8594329 | ||||||
| J171634.2601258 | ||||||
| J171909.8585346 | ||||||
| J171928.4583927 | ||||||
| J172046.5584729 | ||||||
| J172057.6601558 | Y | |||||
| J172315.5590919 |


Figs. 4a to d show the stacked images for the four IRAC bands, with the grey-scale varying between for the relevant IRAC noise level (where = 2.9, 5, 20, 20 Jy for the four bands). There is an increase in flux density seen in the centre of the 3.6- and 4.5-m images, while the 5.8- and 8-m images show no evidence for emission. This is confirmation that at least some of the potential uncatalogued infrared counterparts are real. Figs. 4e to h show the stacked images created by using only the eight IFRSs which were not identified as having potential uncatalogued infrared counterparts – the lower number of sources used for the stacking makes these images look noisier, but there is still a slight indication of an increase in infrared flux density in the centre of the 3.6- and 4.5-m images.
In order to account for the possibility of a detection near to the noise level, we place upper limits on the infrared flux densities of these sources of 3.1 Jy at 3.6 m, 5.3 Jy at 4.5 m, and 21.2 Jy at 5.8 and 8 m, and set a 24-m limit of 210 Jy (equal to the 24-m catalogue flux limit for the main survey region), and limits of 10 and 50 mJy for the 70-m and 160-m data, again from the catalogue flux density limits.
Star-forming galaxies are observed to follow a tight correlation between their mid- or far-infrared flux density, , and their 1.4-GHz flux density, , which can be quantified by the logarithmic flux density ratio (e.g. Appleton et al.,, 2004; Garn, Ford & Alexander, 2008, hereafter Paper II). The non-detections of IFRSs in the 24 and 70-m Spitzer bands allows us to place upper limits of , and – these values are significantly below the typical values seen for star-forming galaxies of and (Appleton et al., 2004), and are associated with AGN activity.
3.2 Source counterparts at other wavelengths
The NASA Extragalactic Database22 2 http://nedwww.ipac.caltech.edu/ (NED) was searched to find existing information on the IFRSs. The eight sources with the greatest 1.4-GHz flux density were present in the 1.4-GHz FIRST survey. Four sources were present in the 1.4-GHz NRAO VLA Sky Survey (Condon et al., 1998, NVSS;), and four were present in the 1.4-GHz survey of the xFLS region by Morganti et al. (2004). We use the Condon et al. (2003) 1.4-GHz data in preference to any of these surveys, due to the combination of high sensitivity and resolution. One source (FLSGMRT J171436.6594456) has a radio counterpart within the 325-MHz Westerbork Northern Sky Survey (Rengelink et al., 1997, WENSS;). The flux density given in NED is mJy, which is in agreement with the value of mJy obtained by extrapolating the 610-MHz flux density and spectral index (see section 3.3).
Eight of the sources had an optical counterpart within 3 arcsec in the -band images of Fadda et al. (2004). The -band magnitudes (Vega) are listed in Table 1 where appropriate, and are close to the 50 per cent completeness limit of the observations, which was estimated to be . Where no detection was found, this completeness level was taken as the upper limit on -band flux. No other optical or infrared counterparts were found for any of the IFRSs.
3.3 Radio spectral index
One of the few tools available for determining the type of IFRS being observed is their radio spectral index, due to the lack of detections in other wavebands. The spectral index of each source is listed in Table 1, and appear to be uniformly distributed between 0 and 1.4 – a one-sample KS test gives a 99 per cent chance that the data are consistent with a uniform distribution, although the low number of sources limits the significance of this conclusion.
We can use the spectral index as a discriminant to determine between different potential source types which make up the IFRS population. The lack of infrared detections, and VLBI detection of a compact radio core in one source indicate that obscured star-forming galaxies are unlikely to be the dominant source population – this is reinforced by the fact that only six of the sources have a spectral index in the range , close to the typical value for ‘normal’ star-forming galaxies of (Condon, 1992, e.g.).
Three of the IFRSs are Ultra Steep Spectrum (USS) sources, with . Selecting sources with ultra-steep spectral indices is one method for efficiently finding high-redshift radio galaxies (Tielens et al., 1979; Röttgering et al., 1994; Blundell et al., 1998; de Breuck et al., 2000; Klamer et al., 2006, HzRGS, e.g.). There are a number of mechanisms proposed to explain the relationship seen between spectral index and redshift (the - correlation) – see Klamer et al. (2006) for a recent discussion of these – with the high-redshift sources selected using this technique typically being compact, luminous Fanaroff-Riley Type II (Fanaroff & Riley, 1974, FRII;) radio galaxies.
The remaining five sources have flat spectra, with . A flat-spectrum source with compact morphology (see section 4.1) is an indication of synchrotron self absorption occurring either due to core-dominated sources, or sources with a number of overlapping optically-thick regions aligned close to our line of sight (Jarvis & McLure, 2002, e.g.).
4 Modelling the IFRS population
4.1 Linear size constraints
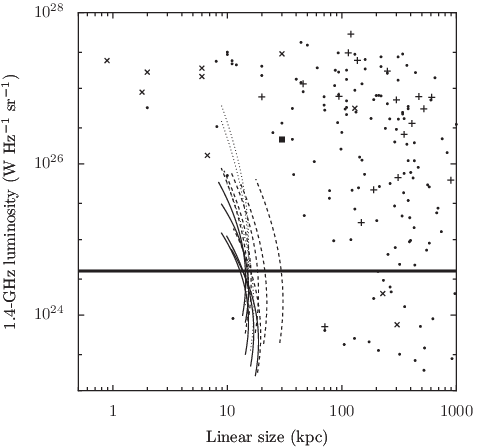
We list the deconvolved angular diameters of each source in Table 1, taken from the catalogue of Condon et al. (2003). From the larger diameter, we calculate upper limits on the linear size of the IFRSs at a given redshift, using the relationship between angular diameter-distance and . We model the luminosity and maximum linear size for each source at redshifts between 0 and 8, using the observed radio flux densities, and -correcting each source to obtain a rest-frame 1.4-GHz luminosity, , at each redshift, with a -correction factor of (see e.g. Paper II). Fig. 5 shows the tracks of maximum linear size against luminosity for the IFRSs on a luminosity-size (P-D) diagram, for , along with the locations of sources in the Revised Revised Third Cambridge (3CRR) catalogue of Laing, Riley & Longair (1983)33 3 http://3crr.extragalactic.info/, the definitive list of bright radio sources in the northern sky at 178 MHz. The 3CRR catalogue has been chosen for comparison to the IFRS population due to the large amounts of photometry which are available on a significant number of bright radio sources. The break luminosity between Fanaroff-Riley Class I and Class II sources (FRI/FRII) is shown, adjusted to a 1.4-GHz value of W Hz-1 sr-1 using . The flat, steep and USS sources are shown separately.
The typical upper limit on linear size for the IFRSs is kpc at any redshift, and it is clear from Fig. 5 that the majority of 3CRR sources are too large to represent local versions of the IFRSs. In the following sections we model each class of source in turn, using spectral energy distributions of suitable sources from the 3CRR catalogue in order to demonstrate that IFRSs can be modelled as being high-redshift versions of well-studied local sources. Throughout this modelling, we fix the luminosity of the template 3CRR sources to match the radio flux density constraints for each IFRS, and use sources from Table 1 which have not been classified as having possible infrared counterparts where possible, since they are the more extreme examples of IFRSs.
4.2 Modelling the flat-spectrum sources
Norris et al. (2007) claimed that, based on their 1.4-GHz detection and 3.6-m limit, the IFRS population may be represented by a high-redshift version of 3C273. This source is a radio-loud quasar located at (Strauss et al., 1992), with a single radio jet visible with linear size kpc (Bahcall et al., 1995), 1.4-GHz flux density of 45 Jy (Kellermann, Pauliny-Toth & Williams, 1969), and spectral index of , giving it a luminosity of W Hz-1 sr-1. It is not actually in the 3CRR catalogue due to its low declination, but has similar properties to the flat-spectrum IFRSs (although it is slightly larger than the linear size constraints from Fig. 5). We have a number of additional constraints on the spectra of IFRSs compared with Norris et al. (2007):
- 1.
We have radio detections of J171453.8594329 (the IFRS which fitted the spectra of 3C273 most successfully) at both 610 MHz and 1.4 GHz. The luminosity of 3C273 was reduced by a constant (redshift-dependent) factor in order to match these observations.
- 2.
We required that the 1.4-GHz luminosity of the reduced version of 3C273 was great enough to remain above the FRI/FRII break luminosity. If the luminosity was to be reduced below this level, the FRII SED of 3C273 would be modelling a radio galaxy with the luminosity of an FRI source, which would be inappropriate.
- 3.
We place infrared upper limits on the IFRS population in the IRAC and MIPS bands, between observation-frame wavelengths of 3.6 and 160 m.
- 4.
We have optical detections, or upper limits, in the -band, which further constrains the redshift of each source.

We obtained photometry on 3C273 from NED for comparison with the IFRS data, and placed it at redshifts between 0 and 8, to examine how the SED that would be observed changes with redshift. Fig. 6 shows the observed SED of 3C273, and the SED that would be observed if 3C273 was placed at , and reduced in luminosity by a factor of 15 (to a 1.4-GHz luminosity of W Hz-1 sr-1). This is a lower limit to the redshift of the source (based upon fitting the optical/infrared photometry). Once the redshift is great enough that the SED shape can be fitted successfully, there is a degeneracy between the redshift and luminosity of the source, with the luminosity of 3C273 requiring a smaller amount of scaling at greater redshifts. The other flat-spectrum IFRSs can also be modelled with the SED of 3C273, with similar lower limits being placed on their redshift. The compact flat-spectrum sources in the 3CRR catalogue were also tested to see whether they could successfully model the flat-spectrum IFRS population, but less photometry was available on these sources, and none of them was as good a fit to the data as 3C273. Since the 3CRR catalogue contains the brightest (low-frequency) sources in the sky, it should not be suprising that the flat-spectrum sources contained within it need to have their luminosity reduced significantly in order to fit the IFRSs. In carrying out the modelling in this section, we have assumed that a reduction in luminosity by a factor of 15 does not fundamentally alter the properties of the quasar being modelled – it would be preferable to use lower-luminosity sources for this modelling, however there are few radio sources in the sky that have been as well-studied at optical and infrared wavelengths as the 3CRR catalogue.
4.3 Modelling the steep-spectrum sources
There are six steep-spectrum sources with within the IFRS sample, which follow very similar tracks in the P-D diagram. The 3CRR catalogue contains several local sources with steep spectra and linear size 20 kpc, with both FRI and FRII sources satisfying the linear size requirements, and it is necessary to test both forms of SED in order to determine which class of source best represents the IFRS population.
Fig. 7 shows the spectrum of 3C305, an FRI radio galaxy at (Miller et al., 2002), which has been placed at , and reduced in luminosity slightly (by a factor of 1.5). While the radio detections and far-infrared flux limits can be matched, the mid-infrared and optical limits placed on the IFRS J172315.5590919 are inconsistent with the flux that would be observed from this source. No improvement was found to be possible at other redshifts. In contrast to this, Fig. 8 shows the spectrum of 3C67, an FRII radio galaxy at (Hewitt & Burbidge, 1991), which has been placed at and reduced in luminosity by a factor of 4.2. All of the available photometry can now be fitted successfully, demonstrating that the steep-spectrum sources are better fitted by FRII templates than by FRI templates. A successful fit is also possible with 3C67 placed at lower redshifts (i.e. 3C67 at would require a reduction in the total luminosity by a factor of to fit the radio data), but the origin of the optical and radio luminosities in FRII galaxies is very different and this amount of luminosity scaling may not be justified. The lower limit on redshift for this source is , placed by requiring the 1.4-GHz radio luminosity to remain above the FRI/FRII break.


4.4 Modelling the ultra-steep spectrum sources
There are three sources within the IFRS sample with . One of these, J171928.4583927, has a spectral index of and is better fitted by the SED of 3C67 than to any of the 3CRR USS sources, while the other two have spectral indices of 1.37 and 1.38. The 3CRR catalogue only contains two compact sources with ultra-steep spectra – of the two, 3C186 (Lynds et al., 1966, an FRII source at ;) has more available photometry, and Fig. 9 demonstrates that it is possible to fit the radio and optical data for IFRS J171315.5590302, along with the 3.6-m IRAC infrared limit, by placing 3C186 at and reducing its luminosity by a factor of 90. As seen in previous sections, placing the source at higher redshift allows this luminosity scaling to be reduced while still being able to fit the observed photometry – at the luminosity of 3C186 needs to be reduced by a factor of , while at the luminosity only needs to be reduced by a factor of .

4.5 Comparison with the ‘Optically Invisible’ radio sources of Higdon et al. (2005)
Higdon et al. (2005) describe a population of sources which are radio-bright but ‘optically invisible’, with the majority of their optically-invisible radio sources (OIRSs) also being undetected in the mid-infrared with MIPS. While the majority of their OIRSs are not particularly radio-bright, there are two sources with 1.4-GHz flux density mJy, with no detections in optical images having , , (Vega magnitudes), or at 24 m, with mJy44 4 There are two further radio sources with mJy and no optical detections, outside the coverage area of MIPS, and one further source which is described as an OIRS in Higdon et al. (2005), but no longer thought to be one by Higdon et al. (2008).. Higdon et al. (2005) conclude that these sources are powered by AGN activity (principally based upon the non-detections at 24 m). IRAC information is added to the OIRS sample by Higdon et al. (2008), who find that at least 34 per cent of the sources do not have detections at 3.6 m. They conclude that the OIRSs which are undetected by IRAC appear to represent a population of powerful radio galaxies, at .
The Infrared-Faint and Optically-Invisible radio source populations appear to be similar in nature, although with slightly different selection effects. While it remains to be confirmed that these sources are high-redshift radio galaxies (potentially through extremely deep multi-wavelength optical and infrared observations), it is not necessary to require new, exotic source types in order to explain the IFRS or OIRS population.
5 Conclusions
We confirm the existence of a class of bright radio sources which are undetected in deep infrared images. These sources are rare – we find a total of 14 sources with mJy and no clear infrared counterparts. Ten of these have a flux density of greater than 1 mJy, a source density of roughly 2.5 deg-2, and comparable to the source density of bright IFRSs found by Norris et al. (2006) and Middelberg et al. (2008). There are eight sources with mJy that show no evidence for possible infrared counterparts in the deep IRAC images of the Spitzer extragalactic First Look Survey field.
We use source stacking to place upper limits on the mid-infrared flux densities of these sources, and use either detections or upper limits in the -band to further constrain the SED of each source. By using multi-frequency radio data, we demonstrate that the sources vary in type between flat-spectrum quasars with , and USS radio sources with , and should not be thought of as a single source population.
The possibility that the Infrared-Faint Radio Source population is made up of high-redshift luminous radio galaxies appears increasingly likely – the lack of detection in infrared images would seem to rule out highly obscured star-forming galaxies, while the existence of flat-spectrum sources implies that at least some of the sources have an AGN origin. We place upper limits on their overall linear size through the knowledge of their maximum deconvolved angular size from the Condon et al. (2003) 1.4-GHz catalogue, and show that they must be kpc at any redshift, making them smaller than the majority of bright radio sources in the local Universe, as given by the 3CRR catalogue. By looking at the locations of these sources in a P-D diagram, for a range of redshifts, we identify bright local radio sources with similar characteristics, and demonstrate that all three classes of IFRS can be modelled as less-luminous versions of well-studied Fanaroff-Riley Type II radio galaxies placed at high redshift.
Acknowledgments
TG thanks the UK STFC for a Studentship. We thank the staff of the GMRT who have made these observations possible. The GMRT is operated by the National Centre for Radio Astrophysics of the Tata Institute of Fundamental Research, India. This work has made use of the NASA/IPAC Extragalactic Database (NED) which is operated by the Jet Propulsion Laboratory, California Institute of Technology, under contract with the National Aeronautics and Space Administration.
References
- Appleton et al. (2004) Appleton P. N., et al., 2004, ApJS, 154, 147
- Bahcall et al. (1995) Bahcall J. N., Kirhakos S., Schneider D. P., Davis R. J., Muxlow T. W. B., Garrington S. T., Conway R. G., Unwin S. C., 1995, ApJ, 452, L91
- Becker et al. (1995) Becker R. H., White R. L., Helfand D. J., 1995, ApJ, 450, 559
- Bertin & Arnouts (1996) Bertin E., Arnouts S., 1996, A&AS, 117, 393
- Beswick et al. (2008) Beswick R. J., Muxlow T. W. B., Thrall H., Richards A. M. S., Garrington S. T., 2008, MNRAS, 385, 1143
- Blundell et al. (1998) Blundell K. M., Rawlings S., Eales S. A., Taylor G. B., Bradley A. D., 1998, MNRAS, 295, 265
- Condon (1992) Condon J. J., 1992, ARA&A, 30, 575
- Condon et al. (1998) Condon J. J., Cotton W. D., Yin Q. F., Perley R. A., Taylor G. B., Broderick G. B., 1998, AJ, 115, 1693
- Condon et al. (2003) Condon J. J., Cotton W. D., Yin Q. F., Shupe D. L., Storrie-Lombardi L. J., Helou G., Soifer B. T., Werner M. W., 2003, AJ, 125, 2411
- de Breuck et al. (2000) de Breuck C., van Breugel W., Röttgering H. J. A., Miley G., 2000, A&AS, 143, 303
- Dunkley et al. (2008) Dunkley J., et al., 2008, ApJS, submitted (astro-ph/0803.0586v1)
- Fadda et al. (2006) Fadda D., et al., 2006, AJ, 131, 2859
- Fadda et al. (2004) Fadda D., Jannuzi B. T., Ford A., Storrie-Lombardi L. J., 2004, AJ, 128, 1
- Fanaroff & Riley (1974) Fanaroff B. L., Riley J. M., 1974, MNRAS, 167, 31P
- Fazio et al. (2004) Fazio G., et al., 2004, ApJS, 154, 10
- Frayer et al. (2006) Frayer D. T., et al., 2006, AJ, 131, 250
- Garn & Alexander (2008) Garn T., Alexander P., 2008, MNRAS, submitted
- Garn et al. (2008) Garn T., Ford D. C., Alexander P., 2008, MNRAS, submitted
- Garn et al. (2007) Garn T., Green D. A., Hales S. E. G., Riley J. M., Alexander P., 2007, MNRAS, 376, 1251
- Hewitt & Burbidge (1991) Hewitt A., Burbidge G., 1991, ApJS, 75, 297
- Higdon et al. (2005) Higdon J. L., et al., 2005, ApJ, 626, 58
- Higdon et al. (2008) Higdon J. L., Higdon S. J. U., Willner S. P., Brown M. J. I., Stern D., Le Floch’h E., Eisenhardt P., 2008, ApJ, submitted (astro-ph/0806.2138v1)
- Jarvis & McLure (2002) Jarvis M. J., McLure R. J., 2002, MNRAS, 336, L38
- Kellermann et al. (1969) Kellermann K. I., Pauliny-Toth I. I. K., Williams P. J. S., 1969, ApJ, 157, 1
- Klamer et al. (2006) Klamer I. J., Ekers R. D., Bryant J. J., Hunstead R. W., Sadler E. M., de Breuck C., 2006, MNRAS, 371, 852
- Lacy et al. (2005) Lacy M., et al., 2005, ApJS, 161, 41
- Laing et al. (1983) Laing R. A., Riley J. M., Longair M. S., 1983, MNRAS, 204, 151
- Lonsdale et al. (2003) Lonsdale C. J., et al., 2003, PASP, 115, 897
- Lynds et al. (1966) Lynds C. R., Hill S. J., Heere K., Stockton A. N., 1966, ApJ, 144, 1244
- Middelberg et al. (2008) Middelberg E., et al., 2008, AJ, 135, 1276
- Miller et al. (2002) Miller N. A., Ledlow M. J., Owen F. N., Hill J. M., 2002, AJ, 123, 3018
- Morganti et al. (2004) Morganti R., Garrett M. A., Chapman S., Baan W., Helou G., Soifer T., 2004, A&A, 424, 371
- Norris et al. (2006) Norris R. P., et al., 2006, AJ, 132, 2409
- Norris et al. (2007) Norris R. P., Tingay S., Phillips C., Middelberg E., Deller A., Appleton P. N., 2007, MNRAS, 378, 1434
- Rengelink et al. (1997) Rengelink R. B., Tang Y., de Bruyn A. G., Miley G. K., Bremer M. N., Röttgering H. J. A., Bremer M. A. R., 1997, A&AS, 124, 259
- Rieke et al. (2004) Rieke G. H., et al., 2004, ApJS, 154, 25
- Röttgering et al. (1994) Röttgering H. J. A., Lacy M., Miley G. K., Chambers K. C., Saunders R., 1994, A&AS, 108, 79
- Seymour et al. (2004) Seymour N., McHardy I. M., Gunn K. F., 2004, MNRAS, 352, 131
- Strauss et al. (1992) Strauss M. A., Huchra J. P., Davis M., Yahil A., Fisher K., Tonry J., 1992, ApJS, 83, 29
- Tielens et al. (1979) Tielens A. G. G. M., Miley G. K., Willis A. G., 1979, A&AS, 35, 153
- Werner et al. (2004) Werner M., et al., 2004, ApJS, 154, 1
- White et al. (2007) White R. L., Helfand D. J., Becker R. H., Glikman E., de Vries W., 2007, ApJ, 654, 99