VRIJHK PHOTOMETRY OF PKS 0537-441 AND PKS 2155-304 IN 2006-2008
Abstract:
We report the 2006-2008 light curves obtained with the REM telescope in VRIJHK bands for the two BL Lac objects PKS 0537-441 and PKS 2155-304
April 22-25 2008
Palaiseau, France
1 Introduction
Since 2004 we are using the Rapid Eye Mount robotic telescope (REM, la Silla Chile, Zerbi et al 2004),
for an intensive Blazar monitoring program in near-infrared (JHK) and optical (IRV) bands (see Tosti, these proceedings).
The remarkable activities of PKS 0537- 441 (z=0.896), and PKS 2155-304 (z=0.116) observed with REM in 2004-2005
are described in Dolcini et al. (2005, 2007) and in Pian et al (2007).
Here we report preliminary results obtained for these two sources in 2006-2008.
2 PKS 0537-441
The light curves in the six bands are reported in fig.1. Typical photometric errors are 5 .
The 2007 November and the December observations clearly indicate the decaying part of a large flare.
At its maximum the source was close to the peak of the flaring state detected in February 2005 and reported
by Dolcini et al.2005. The decay time ( 40 days) and the magnitude variation m 1.8 mag are also similar.
In February -March 2008 the source is in a brightening phase.
It increased by 2.3 mag in 17 days in the V band.
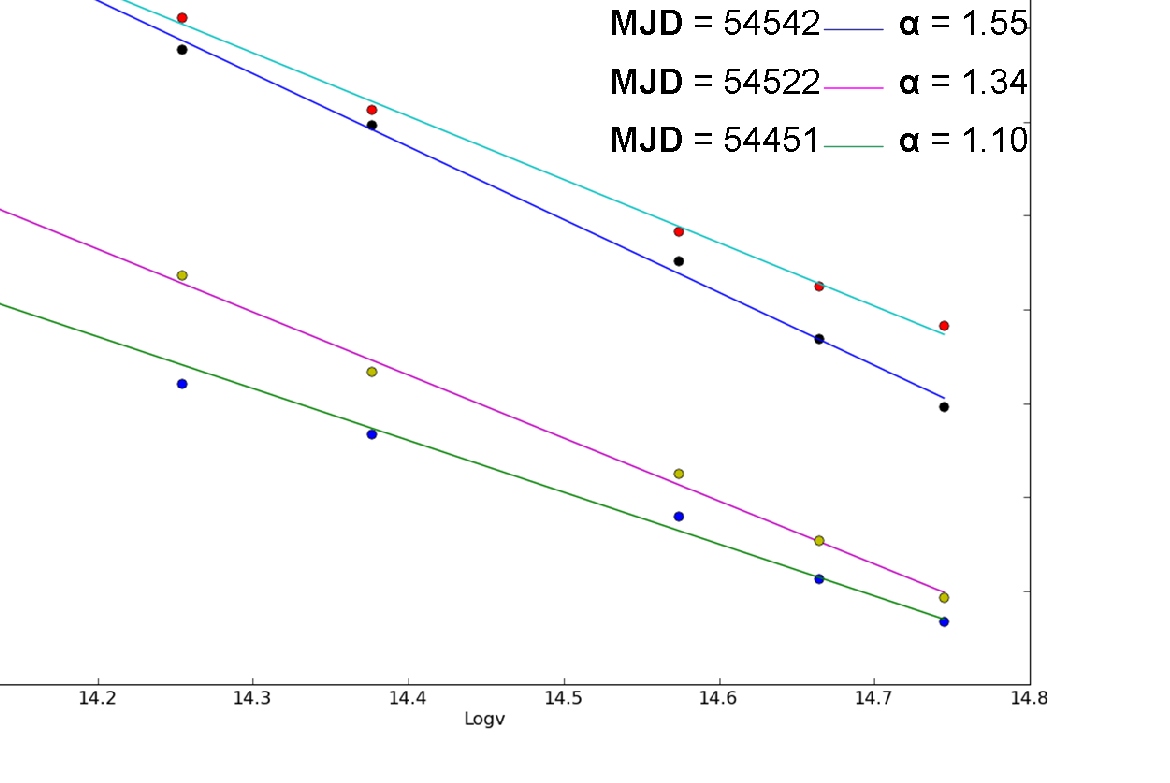
Spectral energy distributions in four intensity states are reported in figure 2, with a power law best fit. The tendency of the source of
becoming harder at higher fluxes reported by Dolcini et al. 2005, is clearly contrasted.
The February-March 2008 observing period is simultaneous with an AGILE exposure of the source.
3 PKS 2155 -304
The light curves are given in fig.3.
The source appears very active in August Nov 2006, reaching a maximum of V= 12.02 mag.
Note that at the end of July 2006 a large TeV flare was detected by Aharonian et al. 2007
(see also Foschini et al. 2007 and 2008, Sakamoto et al. 2008), but no REM data are available.
The observations 2006 November 4 are simultaneous with an X-ray spectrum taken with Newton XMM
(Zhang et al. 2008, Foschini et al 2008), which may represent a transition from HBL to LBL behavior.
No special features appear in the optical bands.
During our monitoring the source was variable in all bands with a excursion of m 1.2 mag.
In 2005, Dolcini et al. (2007) reported a flare lasting several days, which was more prominent in the infrared bands.
Such rather unexpected behavior does not appear in 2006-2007 (see the V-K light curve given in figure 4).
References
- [1]
Aharonian F., Akhperjanian A. G. et al., 2007, ApJ 664, L71.
- [2]
Foschini L., Ghisellini G., Tavecchio F., et al., 2007, ApJ 657, L81.
- [3]
Foschini L., Treves, A., Tavecchio F., et al., 2008, ApJ 484L, 35 F.
- [4]
Dolcini A., et al. 2005 A & A 443, L33-L36.
- [5]
Dolcini A., Farfanelli, F., Ciprini S. et al., 2007, A & A 469, 503D.
- [6]
Pian E., Romano P., Treves A., et al., 2007 ApJ 664, 106-116.
- [7]
Sakamoto Y., Nishijima K., Mizukami T., et al., 2008, ApJ 676, 113.
- [8]
Zerbi F. M., et al., 2004, Proceedings of the SPIE, 5492,1590.
- [9] Zhang 2008 [arxiv 0804.3626].