Intrinsic absorption in 3C 279 at GeV-TeV energies and consequences for estimates of the EBL
Abstract
We revisit the limits of the level of the extragalactic background light (EBL) recently reported by the MAGIC collaboration based on the observed -ray spectrum of the quasar 3C279, considering the impact of absorption of high-energy -ray photons inside the broad line region (BLR) of the quasar. We use the photoionization code CLOUDY to calculate the expected optical-UV radiation field inside the BLR and the optical depth to -rays for a relatively extended set of the parameters. We found that the absorption of -ray photons, though important for the estimate of the true radiative output of the source, does not produce an important hardening of the spectrum of 3C279 in the energy band accessible by MAGIC, supporting the method used to infer the upper limits to the level of the EBL.
Keywords:
quasars: individual: 3C279 – gamma rays: observations – gamma rays: theory – diffuse radiation1 Introduction
The detection of 3C279 (=0.536) in the very high energy (VHE, GeV) band by the MAGIC telescope (Albert et al. 2008) extends to the quasars the group of the known extragalactic VHE sources, before limited to BL Lac objects (excluding the nearby radiogalaxy M87)11 1 see http://www.mppmu.mpg.de/rwagner/sources.
For some aspects, the detection of 3C279 comes as a surprise. General theoretical arguments support the view that quasars cannot be important VHE emitters, in particular because of the expected absorption, through the pair production process , inside the source itself (among the most recent calculations, e.g., Donea & Protheroe 2003, Liu & Bai 2006, Reimer 2007). Moreover, quasars are generally located at a relatively high redshift, implying a huge absorption by the extragalactic background light (EBL, e.g. Kneiske et al. 2004, Primack et al. 2005, Stecker et al. 2006, Franceschini et al. 2008). Last, but not least, widely adopted standard leptonic models for production of -rays in 3C279 (Hartman et al. 2001, Ballo et al. 2002; see also Tavecchio & Ghisellini 2008, hereafter TG08) do not predict an important emission above few tens of GeV, because of the rapid decrease of the scattering cross section (for hadronic scenarios see, e.g. Mannheim 1993). The observation of VHE photons from 3C279 by MAGIC (Albert et al. 2008) demonstrates that also quasars can, to some extent, produce high-energy -rays and suggests that the opacity (both intrinsic and cosmic) is less strong than what previously assumed.
The detection of a source of VHE photons at a relatively high redshift offers a unique tool to probe the still poorly known EBL. Albert et al. (2008) used general arguments based on a limiting spectral slope for the emitted spectrum to infer the amount of extragalactic absorption22 2 See Stecker & Scully (2008) for an alternative interpretation.. However, as recently pointed out by Aharonian et al. (2008) (see also Bednarek 1997), intrinsic absorption of -ray photons inside the source could result in rather hard observed spectra. Such spectra affected by absorption could lead to severely underestimate the level of the EBL when the arguments based on the hardness of the spectrum are used. For this reason, the use of the measured spectrum to constrain the EBL in Albert et al. (2008) triggered some discussion on the role and strength of the internal absorption in this source (Liu et al. 2008, Sitarek & Bednarek 2008).
We emphasize that the absorbed spectrum will be harder than the intrinsic one only in the case of an optical depth decreasing with energy, . Thus, as long as the optical depth increases (or, at least, only slightly decreases) with energy, the resulting spectrum will be softer (or slightly harder) than the intrinsic one and the standard spectral methods to constrain the EBL could be safely used. It is thus clear that the shape of , strictly related to the spectrum of the target photons, is the key element to assess the effects of absorption on these methods.
Previous attempts to calculate intrinsic absorption in the BLR (Liu & Bai 2006, Reimer 2007, Liu et al. 2008) assumed rather idealized templates for the BLR spectrum, considering the most prominent emission lines but neglecting the important contribution of the optical-UV continuum. In a recent paper, Sitarek & Bednarek (2008) include the absorption in a self-consistent model for the high-energy emission of 3C279. They consider in detail the geometry of the radiation fields inside the BLR, including also the contribution of direct and scattered radiation of the accretion disc, but, again, they model the BLR radiation with the simplified template of Liu & Bai (2006).
In this work (Sect. 2) we explore the effects of absorption using more realistic spectra of the BLR calculated with the photoionization code CLOUDY (Ferland et al. 1998), previously used to study in detail the inverse Compton emission from powerful blazars (TG08). In particular, we show that the IR-optical-UV continuum plays an important role in determining the absorption, resulting in an almost constant optical depth in the broad energy range 30 GeV–30 TeV. In Sect. 3 we use the spectra corrected for absorption to revisit the constraints on the EBL based on the spectrum of 3C279 derived in Albert et al. (2008). In Sect. 4 we discuss the results.
2 Intrinsic absorption
2.1 The model

We calculate the diffuse radiation field inside the BLR of 3C279 for different values of the BLR radius, temperature of the accretion disk, slope of the illuminating UV radiation. We refer to TG08 for a full description of the model. We assume the geometry shown in Fig.1. The accretion flow illuminates the BLR clouds (characterized by the total hydrogen density and the hydrogen column density ) isotropically filling the BLR, assumed to be a thin spherical shell with inner radius . In the calculation we assume that the clouds cover a fraction of the solid angle viewed from the central illuminating source. The emission from the illuminated face of the clouds is calculated with version 05.07 of CLOUDY, described by Ferland et al. (1998)33 3 See also http://www.nublado.org. For simplicity, we discuss only the case of solar abundance and in all calculations we fix cm-3 and cm-2. Results do not substantially change for different densities and column densities (see TG08). We adopt the spectrum of the illuminating continuum modeled as a combination of a UV bump (with slope ) with a flat X-ray power-law, , commonly assumed in these calculations (AGN model in CLOUDY, e.g. Korista & Goad 2001 and references therein). When not explicitly noted, the disk is assumed to have the “standard” temperature K.
We assume that the disk in 3C279 emits a total luminosity erg/s (Pian et al. 1999). More uncertain is the radius of the BLR. The empirical relations connecting the luminosity of the disk and (Bentz et al. 2006, Kaspi et al. 2007) provide cm. Given these uncertainties, below we show the results for four different values of , cm.
The optical depth for the photon-photon absorption, , is calculated as (e.g., Liu & Bai 2006):
| (1) |
where is the energy of the -rays, is the distance of the photons from the BH, is the number density of the radiation for solid angle at each location of the photon path, is the cross section and . Note that, given the characteristics of the cross section, for a fixed geometry with , that is the optical depth reflects the spectrum of the soft photon field (smeared by the cross section).
To calculate from Eq.(1) one has to specify the location of the source, . All calculations discussed below have been performed with cm. Larger values of (a source closer to the BLR) result in a lower level of the absorption, but do not essentially affect the shape of . For smaller values of one should also consider the absorption induced by photons directly coming from the accretion disk (Ghisellini & Madau 1996, Sitarek & Bednarek 2008). However, absorption from the disk is characterized, for the considered range of energies, by an optical depth monotonically increasing with energy (Sitarek & Bednarek 2008). As already discussed, in this conditions the resulting spectrum is softer than the emitted spectrum and thus it does not affect the constraints on the EBL.
Note that, for simplicity, we neglect the effects related to the radiative transfer inside the emission region (negligible as long as the size of the source is much less than ). Another possible effect that we do not take into account is that in the case of a moving source (as in the standard “internal shock” scenario, Spada et al. 2001), photons emitted at different times will also be characterized by different in Eq.1 and thus will suffer a different level of intrinsic absorption. The study of these effects, in part already considered by Sitarek & Bednarek (2008), is important in view of the interpretation of the time-resolved spectra soon available thanks to the Fermi Gamma-ray Space Telescope.
2.2 Results
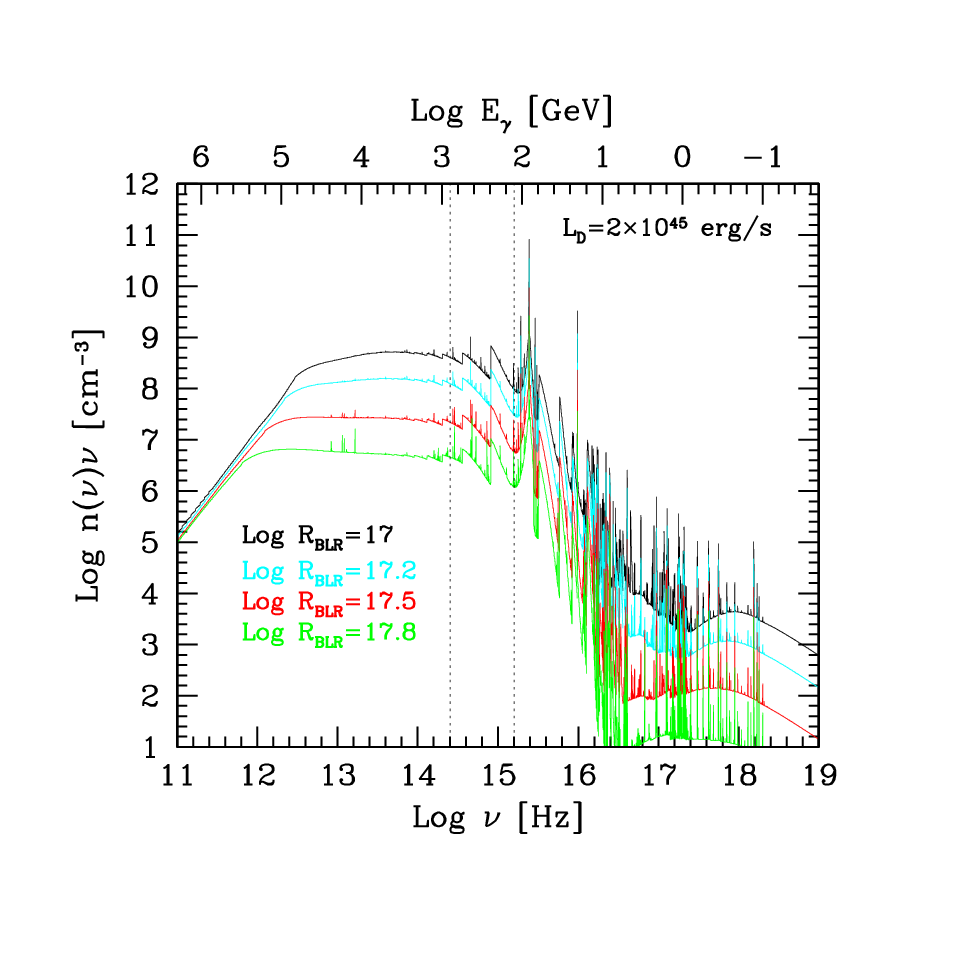
As an example, Fig.2 reports some BLR spectra derived with the model, assuming K, , , cm, plotted as the number photon density, . The two vertical lines indicate the spectral range interesting for absorption of -rays in the energy range covered by the MAGIC spectrum (upper -axis, in the quasar rest frame). Clearly, besides the emission lines, the continuum (deriving from free-free emission, recombinations and scattering, both Thomson and Reyleigh) provides an important contribution especially at low frequencies, below the Ly line. In particular, in the UV band the dominant contribution comes from Thomson and Rayleigh scattering (e.g. Korista & Ferland 1998), whereas at IR-optical frequencies (in the range Hz), the emission is generally dominated by optically thin free-free emission plus a contribution from Thomson scattering. The result is that the curves are almost flat below the UV band, translating in an almost constant, or slightly increasing, optical depth for a rather broad interval of energies.
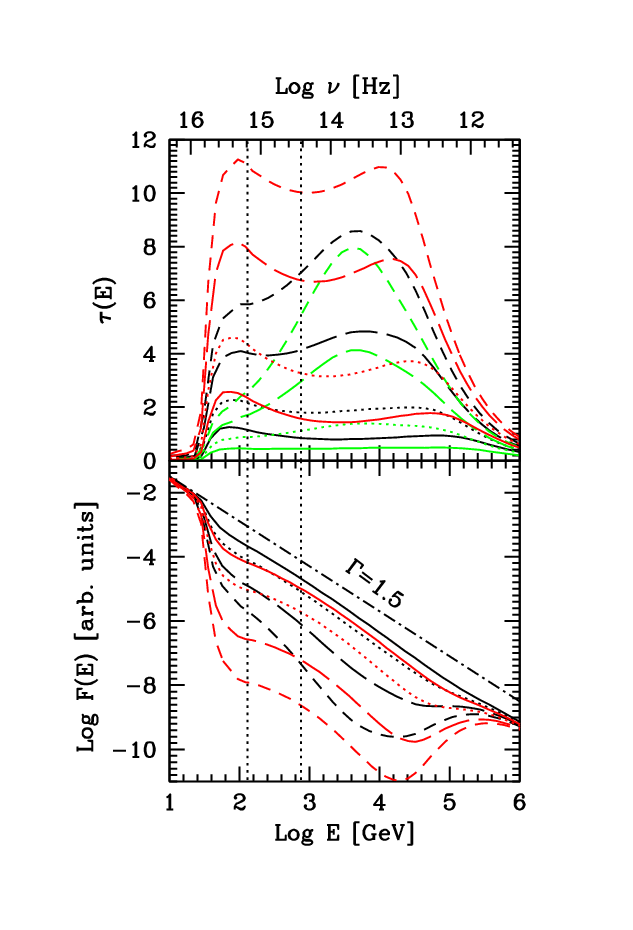
Fig.3 illustrates some examples of the optical depth, (upper panel) and the corresponding absorbed spectra, assuming an intrinsic photon spectrum (lower panel). Different line styles and colours refer to different parameters. Short dashed, long dashed, dotted and solid lines are for , cm, respectively. Black lines refer to the “standard” (S) scenario, with (Elvis et al. 1994) and K. Red lines (“extreme” case, E) are calculated for a somewhat extreme value of the UV slope, (slope expected from a standard thin disk), while green lines report the results for a “low temperature” case (L), K (and ).

A common feature of these curves is the sudden increase of starting around GeV, energy at the threshold for photons of the Ly line. After reaching the maximum around 100 GeV, displays a decreasing branch, just centered on the energy range covered by the MAGIC spectrum (vertical lines). Without the contribution of the continuum at frequencies below the Ly line, the optical depth would fast decrease, determining a very hard observed spectrum above 100 GeV (rest frame), as in the model of Aharonian et al. (2008). However, the important contribution of the continuum produces a bump extending above the TeV band, hampering an important hardening of the out-coming -ray spectrum (Fig.3, lower panel).
Some general characteristics of the optical depth in the “line-dominated” (below 100 GeV) and the “continuum dominated” (above 100 GeV) regions are clearly evident in these curves. The “line-dominated” bump is strongly depressed in the L case. This is due to the small fraction of photons above the Ly energy, with the subsequent depression of the luminosity of the Ly line. In this case the optical depth is always increasing with energy in the interesting energy range. Another trend is visible by comparing the curves corresponding to the S and the E case: in the latter the ‘line-dominated” component is systematically more prominent than in the S case. The reason is that, for the same luminosity, the hard illuminating continuum in the E case has a larger fraction of photons above the Ly energy than in the S case. A third trend visible in Fig.3, especially for the L and the S curves, is the increasing role of the “continuum dominated” region when decreases. The reason of this effect is the increasing number of free electrons available for scattering and free-free emission due to the increasing ionization at small radii. For the E case the importance of this effects is partly reduced, because of the paucity of the small optical-IR flux of the illuminator.
As we have already stressed, the hardening of the spectrum is realized for decreasing values of the optical depth with energy. The key parameter determining the slope of the optical depth (and thus the slope of the modified -ray spectrum) at energies above GeV is the ratio between the optical depth in the “line-dominated” bump and in the “continuum dominated” region. This is a robust consequence of the realistic models of the BLR radiation considered here. Therefore the hardest spectra will be observed in the cases of the largest value of the ratio line/continuum. As discussed above these conditions are realized for large temperatures of the disk and hard UV slopes. Case E can then be considered a conservative upper limit for the calculations.
Besides the spectral modifications, an important aspect to consider is also the level of the absorption. In general, smaller radii imply larger absorption, since . In the case of the smaller radius considered here, cm, fluxes are depressed by more than 2 orders of magnitude for the S and the E cases, pushing the power requirements of the source to above erg/s. The absorption in the MAGIC band is instead limited in the case of the L case. For the largest radius, cm, the requirements are still large for the E case (), while for the other two cases the absorption is modest.
3 Limits to the EBL
In the following we discuss the effect of absorption on the constraints for the EBL. We use the EBL model from Kneiske et al. (2004), modified in Albert et al. (2008) to represent an upper limit of the EBL level, which is in the same time a lower limit on the transparency of the universe to VHE -rays. Using this particular EBL model we examine different scenarios of the internal absorption discussed above and revisit a possibility to emit corresponding VHE spectra. From the discussion above it is clear that the modification of the spectrum in the E case should be considered a conservative upper limit to the real case. The L case is not considered since it always leads to softer spectra. Moreover we conservatively consider only the cases for which the ratio of the absorbed and the emitted flux in the MAGIC band is larger than (corresponding to ).
For the discussed scenarios of the internal absorption, we reconstructed the intrinsic spectrum of 3C279. First, we corrected the measured energy spectrum (Albert et al. 2008) for a given EBL model, corresponding to the maximum allowed level derived in that paper. In such a way we reconstruct the energy spectrum which escapes the vicinity of 3C279 towards the observer. In the next step, we corrected this spectrum for the intrinsic absorption to obtain the original (produced) energy spectrum. Results are shown in Fig.4. As discussed above, it can be seen that different scenarios for the internal absorption mainly affect the flux level of the emission but not the shape of the spectrum. Adopting the test prescription from Mazin & Raue (2007), we tested the resulting intrinsic spectra for the criterion of the hardness () and found that in all tested cases the intrinsic spectra can be excluded. Consequently, identical or even harder EBL limits can be derived as compared to the ones obtained in Albert et al. (2008). Note that for the tests not only the fit value of the slope from a simple power law (PL) was examined but also slope values from a fit by a broken power law (BPL). The latter one was tested in case the BPL fit gave a significantly smaller value44 4 criterion was defined using the likelihood ratio test, for details see Mazin & Raue (2007) than the PL.
4 Discussion
The detection of VHE -rays from 3C279 and EBL constraints derived in Albert et al. (2008) triggered some discussion on the role and strength of the internal absorption in this object (Liu et al. 2008, Sitarek & Bednarek 2008). In this paper, we have calculated various models for the BLR diffuse radiation and applied them for the case of 3C279. We used the code CLOUDY to calculate the models in order to have a realistic energy spectrum of the photons inside of the BLR region. The main difference between our model and those of Liu et al. (2008) and Sitarek & Bednarek (2008) is the assumed BLR spectrum. Liu et al. (2008) assume that the BLR spectrum consists only of narrow lines. Sitarek & Bednarek (2008) present a detailed model for the high-energy emission of 3C279, including also the possible contribution of direct and scattered disc radiation. However, their spectrum of the BLR emission does not include other important contributions to the continuum, such as the free-free emission. As we have shown, our model provides a strong continuum component, extending on the optical-UV band (TG08).
Our results confirm that radiation from the BLR modifies the primary emission of 3C279. However, we find that the internal absorption inside the BLR does not produce an important hardening of the spectrum in the energy band covered by the MAGIC observation. In particular, we found that for the tested BLR models, despite a possible overall softening of the 3C279 spectrum, at least part of the spectrum was significantly above an implied maximum hardness of , confirming the EBL constraints derived in Albert et al. (2008). Of course, the consideration of intrinsic absorption implies that the TeV emission from 3C279 could be substantially more powerful than published.
Note also that conclusions from Sitarek & Bednarek (2008) that an EBL model of Stecker et al. (2006) does not imply an unrealistic intrinsic spectra of 3C279 (when taking into account internal absorption in the BLR) concern the “baseline” EBL model of Stecker et al. (2006). The EBL limits in this paper and in Albert et al. (2008) instead concern the “fast evolution” model of Stecker et al. (2006), implying a significantly higher EBL level in the redshift range between and .
We finally note that the discussion on the role of absorption implicitly assumes that the highly variable high-energy -ray emission detected from 3C279 is produced internally to the BLR (probably through the comptonization of the BLR photons). However, given the small size of the BLR in 3C279 as estimated from the empirical relations connecting it to the disk luminosity, it is conceivable that the emission is (at least in some occasions) produced outside the BLR, thus avoiding the problems connected to absorption. In this case, the mechanism responsible for the production of the observed emission cannot be the external Compton: alternatives include synchrotron self-Compton emission (Lindfors et al. 2006) or comptonization of the IR radiation from the putative dusty torus surrounding the central regions (e.g. Sikora et al. 2002, 2008; Sokolov & Marscher 2005).
Acknowledgements
F.T. is grateful to Gabriele Ghisellini for enlightening discussions and to Laura Maraschi for the critical and constructive reading of the paper. We also thank Elina Lindfors for comments. We thank Gary Ferland for maintaining his freely distributed code CLOUDY. D.M.’s research was supported by a Marie Curie Intra European Fellowship within the 7th European Community Framework Programme.
References
- [\citeauthoryearAharonian et al.2006] Aharonian F., et al., 2006, Natur, 440, 1018
- [\citeauthoryearAharonian, Khangulyan, & Costamante2008] Aharonian F. A., Khangulyan D., Costamante L., 2008, MNRAS, 387, 1206
- [\citeauthoryearAlbert et al.2008] Albert J., Aliu E., Anderhub H., (The MAGIC Collaboration), et al., 2008, Sci, 320, 1752
- [\citeauthoryearBallo et al.2002] Ballo L., et al., 2002, ApJ, 567, 50
- [\citeauthoryearBednarek1997] Bednarek W., 1997, MNRAS, 285, 69
- [\citeauthoryearBentz et al.2006] Bentz M. C., Peterson B. M., Pogge R. W., Vestergaard M., Onken C. A., 2006, ApJ, 644, 133
- [\citeauthoryearDonea & Protheroe2003] Donea A.-C., Protheroe R. J., 2003, APh, 18, 377
- [\citeauthoryearElvis et al.1994] Elvis M., et al., 1994, ApJS, 95, 1
- [\citeauthoryearFerland et al.1998] Ferland G. J., Korista K. T., Verner D. A., Ferguson J. W., Kingdon J. B., Verner E. M., 1998, PASP, 110, 761
- [\citeauthoryearFranceschini, Rodighiero, & Vaccari2008] Franceschini A., Rodighiero G., Vaccari M., 2008, A&A, 487, 837
- [\citeauthoryearGhisellini & Madau1996] Ghisellini G., Madau P., 1996, MNRAS, 280, 67
- [\citeauthoryearHartman et al.2001] Hartman R. C., et al., 2001, ApJ, 553, 683
- [\citeauthoryearKaspi et al.2007] Kaspi S., Brandt W. N., Maoz D., Netzer H., Schneider D. P., Shemmer O., 2007, ApJ, 659, 997
- [\citeauthoryearKneiske et al.2004] Kneiske T. M., Bretz T., Mannheim K., Hartmann D. H., 2004, A&A, 413, 807
- [\citeauthoryearKorista & Ferland1998] Korista K., Ferland G., 1998, ApJ, 495, 672
- [\citeauthoryearKorista & Goad2001] Korista K. T., Goad M. R., 2001, ApJ, 553, 695
- [\citeauthoryearLindfors et al.2006] Lindfors E. J., et al., 2006, A&A, 456, 895
- [\citeauthoryearLiu, Bai, & Ma2008] Liu H. T., Bai J. M., Ma L., 2008, ApJ, in press (arXiv:0807.3133)
- [\citeauthoryearLiu & Bai2006] Liu H. T., Bai J. M., 2006, ApJ, 653, 1089
- [\citeauthoryearMannheim1993] Mannheim K., 1993, A&A, 269, 67
- [\citeauthoryearMazin & Raue2007] Mazin D., Raue M., 2007, A&A, 471, 439
- [\citeauthoryearPian et al.1999] Pian E., et al., 1999, ApJ, 521, 112
- [\citeauthoryearPrimack, Bullock, & Somerville2005] Primack J. R., Bullock J. S., Somerville R. S., 2005, AIPC, 745, 23
- [\citeauthoryearReimer2007] Reimer A., 2007, ApJ, 665, 1023
- [\citeauthoryearSikora, Moderski, & Madejski2008] Sikora M., Moderski R., Madejski G. M., 2008, ApJ, 675, 71
- [\citeauthoryearSikora et al.2002] Sikora M., Błażejowski M., Moderski R., Madejski G. M., 2002, ApJ, 577, 78
- [\citeauthoryearSitarek & Bednarek2008] Sitarek J., Bednarek W., 2008, MNRAS, in press, (arXiv:0807.4228)
- [\citeauthoryearSokolov & Marscher2005] Sokolov A., Marscher A. P., 2005, ApJ, 629, 52
- [\citeauthoryearSpada et al.2001] Spada M., Ghisellini G., Lazzati D., Celotti A., 2001, MNRAS, 325, 1559
- [\citeauthoryearStecker, Malkan, & Scully2006] Stecker F. W., Malkan M. A., Scully S. T., 2006, ApJ, 648, 774
- [\citeauthoryearStecker & Scully2008] Stecker F. W., Scully S. T., 2008, ApJ Letters, submitted (arXiv:0807.4880)
- [\citeauthoryearTavecchio & Ghisellini2008] Tavecchio F., Ghisellini G., 2008, MNRAS, 386, 945 (TG08)