Properties of the molecular gas in a starbursting QSO at z in the COSMOS field
Abstract
Context. Using the IRAM 30m telescope, we have detected the 12CO , , , and emission lines in the millimeter-bright, blank-field selected AGN COSMOS J100038+020822 at redshift . The sub-local thermodynamic equilibrium (LTE) excitation of the level implies that the gas is less excited than that in typical nearby starburst galaxies such as NGC253, and in the high-redshift quasars studied to date, such as J1148+5251 or BR1202-0725. Large velocity gradient (LVG) modeling of the CO line spectral energy distribution (CO SED; flux density vs. rotational quantum number) yields H2 densities in the range cm-3, and kinetic temperatures between 50 K and 200 K. The H2 mass of M☉ implied by the line intensities compares well with our estimate of the dynamical mass within the inner 1.5 kpc of the object. Fitting a two-component gray body spectrum, we find a dust mass of M☉, and cold and hot dust temperatures of 425 K and 16025 K, respectively. The broad MgII line allows us to estimate the mass of the central black hole as M☉. Although the optical spectrum and multi-wavelength SED matches those of an average QSO, the molecular gas content and dust properties resemble those of known submillimeter galaxies (SMGs). The optical morphology of this source shows tidal tails that suggest a recent interaction or merger. Since it shares properties of both starburst and AGN, this object appears to be in a transition from a strongly starforming submillimeter galaxy to a QSO.
Aims.
Methods.
Results. Conclusions. Galaxies: evolution – Galaxies: starburst – Galaxies individual (J100038+020822) – Galaxies: ISM – Galaxies: quasars: emission lines – Galaxies: high-redshift
Key Words.
1 Introduction
Submillimeter blank field surveys have discovered a population of dust enshrouded high-redshift galaxies (Smail et al. 1997; Hughes et al. 1998; Eales et al. 1999), which are massive systems with huge molecular gas reservoirs and star formation at high rates (Neri et al. 2003; Greve et al. 2005; Solomon & Vanden Bout 2005). Their faint X-ray emission (Alexander et al. 2005) suggests that most of the submillimeter output is not powered by active galactic nuclei (AGN), but by massive star formation. These starbursting submillimeter galaxies (SMGs) account for a substancial fraction of the far-infrared (IR) background, and current models suggest this population may represent the formation of massive spheroidals at high-redshift (Dunlop 2001).
In the local Universe, an evolutionary connection between starbursting ultraluminous infrared galaxies (ULIRGs) and QSOs has been suggested (Sanders et al. 1988a) and discussed controversially (Sanders et al. 1988a; Sanders et al. 1988b; Genzel et al. 1998; Tacconi et al. 2002, e.g.). This evolutionary cycle has found support from hydrodynamical simulations of galaxy formation (Di Matteo et al. 2005; Hopkins et al. 2005; Hopkins et al. 2006, e.g.) and observations (Sanders et al. 1988a; Page et al. 2004; Stevens et al. 2005).
The ubiquitous presence of AGN activity in most SMGs (Alexander et al. 2005) suggests a close link between the AGN and starburst activity at redshifts . If a QSO is found to be far-IR luminous, it means that large amounts of gas and dust should still be present. Such a source may, in fact, be a good candidate for an object in the transition from a starburst to a QSO, in particular when it shows absorbed X-ray emission (Page et al. 2004; Stevens et al. 2005). Yet only a few high-redshift composite starburst/AGN have been studied in its molecular and multi-wavelength continuum emission (Rowan-Robinson 2000; Le Floc’h et al. 2007; Coppin et al. 2008).
Observations of carbon monoxide (CO) in galaxies are important probes of the physical conditions of the cold and warm molecular gas in the galactic nuclei and disks. They provide estimates of the total amount of gas available to fuel starburst and/or AGN activity, and the CO line profile and intensity can be used to obtain important information about the galaxy kinematics, such as dynamical mass or size of the emitting region (Solomon et al. 1997; Solomon & Vanden Bout 2005).
Because of their diagnostic value, great efforts have been made to observe CO emission lines in SMGs. These studies have benefited from deep radio continuum imaging (e.g. VLA 1.4 GHz) to locate the SMG accurately (Ivison et al. 2002; Ivison et al. 2005; Ivison et al. 2007), and from the determination of optical spectroscopic redshifts (Chapman et al. 2005, e.g.). Due the small spectroscopic bandwidths of current (sub)millimeter telescopes and interferometers, this was necessary to permit the proper frequency tuning for line observations (e.g. of CO, [CI], [CII]). Yet only 19 SMGs have been reported in CO so far (Frayer et al. 1998; Frayer et al. 1999; Andreani et al. 2000; Sheth et al. 2004; Hainline et al. 2004; Neri et al. 2003; Greve et al. 2005; Frayer et al. 2008; Coppin et al. 2008; Tacconi et al. 2008) and only a few have been observed in multiple molecular transitions to study the excitation conditions of their molecular gas reservoir (Solomon & Vanden Bout 2005). Spatial structure and dynamics were studied for some SMGs through high resolution CO imaging (Tacconi et al. 2006; Tacconi et al. 2008). Overall, only high-redshift () objects have been detected in CO, most of which are luminous, optically selected QSOs (Omont et al. 1996; Guilloteau et al. 1997; Guilloteau et al. 1999; Carilli et al. 2002; Walter et al. 2003; Bertoldi et al. 2003; Beelen et al. 2004; Riechers et al. 2006; Carilli et al. 2007) and high-redshift radio galaxies (De Breuck et al. 2003; De Breuck et al. 2005; Klamer et al. 2005; Papadopoulos et al. 2005, HzRG;).

Here we report the detection of CO , , , and line emission from a millimeter selected QSO, J. Its CO line intensities and flux density ratios allow us to estimate its molecular gas content and its excitation conditions. Its spectral properties suggest that this object may be evolving from a starburst to a QSO.
After a description of the observations in Section 2, we present the molecular gas and dust properties of our source in Sections 3.1 to 3.4. We study its morphology and multi-wavelength properties in Sections 3.5, 3.6 and 3.7. We discuss the results in Section 4 and give a brief summary in Section 5. Throughout, we use a CDM cosmology, km s-1 Mpc-1, and .
2 Observations
2.1 Source selection
Pan-chromatic surveys are essential for an understanding of galaxy properties and their evolution. The cosmic evolution survey (COSMOS) is the first multi-wavelength survey to cover a sufficiently large area () at appropriate depth over nearly the entire electromagnetic spectrum to provide a comprehensive view of galaxy formation and large scale structure (Scoville et al. 2007, see).
As part of the COSMOS project, Bertoldi et al. (2007) mapped the central of the COSMOS field at 1.2 mm (250 GHz) using the Max-Planck millimeter bolometer camera (MAMBO) at the IRAM 30m telescope. An accompanying VLA radio imaging project (Schinnerer et al. 2007, 1.4 GHz to Jy rms;) allowed for the identification of radio counterparts for 24 millimeter sources.
The MAMBO source J100038.01+020822.4 (hereafter: J100038) is one of the strongest millimeter selected sources in COSMOS (boosting corrected mJy).
It hosts an X-ray luminous ( erg s-1), absorbed (log cm-2) AGN that classifies it as an obscured QSO (Brusa et al. 2007; Mainieri et al. 2007), and its optical spectrum is typical of a broad line (BL) AGN (Trump et al. 2007). The relatively faint 1.4 GHz radio emission (Jy) suggests that the millimeter emission arises from a starburst. In fact, the radio-to-millimetre flux ratio can be used as a redshift indicator (Carilli & Yun 1999) that implies , which is consistent with the spectroscopic redshift. Since this is a millimeter selected QSO that has been detected in X-rays (Stevens et al. 2005), it likely constitutes a transitional case from SMG to QSO.
Three independent spectroscopic redshift measurements exist for J100038: (Trump et al. 2007), (Prescott et al. 2006) and (Marco Scodeggio, priv. comm.), which we have averaged to .
2.2 CO observations
The CO observations were performed with the IRAM 30m telescope on Pico Veleta, Spain, during the winter 2006/2007 in good millimeter weather conditions (precipitable water vapor mm). We observed the CO (redshifted to 81.551 GHz) and CO (203.850 GHz) lines simultaneously using the AB receiver configuration, and the CO (163.088 GHz) and CO (244.603 GHz) lines using the CD receiver configuration.
The observations were centered on the optical Subaru band position of J100038 at 10h 00m 38.01s (J2000). The optical position lies 0.04″ away from the VLA 1.4 GHz position. The beam size of the IRAM 30m telescope at 200 GHz and 81 GHz is 12″ and 30″, respectively.
We observed in wobbler switching mode with a wobbler rate of Hz and a wobbler throw of 60″ in azimuth. Due to its proximity to the source, we used Saturn as main pointing and focus calibrator. The pointing was checked every hour and was stable within 3″ during all runs.
Typical values for the system temperatures were 140 K, 400 K, 460 K and 600 K for the 3 mm, 2 mm, and lower and higher 1 mm bands, respectively. We calibrated every 12 minutes with hot/cold absorbers and estimate the fluxes to be accurate to 10% at 3 and 2 mm and 20% at 1 mm. As spectrometers we used the 512 1 MHz filterbanks for the 3 mm receivers, and the 256 4 MHz filterbanks for the 2 and 1 mm receivers (1 GHz bandwidth). We reduced the data using CLASS, removing scans with strongly distorted baselines, substracted linear baselines in the remaining scans and rebinned the averaged spectra to velocity resolutions of 100, 120, 90 and 130 km s-1 for the CO , , and lines, respectively. This led to baseline antenna temperature () rms noise levels of 0.04, 0.17, 0.44 and 0.4 mK. To convert to main beam temperatures, , we multiply by the ratio between the forward and beam efficiencies, , at the observed frequencies. Flux densities were obtained using the conversion factor Jy/K for the IRAM 30m telescope11 1 http://www.iram.es/IRAMES/telescope.html.
| Transition | a | HPBW b | * c | d | e | vFWHM f | g | h | i |
|---|---|---|---|---|---|---|---|---|---|
| [GHz] | [] | [mK] | [mK] | [mJy] | [km s-1] | [Jy km s-1] | 1010 [K km s-1 pc2] | 108 [L☉] | |
| CO | 81.551 | 30.2 | 0.51 | 0.62 | 3.08 | 1.33 | |||
| CO | 163.088 | 15.1 | 1.18 | 1.69 | 8.39 | 3.81 | |||
| CO | 203.850 | 12.1 | 1.46 | 2.33 | 11.56 | 4.87 | |||
| CO | 244.603 | 10 | 1.19 | 2.09 | 10.35 | 4.86 |
Notes: a Observed frequency; b Half power beam width of the IRAM 30m telescope at the observed frequency; c Antenna temperature; d Main beam temperature; e Flux density; f CO line full width half maximum; g Integrated CO intensity ; h CO luminosity; i Integrated CO luminosity.
3 Results and Analysis
Figure 1 shows the resulting spectra and Table 1 summarizes the measured line parameters. The line profiles for the different transitions appear Gaussian and similar to each other, with no signs of velocity structure, as might be expected for a merger and is often found for SMGs (Greve et al. 2005; Weiß et al. 2005a). However, the signal to noise ratio is too low to examine the individual line profiles. Although the CO line appears to be slightly shifted in velocity relative to the other lines, the line widths are very similar, with an average of km s-1. The spectral energy distribution of the CO rotational emission (CO SED) peaks at the transition (Fig. 2 and Table 1). Using the detected CO lines we estimate a systemic CO redshift , which we use throughout this paper.
3.1 Large Velocity Gradient model


To study the molecular gas excitation in J100038 we compared the relative CO line intensities with those predicted by a single component large velocity gradient (LVG) model, assuming spherical geometry. We used the collision rates from Flower (2001) with an ortho-para H2 ratio of 3 and a fixed CO abundance per velocity gradient of pc (km s-1)-1 (Weiß et al. 2005b; Weiß et al. 2007, e.g.).
The best fit to the data is provided by a model with a kinetic temperature, of K and an H2 density, of cm-3 (model A, Fig. 2). Similarly good fits are achieved with K and ) cm-3 (model B), or K and ) cm-3 (model C). They all show a peak in the CO SED at the line, but predict different higher- intensities.
Figure 3 shows the distribution as a function of the kinetic temperature and H2 density. The temperature–density parameter space is degenerate at densities between cm-3 and cm-3. The most likely ranges for the kinetic temperature and the H2 density are to K and to cm-3, respectively.
The CO abundance per velocity gradient relates to the line opacities predicted by the LVG models (Weiß et al. 2007). Higher values of correspond to higher opacities for the high- transitions. From Figure 2 we see that all models predict optically thick conditions and thermalized emission in the lines, consistent with the line SED following and supporting our CO column per velocity gradient selection.
Although the kinetic temperature is poorly constrained, the LVG modelling prediction for the CO line intensity does not strongly depend on the model chosen: Jy km s-1.

3.2 CO Size and Mass
The ratio between the brightness temperatures predicted by the LVG models, , and the observed line temperatures, , yields an estimate of the CO emitting region size. The angular source size is related to the beam size through
| (1) |
The source sizes we thereby compute for the different fit models (A, B and C) and line brightness temperatures agree well, . At the source redshift (), 1″ corresponds to , so that the estimated source size lies in the range of kpc.
The CO luminosity can be derived from the CO line intensity, following Solomon et al. (1997) as
| (2) |
where is the integrated CO line flux in Jy km s-1, is the luminosity distance in Mpc and is the observed line frequency in GHz. Our predicted CO flux Jy km s-1 yields K km s-1 pc2.
The CO luminosity is commonly used to estimate the molecular gas mass. Adopting the conversion factor between CO luminosity and H2 mass, (K km s-1 pc2)-1, that was derived for local ULIRGs (Downes & Solomon 1998), we find an H2 mass of M☉.
From the size estimate of the dense gas region and the average CO line FWHM, km s-1, we can estimate a dynamical mass contained in the emitting region. For a radius of 0.75 kpc we infer a dynamical mass sin-2(i) . For an average inclination angle , this leads to , which agrees well with the CO luminous mass estimate. Assuming a disk-like geometry would lower the dynamical mass estimate by a factor .
The molecular gas mass can thus account for a large fraction () of the dynamical mass out to 0.75 kpc. This result suggests a somewhat larger fraction than in local ULIRGs in which the molecular gas mass represents 16% of the dynamical mass in the nuclear regions (Downes & Solomon 1998).
SMGs and high-redshift QSOs have typical H2 masses, of within a 4 kpc diameter (Greve et al. 2005; Solomon & Vanden Bout 2005), consistent with the value found in our source. Dynamical masses of SMGs and high-redshift QSOs range between 1.0 and 2.0 (Greve et al. 2005; Tacconi et al. 2006; Solomon & Vanden Bout 2005), which also agrees well with the result exposed above. We note that our dynamical mass estimate has been computed assuming a radius of 0.75 kpc unlike the case of typical SMGs and high-redshift QSOs, for which it is computed with a radius of 2 kpc. Scaling to this radius, i.e. adopting a continuous CO distribution, we find that the dynamical mass for J100038 would be , still in agreement with values for SMGs and high-redshift QSOs.
3.3 Dust Continuum
| Band | Flux density | Unit |
|---|---|---|
| IRAC 3.6 m | Jy | |
| IRAC 4.5 m | Jy | |
| IRAC 5.8 m | Jy | |
| IRAC 8.0 m | Jy | |
| MIPS 24 m | mJy | |
| MIPS 70 m | mJy | |
| MIPS 160 m | mJy | |
| Bolocam 1.1 mm | mJy | |
| MAMBO 1.2 mm | mJy | |
| VLA 1.4 GHz | Jy |
† IRAC and MIPS aperture corrected (total) flux densities are from the S-COSMOS data (Sanders et al. 2007); Flux densities at 1.1 mm and 1.2 mm are from Aguirre et al. (2006) and
Bertoldi et al. (2007), respectively; Radio flux is from VLA-COSMOS (Schinnerer et al. 2007).
To study the dust properties of J100038 we use a minimization procedure to fit a 2-component gray-body spectrum to the 5 IR photometric data points from 24 m to 1.2 mm (observed frame). A single component gray-body spectrum does not provide a good approximation to all points. We do not assume optically thin emission (dust optical depth, ) but use the complete expression for the flux density (Weiß et al. 2007, see):
| (3) |
where is the Planck function, is the dust temperature and is the cosmic background temperature at the source redshift, K. We define the apparent solid angle subtended by the source as , with being the equivalent source size which we assume to be 1.5 kpc based on the derived CO size, and the angular distance at the source redshift. The dust optical depth is
| (4) |
where refers to the dust mass, and the dust absorption coefficient has the form . We adopt an emissivity index (Priddey & McMahon 2001) and cm2 g-1 at 250 GHz (Kruegel & Siebenmorgen 1994).
The best fitting model leads to a dominant cold component with K, and a hot component with K. We calculate a dust mass, for the cold component of ; however the mass implied for the hot component is only . Therefore, the cold dust component accounts for almost all the dust mass. We note that for a dust mass of and a size of 1.5 kpc, the emission becomes optically thick () at m (rest frame), supporting our model selection.
The far-IR luminosity can be computed from the modeled flux density as
| (5) |
Integrating from 50 to 1000 m (Omont et al. 2001), we find . Although the contribution from hot dust is only , most of it is provided by the cold dust component with . We note that the selection of different integration limits implies different values for the luminosity, in particular for the hot dust component. If we integrate from 8 to 1000 m (Sanders & Mirabel 1996), we obtain , and for the total, cold and hot component luminosities, respectively.
A substantial difference seems to exists in the dust temperatures observed in SMGs (Kovács et al. 2006; Pope et al. 2006; Blain et al. 2004, 35 K;) and high-redshift QSOs (Omont et al. 2003; Beelen et al. 2006; Wang et al. 2008, 45 K;). This difference could possibly be explained by the fact that starburst galaxies with warmer dust would have their dust emission shifted to shorter wavelengths making them more difficult to detect at submillimeter wavelengths (Blain et al. 2004). If this difference is real, it would imply that the dust properties of J100038 are more consistent with high-redshift QSOs.
3.4 Star Formation Rates and Efficiencies
Assuming that the AGN does not contribute significantly to the heating of the cold and hot dust components and that most of the dust emission is produced by starburst activity, the far-IR luminosity implies an estimate for the star formation rate (SFR). Omont et al. (2001) found the following relation between the far-IR luminosity and the SFR,
| (6) |
where is a function of the initial mass function (IMF) and vary in the range . For , we then find SFR yr-1, well in agreement with the value found using the IR based estimator from Kennicutt (1998), SFR yr-1.
The ratio between the far-IR luminosity and the CO luminosity can be interpreted as a star formation efficiency, SFE (K km s-1 pc2)-1, or in terms of the gas mass implied by the CO luminosity, SFE .
This value is similar to the average value found for local ULIRGs, (Solomon et al. 1997), although it appears to be slightly lower than those obtained for SMGs, (Greve et al. 2005).
The luminosity ratio can also be interpreted as a gas depletion time, Myr. Others (Greve et al. 2005, e.g.) have estimated the gas depletion time in SMGs as Myr, with a range of Myr (Solomon & Vanden Bout 2005), well in agreement with what we find for J100038, but shorter than that found in ULIRGs or normal spirals.
3.5 Optical Morphology

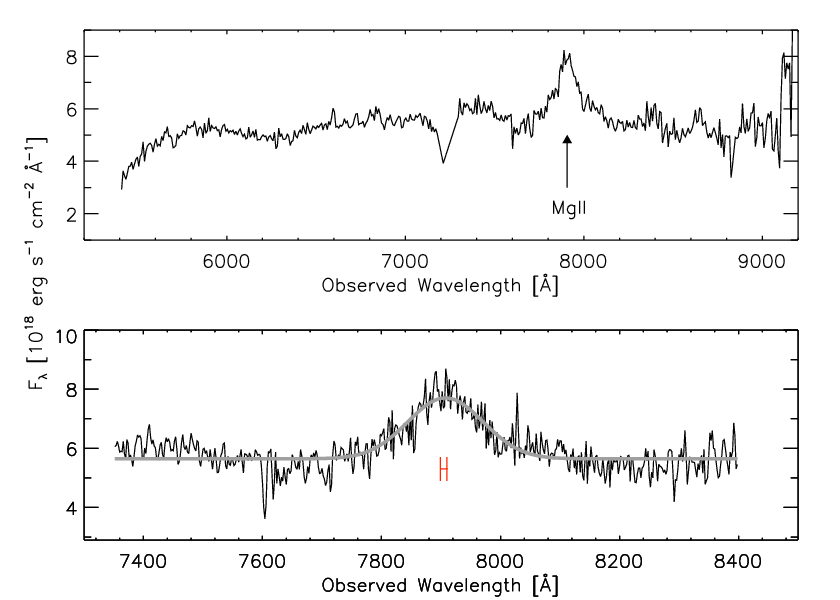
The Hubble Space Telescope Advanced Camera for Surveys (HST ACS) band image of J100038 (Figure 5) shows a complex morphology with three discernable components. For the bright central component , Figures 4 and 6 show the SED and optical spectrum, respectively.
The western component is offset by from the central source and shows no sign of a connection to it. Although the Subaru band images previously shown by Bertoldi et al. (2007) are only able to separate and , the HST imaging interestingly shows a third eastern component ().
Since the three components are well aligned, it is suggestive that and could be gravitationally lensed images. It could also be possible that all three components are lensed images as in e.g. APM08279 (Weiß et al. 2007). However, the optical photometric redshift of for , which is resolved in all optical images (Bertoldi et al. 2007, see), is consistent with that of C, with no significant secondary solution at higher redshift, thus ruling out the possibility that E and W is a background object lensed by C. Imaging spectroscopy would much help to establish a dynamical relation between the three components, which could support a merger history as the cause for the starburst and nuclear activity.
3.6 Spectral Energy Distribution
Figure 4 shows the J100038 spectral energy distribution from the radio regime to X-rays. For comparison, we show the (redshifted to ) SED of the proto-typical starburst galaxy Arp220 (Silva et al. 1998), which fits well from radio to IR. The match strongly supports the conclusion that most of the radio to far-IR emission of J100038 is produced by star formation.
We also compare the observed photometry with the average QSO SEDs of Elvis et al. (1994). While the near to mid-IR photometry of J100038 is well matched by both the radio loud and radio quiet QSO templates, at higher frequencies we need to apply a reddening correction to obtain a good fit. Although the radio-loud model would fit the millimeter flux, it is clearly inconsistent with the low observed radio flux. To match the model at the higher frequencies, we applied an extinction correction based on the model of Calzetti et al. (2000) for starburst galaxies. A correction with yields a good match between the models and the UV/optical photometry, and for the radio-loud model even for the X-ray flux. Given the redshift () and the best fit reddened template, we derive an extinction corrected absolute magnitude in the Subaru band, of magnitudes.
At near-IR and shorter wavelengths, the photometry corresponds to the central plus eastern component, but at longer wavelengths, the western component cannot be distinguished any longer. In the optical and radio regimes, the flux of component W is only 20% of that of C, but differential extinction could in principle be the cause of this difference.
Based on an empirical point-spread-function created from isolated stars in the COSMOS field in the vicinity of J100038, Jahnke et al. (in preparation) studied the contribution from the AGN and host galaxy to the optical emission in J100038 (Jahnke et al. 2004, see also). They find that the host galaxy is resolved and has irregular structure outside the central 0.5″, where nuclear residuals might dominate, as shown in Figure 5.
The host galaxy contributes with a % to the total source flux. Therefore, most of the emission at optical wavelengths (% of the total flux) arises from an unresolved point source, with magnitudes for the host and magnitudes for the nucleus. This gives magnitudes in total. Component E contributes a 0.8% to the total nucleushost flux, .
Figure 4 shows the ACS band fluxes for the host galaxy and nucleus. As mentioned above, the main flux contribution at this wavelength is provided by the latter. This is also true for the flux in the rest of the optical bands, however it is interesting to note that the band flux density of the host galaxy component matches the optical emission of the Arp220 SED, suggesting that it is heavily absorbed by dust and hosts starburst activity.
3.7 Black Hole Mass Estimate
To estimate the mass of the central supermassive black hole one commonly assumes that the motion of the emitting gas around the black hole is virialized (Peterson & Wandel 2000). Then the black hole mass is related to the Keplerian velocity of the broad-line region (BLR) gas, , and to the BLR radius, , through . The BLR velocity is proportional to the line width of the MgII line (FWHM[MgII]) and the BLR radius has been observed to correlate with the UV continuum emission at 3000 Å (McLure & Jarvis 2002). Combining these relations (McLure & Dunlop 2004, see ),
| (7) |
where is the luminosity at 3000 Å (rest frame). In the optical spectrum of J100038 (Trump et al. 2007), the MgII line is prominent and allows for an estimate of the black hole mass (Figure 6). Assuming a Gaussian shape for the MgII doublet we find a FWHM of Å or km s-1. From the average radio-quiet QSO SED fit we estimate that the rest frame (extinction corrected) 3000 Å luminosity is W, resulting in a black hole mass of .
The maximum luminosity that can be reached by an accreting black hole of this mass, or Eddington limit, is . Assuming a typical QSO SED (Elvis et al. 1994), we obtain a bolometric luminosity of which implies a moderate accretion rate (far from the Eddington limit).
4 Discussion
4.1 Comparison of Excitation Conditions
The observations of the CO lines in J100038 show that its molecular gas is somewhat less excited than observed in local starburst or high-redshift QSOs. We find that the turn-over of the CO line SED occurs between the CO and CO transitions whereas in most local starbursts/AGNs, or high-redshift QSOs studied to date, the peak of the CO line SED is typically located between the CO and CO transitions. Examples of such higher excitation CO emission in the local Universe are NGC253 (Güsten et al. 2006), M82 (Weiß et al. 2005b), and at high-redshift, J1148+5251 (Bertoldi et al. 2003; Walter et al. 2003), BR1202-0725 (Carilli et al. 2002; Riechers et al. 2006) and APM08279+5255 (Weiß et al. 2007). The only SMG for which the CO SED has been traced over its peak is J16359+6612 (Weiß et al. 2005a), which interestingly, shows a similar CO excitation to J100038. Other examples of lower excitation are found toward the centers of the local starburst/AGN of Circinus and NGC4945 (Hitschfeld et al. 2008), or in the main starburst region of the Antennae galaxy (Zhu et al. 2003). The lower excitation of the molecular gas observed in these cases, and in particular towards J100038, is likely produced by the relatively low H2 density values ( cm3). Furthermore, the best solution derived from the LVG analysis indicates a moderate kinetic temperature ( K), suggesting that the AGN does not contribute strongly to the heating of the molecular gas. Conversely, this may imply that most of the heating is produced by star formation, as it is also suggested by the similarity of molecular gas conditions (, (H2)) observed between J16359+6612 and J100038.
| Property | Name | Value |
|---|---|---|
| Molecular Gas Mass ( | ||
| Dynamical Mass () | ||
| Dust Mass () | ||
| SFR | Star Formation Rate ( yr-1) | |
| SFE | Star Formation Efficiency () | |
| Gas Depletion Lifetime (Myr) | 30 | |
| Optical Absolute Magnitude | -24.2 | |
| Black Hole Mass () |
4.2 J100038+020822: A Starburst-QSO Composite
The general picture for QSO and stellar spheroid formation is based on the merger of two gas-rich disk galaxies. The large amounts of gas and dust involved in these mergers provide the fuel for infrared luminous starbursts to occur, and the gas inflow into the inner regions of the galaxy likely feeds the central massive black hole (Mihos & Hernquist 1994; Barnes & Hernquist 1996). Observations of local ULIRGs indicate that the most luminous phase occurs close to the final stage of the merger, when both galaxy disks overlap (Sanders et al. 1988a; Sanders et al. 1988b; Veilleux et al. 1999).
When the central massive black hole has reached a sufficient size and luminosity, feedback from an active nucleus phase dissipates the dust (Di Matteo et al. 2005) and an optically luminous QSO emerges. As the gas is being expelled, the feeding of the QSO ceases, stopping its activity, and the system relaxes into a spheroidal galaxy hosting a (quiescent) supermassive black hole at its center (Hopkins et al. 2006).
One important question in galaxy evolution is whether this scenario connecting gas-rich starburst galaxies and optically bright QSOs constitutes a rule for most of these systems or whether it is a phenomenon that applies only to the most luminous and massive objects. This evolutionary connection has been studied with vast supporting evidence in the local Universe (Sanders et al. 1988a, e.g.). However, for the crucial epoch of star formation and QSO activity () only a few studies have so far been undertaken. The study of submillimetre (Page et al. 2004; Stevens et al. 2005) and CO line (Coppin et al. 2008) emission of absorbed and unabsorbed high-redshift QSOs indicates that the QSO phase could be preceded by a SMG starburst phase and suggests that submillimetre selected QSOs represent ideal objects for studying these transitional cases at .
J100038 appears to be in a transition between the starburst and QSO phases, as a comparison of its properties to those of a sample of typical SMGs (Greve et al. 2005) and QSOs (Solomon & Vanden Bout 2005) shows. We start by describing its QSO properties followed by the features that classify this source as a starburst galaxy.
J100038 shows an optical spectrum typical of a Type-1 AGN (Figure 6) with a prominent MgII broad emission line. It is relatively luminous at optical wavelengths ( magnitudes, extinction corrected), shows mild optical extinction with and its X-ray emission indicates it is a heavily absorbed QSO (log cm-2). Moreover, its optical to mid-IR SED resembles that of typical QSOs (Figure 4), well in agreement with Elvis et al. (1994) templates. In addition, we derived a diameter of kpc for the CO line emitting region. This size is consistent with values observed in high-redshift QSOs which range between 1 and 3 kpc (Walter et al. 2004; Solomon & Vanden Bout 2005; Maiolino et al. 2007) and similar to those found in local ULIRGs (Downes & Solomon 1998; Soifer et al. 2000, kpc;), but smaller than the diameters for the CO emitting region in SMGs (Tacconi et al. 2006, kpc;).
On the other hand, J100038 shows distinctive features of on-going starburst activity. The optical morphology of J100038 seen in the HST imaging is suggestive of a recent merger event (Figure 5). While most of the emission is concentrated in the point-like central source (), the faint emission from the eastern source () may be indicative of a tidal tail, hinting at a past interaction or merger, although it could also imply the influence of gravitational lensing. The low number density of HST -band sources in the surroundings of J100038 , arcmin-2, implies that the probability of chance association between and is only 4.1%. If both sources ( and ) are physically related, the projected distance between them would be 7.5 kpc. A large fraction of the optical emission from the host galaxy in J100038 could still be absorbed by surrounding dust (Jahnke et al, in prep.), and could be hiding the actual link to the eastern component. We note that the optical emission of the host galaxy is consistent with the obscured SED of the prototypical local starburst galaxy Arp220. Indeed, the optical morphology of this system is strikingly similar to that observed in local ULIRG/PG-QSOs (Sanders et al. 1988b; Surace et al. 1998, IRAS 05189-2524;). Furthermore, the far-IR to radio SED of J100038 agrees very well with that of Arp220 (Figure 4), and does not follow the typical behavior of radio-loud or radio-quiet QSOs at these wavelengths. In fact, its radio to far-IR spectral index, when used as a redshift indicator results in (Bertoldi et al. 2007), a strong indication that the far-IR and radio emission are both produced by star formation. As mentioned before, the analysis of the molecular gas physical conditions suggest that the AGN plays a moderate role in the gas heating and hints that the heating may actually be dominated by starforming regions.
All the evidence exposed permits to well fit J100038 in the Sanders et al. scenario. Studies of these transitional cases in the local Universe have found that about of the most luminous ULIRGs () show broad emission lines (Veilleux et al. 1999) and the presence of compact nuclei in 40% of all ULIRGs (Scoville et al. 2000; Soifer et al. 2000) as well as large molecular gas reservoirs (Evans et al. 2002; Evans et al. 2005), even in the late stages of this evolutionary sequence. All these properties apply to J100038. Furthermore, the presence of both starburst and QSO attributes imprinted in the galaxy SEDs have largely been observed in nearby objects, constituting the basis of this evolutionary scenario (Sanders et al. 1988a; Sanders et al. 1988b; Sanders et al. 1989). These templates compare favorably with the SED observed for J100038, strongly suggesting that this object is evolving from a starburst to a QSO. In fact, it is possible to classify it in a stage between the “warm ULIRG” and the “infrared excess” QSO phases following the mentioned scenario (Sanders 2004).
5 Summary
We detected CO emission from the millimeter selected AGN J100038+020822 at in the COSMOS field.
J100038 is a millimeter-bright, blank-field selected galaxy classified via its optical spectra as a Type-1 AGN. The CO line intensities peak at the transition and an LVG analysis of the CO SED finds that the molecular gas in this source is less excited than in typical high-redshift QSOs (e.g. J1148+5251, BR1202-0725 and APM08279+5255), more similar to what is found for SMGs ( K, cm-3) such as J16359+6612. The CO emission seems to be concentrated in the central kpc, as the comparison between the modeled brightness and observed main beam temperatures shows. The implied molecular gas mass of could account for a substancial fraction of the implied dynamical mass within this radius ( kpc).
Assuming a gray-body far-IR spectrum we derive a dust mass of and a dominant cold dust component with K. The broad MgII line allowed us to estimate the central black hole mass to .
Although the molecular gas and dust properties are similar to those of typical SMGs and some ULIRGs, the SED from the X-rays to the mid-IR is typical of a QSO. The optical morphology of J100038+020822 is complex, showing evidence of a possible interaction or merger. Its shared properties of starburst and AGN suggest that this composite galaxy fits the evolutionary scenario of starburst to QSO proposed by Sanders et al. (1988a).
Acknowledgements.
Manuel Aravena was supported for this research through a stipend from the International Max Planck Research School (IMPRS) for Radio and Infrared Astronomy at the Universities of Bonn and Cologne. This work is based on observations with 30m telescope of the Institute for Radioastronomy at Millimeter Wavelengths (IRAM), which is funded by the German Max Planck Society, the French CNRS and the Spanish National Geographical Institute. Also based on observations with the Very Large Array of the National Radio Astronomy Observatory, which is a facility of the National Science Foundation, operated under cooperative agreement by Associated Univ. Inc. Based on observations with the NASA/ESA Hubble Space Telescope, obtained at the Space Telescope Science Institute, which is operated by AURA Inc, under NASA contract NAS 5-26555; also based on data collected at: the Subaru Telescope, which is operated by the National Astronomical Observatory of Japan; the XMM-Newton, an ESA science mission with instruments and contributions directly funded by ESA Member States and NASA; the European Southern Observatory, Chile; Kitt Peak National Observatory, Cerro Tololo Inter-American Observatory, and the National Optical Astronomy Observatory, which are operated by the Association of Universities for Research in Astronomy Inc. (AURA) under cooperative agreement with the National Science Foundation; and the Canada-France-Hawaii Telescope operated by the National Research Council of Canada, the Centre National de la Recherche Scientifique de France and the University of Hawaii.References
- Alexander et al. (2005) Alexander, D. M., Bauer, F. E., Chapman, S. C., et al. 2005, ApJ, 632, 736
- Andreani et al. (2000) Andreani, P., Cimatti, A., Loinard, L., & Röttgering, H. 2000, A&A, 354, L1
- Barnes & Hernquist (1996) Barnes, J. E. & Hernquist, L. 1996, ApJ, 471, 115
- Beelen et al. (2006) Beelen, A., Cox, P., Benford, D. J., et al. 2006, ApJ, 642, 694
- Beelen et al. (2004) Beelen, A., Cox, P., Pety, J., et al. 2004, A&A, 423, 441
- Bertoldi et al. (2007) Bertoldi, F., Carilli, C., Aravena, M., et al. 2007, ApJS, 172, 132
- Bertoldi et al. (2003) Bertoldi, F., Cox, P., Neri, R., et al. 2003, A&A, 409, L47
- Blain et al. (2004) Blain, A. W., Chapman, S. C., Smail, I., & Ivison, R. 2004, ApJ, 611, 52
- Brusa et al. (2007) Brusa, M., Zamorani, G., Comastri, A., et al. 2007, ApJS, 172, 353
- Calzetti et al. (2000) Calzetti, D., Armus, L., Bohlin, R. C., et al. 2000, ApJ, 533, 682
- Carilli et al. (2002) Carilli, C. L., Kohno, K., Kawabe, R., et al. 2002, AJ, 123, 1838
- Carilli et al. (2007) Carilli, C. L., Neri, R., Wang, R., et al. 2007, ApJ, 666, L9
- Carilli & Yun (1999) Carilli, C. L. & Yun, M. S. 1999, ApJ, 513, L13
- Chapman et al. (2005) Chapman, S. C., Blain, A. W., Smail, I., & Ivison, R. J. 2005, ApJ, 622, 772
- Coppin et al. (2008) Coppin, K. E. K., Swinbank, A. M., Neri, R., et al. 2008, MNRAS, 389, 45
- De Breuck et al. (2005) De Breuck, C., Downes, D., Neri, R., et al. 2005, A&A, 430, L1
- De Breuck et al. (2003) De Breuck, C., Neri, R., & Omont, A. 2003, New Astronomy Review, 47, 285
- Di Matteo et al. (2005) Di Matteo, T., Springel, V., & Hernquist, L. 2005, Nature, 433, 604
- Downes & Solomon (1998) Downes, D. & Solomon, P. M. 1998, ApJ, 507, 615
- Dunlop (2001) Dunlop, J. S. 2001, New Astronomy Review, 45, 609
- Eales et al. (1999) Eales, S., Lilly, S., Gear, W., et al. 1999, ApJ, 515, 518
- Elvis et al. (1994) Elvis, M., Wilkes, B. J., McDowell, J. C., et al. 1994, ApJS, 95, 1
- Evans et al. (2005) Evans, A. S., Mazzarella, J. M., Surace, J. A., et al. 2005, ApJS, 159, 197
- Evans et al. (2002) Evans, A. S., Mazzarella, J. M., Surace, J. A., & Sanders, D. B. 2002, ApJ, 580, 749
- Fixsen et al. (1999) Fixsen, D. J., Bennett, C. L., & Mather, J. C. 1999, ApJ, 526, 207
- Flower (2001) Flower, D. R. 2001, Journal of Physics B Atomic Molecular Physics, 34, 2731
- Frayer et al. (1999) Frayer, D. T., Ivison, R. J., Scoville, N. Z., et al. 1999, ApJ, 514, L13
- Frayer et al. (1998) Frayer, D. T., Ivison, R. J., Scoville, N. Z., et al. 1998, ApJ, 506, L7
- Frayer et al. (2008) Frayer, D. T., Koda, J., Pope, A., et al. 2008, ApJ, 680, L21
- Genzel et al. (1998) Genzel, R., Lutz, D., Sturm, E., et al. 1998, ApJ, 498, 579
- Greve et al. (2005) Greve, T. R., Bertoldi, F., Smail, I., et al. 2005, MNRAS, 359, 1165
- Guilloteau et al. (1999) Guilloteau, S., Omont, A., Cox, P., McMahon, R. G., & Petitjean, P. 1999, A&A, 349, 363
- Guilloteau et al. (1997) Guilloteau, S., Omont, A., McMahon, R. G., Cox, P., & Petitjean, P. 1997, A&A, 328, L1
- Güsten et al. (2006) Güsten, R., Philipp, S. D., Weiß, A., & Klein, B. 2006, A&A, 454, L115
- Hainline et al. (2004) Hainline, L. J., Scoville, N. Z., Yun, M. S., et al. 2004, ApJ, 609, 61
- Hitschfeld et al. (2008) Hitschfeld, M., Aravena, M., Kramer, C., et al. 2008, A&A, 479, 75
- Hopkins et al. (2005) Hopkins, P. F., Hernquist, L., Cox, T. J., et al. 2005, ApJ, 630, 705
- Hopkins et al. (2006) Hopkins, P. F., Hernquist, L., Cox, T. J., et al. 2006, ApJS, 163, 1
- Hughes et al. (1998) Hughes, D. H., Serjeant, S., Dunlop, J., et al. 1998, Nature, 394, 241
- Ivison et al. (2007) Ivison, R. J., Greve, T. R., Dunlop, J. S., et al. 2007, MNRAS, 380, 199
- Ivison et al. (2002) Ivison, R. J., Greve, T. R., Smail, I., et al. 2002, MNRAS, 337, 1
- Ivison et al. (2005) Ivison, R. J., Smail, I., Dunlop, J. S., et al. 2005, MNRAS, 364, 1025
- Jahnke et al. (2004) Jahnke, K., Sánchez, S. F., Wisotzki, L., et al. 2004, ApJ, 614, 568
- Kennicutt (1998) Kennicutt, Jr., R. C. 1998, ARA&A, 36, 189
- Klamer et al. (2005) Klamer, I. J., Ekers, R. D., Sadler, E. M., et al. 2005, ApJ, 621, L1
- Kovács et al. (2006) Kovács, A., Chapman, S. C., Dowell, C. D., et al. 2006, ApJ, 650, 592
- Kruegel & Siebenmorgen (1994) Kruegel, E. & Siebenmorgen, R. 1994, A&A, 288, 929
- Le Floc’h et al. (2007) Le Floc’h, E., Willmer, C. N. A., Noeske, K., et al. 2007, ApJ, 660, L65
- Mainieri et al. (2007) Mainieri, V., Hasinger, G., Cappelluti, N., et al. 2007, ApJS, 172, 368
- Maiolino et al. (2007) Maiolino, R., Neri, R., Beelen, A., et al. 2007, A&A, 472, L33
- McLure & Dunlop (2004) McLure, R. J. & Dunlop, J. S. 2004, MNRAS, 352, 1390
- McLure & Jarvis (2002) McLure, R. J. & Jarvis, M. J. 2002, MNRAS, 337, 109
- Mihos & Hernquist (1994) Mihos, J. C. & Hernquist, L. 1994, ApJ, 431, L9
- Neri et al. (2003) Neri, R., Genzel, R., Ivison, R. J., et al. 2003, ApJ, 597, L113
- Omont et al. (2003) Omont, A., Beelen, A., Bertoldi, F., et al. 2003, A&A, 398, 857
- Omont et al. (2001) Omont, A., Cox, P., Bertoldi, F., et al. 2001, A&A, 374, 371
- Omont et al. (1996) Omont, A., Petitjean, P., Guilloteau, S., et al. 1996, Nature, 382, 428
- Page et al. (2004) Page, M. J., Stevens, J. A., Ivison, R. J., & Carrera, F. J. 2004, ApJ, 611, L85
- Papadopoulos et al. (2005) Papadopoulos, P. P., Greve, T. R., Ivison, R. J., & De Breuck, C. 2005, A&A, 444, 813
- Peterson & Wandel (2000) Peterson, B. M. & Wandel, A. 2000, ApJ, 540, L13
- Pope et al. (2006) Pope, A., Scott, D., Dickinson, M., et al. 2006, MNRAS, 370, 1185
- Prescott et al. (2006) Prescott, M. K. M., Impey, C. D., Cool, R. J., & Scoville, N. Z. 2006, ApJ, 644, 100
- Priddey & McMahon (2001) Priddey, R. S. & McMahon, R. G. 2001, MNRAS, 324, L17
- Riechers et al. (2006) Riechers, D. A., Walter, F., Carilli, C. L., et al. 2006, ApJ, 650, 604
- Rowan-Robinson (2000) Rowan-Robinson, M. 2000, MNRAS, 316, 885
- Sanders (2004) Sanders, D. B. 2004, Advances in Space Research, 34, 535
- Sanders & Mirabel (1996) Sanders, D. B. & Mirabel, I. F. 1996, ARA&A, 34, 749
- Sanders et al. (1989) Sanders, D. B., Phinney, E. S., Neugebauer, G., Soifer, B. T., & Matthews, K. 1989, ApJ, 347, 29
- Sanders et al. (2007) Sanders, D. B., Salvato, M., Aussel, H., et al. 2007, ApJS, 172, 86
- Sanders et al. (1988a) Sanders, D. B., Soifer, B. T., Elias, J. H., et al. 1988a, ApJ, 325, 74
- Sanders et al. (1988b) Sanders, D. B., Soifer, B. T., Elias, J. H., Neugebauer, G., & Matthews, K. 1988b, ApJ, 328, L35
- Schinnerer et al. (2007) Schinnerer, E., Smolčić, V., Carilli, C. L., et al. 2007, ApJS, 172, 46
- Scoville et al. (2007) Scoville, N., Aussel, H., Brusa, M., et al. 2007, ApJS, 172, 1
- Scoville et al. (2000) Scoville, N. Z., Evans, A. S., Thompson, R., et al. 2000, AJ, 119, 991
- Sheth et al. (2004) Sheth, K., Blain, A. W., Kneib, J.-P., et al. 2004, ApJ, 614, L5
- Silva et al. (1998) Silva, L., Granato, G. L., Bressan, A., & Danese, L. 1998, ApJ, 509, 103
- Smail et al. (1997) Smail, I., Ivison, R. J., & Blain, A. W. 1997, ApJ, 490, L5+
- Soifer et al. (2000) Soifer, B. T., Neugebauer, G., Matthews, K., et al. 2000, AJ, 119, 509
- Solomon et al. (1997) Solomon, P. M., Downes, D., Radford, S. J. E., & Barrett, J. W. 1997, ApJ, 478, 144
- Solomon & Vanden Bout (2005) Solomon, P. M. & Vanden Bout, P. A. 2005, ARA&A, 43, 677
- Stevens et al. (2005) Stevens, J. A., Page, M. J., Ivison, R. J., et al. 2005, MNRAS, 360, 610
- Surace et al. (1998) Surace, J. A., Sanders, D. B., Vacca, W. D., Veilleux, S., & Mazzarella, J. M. 1998, ApJ, 492, 116
- Tacconi et al. (2002) Tacconi, L. J., Genzel, R., Lutz, D., et al. 2002, ApJ, 580, 73
- Tacconi et al. (2008) Tacconi, L. J., Genzel, R., Smail, I., et al. 2008, ApJ, 680, 246
- Tacconi et al. (2006) Tacconi, L. J., Neri, R., Chapman, S. C., et al. 2006, ApJ, 640, 228
- Trump et al. (2007) Trump, J. R., Impey, C. D., McCarthy, P. J., et al. 2007, ApJS, 172, 383
- Veilleux et al. (1999) Veilleux, S., Sanders, D. B., & Kim, D.-C. 1999, ApJ, 522, 139
- Walter et al. (2003) Walter, F., Bertoldi, F., Carilli, C., et al. 2003, Nature, 424, 406
- Walter et al. (2004) Walter, F., Carilli, C., Bertoldi, F., et al. 2004, ApJ, 615, L17
- Wang et al. (2008) Wang, R., Wagg, J., Carilli, C. L., et al. 2008, AJ, 135, 1201
- Weiß et al. (2007) Weiß, A., Downes, D., Neri, R., et al. 2007, A&A, 467, 955
- Weiß et al. (2005a) Weiß, A., Downes, D., Walter, F., & Henkel, C. 2005a, A&A, 440, L45
- Weiß et al. (2005b) Weiß, A., Walter, F., & Scoville, N. Z. 2005b, A&A, 438, 533
- Zhu et al. (2003) Zhu, M., Seaquist, E. R., & Kuno, N. 2003, ApJ, 588, 243