Multi-wavelength study of a young open cluster NGC 7419
Abstract
Using new H CCD photometric observations and the archival infrared and X-ray data, we have carried out a multi-wavelength study of a Perseus arm young galactic star cluster NGC 7419. An age of Myr and a distance of pc are derived for the cluster. Our photometric data indicates a higher value of color excess ratio than the normal one. There is an evidence for mass segregation in this dynamically relaxed cluster and in the range , the mass function slope is in agreement with the Salpeter value. Excess emissions in near-infrared and H support the existence of a young ( Myr) stellar population of Herbig Ae/Be stars () indicating a second episode of star formation in the cluster region. Using XMM-Newton observations, we found several X-ray sources in the cluster region but none of the Herbig Ae/Be stars is detected in X-rays. We compare the distribution of upper limits for Herbig Ae/Be stars with the X-ray distribution functions of the T-Tauri and the Herbig Ae/Be stars from previous studies, and found that the X-ray emission level of these Herbig Ae/Be stars is not more than erg s-1, which is not significantly higher than for the T-Tauri stars. Therefore, X-ray emission from Herbig Ae/Be stars could be the result of either unresolved companion stars or a process similar to T-Tauri stars. We report an extended X-ray emission from the cluster region NGC 7419, with a total X-ray luminosity estimate of . If the extended emission is due to unresolved emission from the point sources then we estimate 288 T-Tauri stars in the cluster region each having X-ray luminosity . Investigation of dust attenuation and 12CO emission map of a square degree region around the cluster indicates the presence of a foreground dust cloud which is most likely associated with the local arm star forming region (Sh2-154). This cloud harbors uniformly distributed pre-main-sequence stars (), with no obvious trend of their distribution with either excess or . This suggests that the star formation in this cloud depend mostly upon the primordial fragmentation.
Keywords:
star clusters : young – star formation : primordial fragmentation – young stellar objects : Herbig Ae/Be, T Tauri, X-ray emission1 Introduction
NGC 7419 (, ; , ), is a moderately populated young and heavily reddened galactic star cluster in Cepheus with a large number of Be stars. The cluster contains high mass (); intermediate mass () and low-mass () stars. It is therefore an ideal laboratory for the study of initial stellar mass distribution as well as duration of star formation process in a molecular cloud. Presence of statistically significant number of Herbig Ae/Be stars in the cluster makes it very attractive for understanding the formation of these stars and origin of various atmospheric activities like H emission and X-ray emission in them. However, to address these questions in detail, one would like to know accurate distance and age parameters of the cluster NGC 7419, which is lacking despite a number of photometric and spectroscopic studies. This is mainly because of the fact that the cluster is heavily reddened in comparison to the nearby clusters situated at the similar distances, and suffers from variable reddening.
In order to determine cluster reddening reliably, accurate broadband photometry of early type stars is essential. A comparison of the photometries available in the literature indicates that data, many have systematic calibration error. For example, Beauchamp, Moffat & Drissen (1994) have mentioned that their color may have an offset of mag due to the calibration problems in band. Their photometric observations have been carried out in the poor seeing () conditions. This will affect cluster photometric data particularly in the crowded regions.
The main goals of present study are to determine the distance, age and its spread, and mass function (MF) of the cluster as accurate as possible. This will help us to understand the star formation history of the cluster, and to investigate the X-ray emission properties of Herbig Ae/Be stars. Deep optical observations ( mag), narrow band H photometric observations along with the Two Micron All Sky Survey (2MASS), Infrared All Sky Survey (IRAS), Midcourse Space experiment (MSX) and XMM-Newton archival data are used to understand the X-ray emission properties of Herbig Ae/Be stars, and the global scenario of star formation in the cluster NGC 7419 and its surrounding region.
Blanco et al. (1955) has reported the distance of this cluster as 6 kpc based on the photometric observations. A similar value for cluster distance has also been obtained by Moffat & Vogt (1973). However, van de Hulst et al. (1954) has obtained a significantly smaller distance of 3.3 kpc. Using CCD data, a distance of 2.0 kpc and 2.3 kpc was estimated by Bhatt et al. (1993) and Beauchamp, Moffat & Drissen (1994), respectively. The age estimated by Bhatt et al. (1993) is 40 Myr while Beauchamp, Moffat & Drissen (1994) have estimated a much younger age of 14 Myr. Recent CCD observations reported by Subramaniam et al. (2006) estimated its distance as 2.9 kpc and an age of 20–25 Myr.
The paper describes optical observations and the derivation of cluster parameters in §2 and §3. The near-infrared (NIR) data are dealt in §4, while distribution of young stellar objects (YSOs), MF and mass segregation are given in §5, §6 and §7. Finally, the X-ray data and its analysis (for the first time) are described in §8, followed by the summary and conclusions in §9.
2 Photometric Data
2.1 Observations
| Date(UT) | Filter | Exposure Time (s) |
| (no. of exposures) | ||
| NGC 7419 | ||
| 30 October 2005 | H | 3002, 1202, 15003 |
| H -cont | 3002, 1202, 9003 | |
| 07 November 2005 | 3003, 3604 | |
| 1804, 2404 | ||
| 1804, 1804 | ||
| 204, 1204 | ||
| 204, 604 | ||
| 08 November 2005 | 18001 | |
| 12001 | ||
| 9001 | ||
| 3001 | ||
| 5001 | ||
| 25 October 2006 | 3003 | |
| 3002 | ||
| 1002 | ||
| 202 | ||
| 202 | ||
| SA 98 | ||
| 25 October 2006 | 36011 | |
| 15010 | ||
| 6010 | ||
| 2510 | ||
| 2510 |
The optical observations of NGC 7419 were carried out using a thinned back-illuminated CCD camera mounted at f/13 Cassegrain focus of the 104-cm Sampurnanand reflector telescope of Aryabhatta Research Institute of Observational Sciences, Nainital. A m square pixel of the size CCD detector corresponds to 038 and the entire chip covers a field of about on the sky. In order to improve the signal to noise ratio, observations were taken in binned mode of pixel. The gain and readout noise of the CCD are 10 electron per analog-to-digital unit and 5.3 electron, respectively. The journal of optical observations is given in Table 1. Broad band Johnson , Cousins and, narrow band H line ( nm) and H continuum ( nm) filters were used for observations. The narrow band filters had a full width at half maximum of 8 nm. Several bias and twilight flat field frames in all the filters were taken to clean the images. Multiple long and short exposures were obtained for the cluster region. We observed 12 stars in Landolt (1992) standards field (SA98) covering a range in brightness () as well as in color () for calibrating the cluster observations. The airmass range is covered from 1.1 to 2.0 for the Landolt (1992) standards, which was used for extinction determinations.
The photometric CCD data were reduced using the IRAF11 1 IRAF – Image Reduction and Analysis Facility is distributed by the National Optical Astronomy Observatories, which are operated by the Association of Universities for Research in Astronomy, Inc., under cooperative agreement with the National Science Foundation (http://iraf.noao.edu). and ESO MIDAS22 2 MIDAS – Munich Image Data Analysis System is developed and maintained by ESO, the European Southern Observatory. data reduction packages. Photometry of the bias-subtracted and flat-fielded CCD frames was carried out using DAOPHOT-II software (Stetson, 1987; Stetson, 1992). Magnitude of the stars obtained from different frames were averaged separately for short and long exposures. When brighter stars were saturated on deep exposure frames, their magnitudes were taken only from unsaturated short exposure frames. We used DAOGROW program for construction of an aperture growth curve required for determining the difference between aperture and profile fitting magnitudes.
2.2 Calibrations
| Magnitude | |||||
|---|---|---|---|---|---|
| range | |||||
| 0.009 | 0.002 | 0.003 | 0.005 | 0.007 | |
| 0.007 | 0.005 | 0.003 | 0.005 | 0.004 | |
| 0.021 | 0.010 | 0.013 | 0.012 | 0.025 | |
| 0.030 | 0.015 | 0.010 | 0.011 | 0.023 | |
| 0.069 | 0.018 | 0.010 | 0.012 | 0.026 | |
| 0.131 | 0.029 | 0.014 | 0.011 | 0.031 | |
| 0.070 | 0.017 | 0.013 | 0.026 | ||
| 0.173 | 0.031 | 0.019 | 0.031 | ||
| 0.082 | 0.036 | 0.034 | |||
| 0.196 | 0.061 | 0.047 |

| ID | X | Y | H -index | |||||||
|---|---|---|---|---|---|---|---|---|---|---|
| (h m s) | (° ′ ′′) | (pixel) | (pixel) | (mag) | (mag) | (mag) | (mag) | (mag) | (mag) | |
| 1 | 22 54 06.38 | +60 52 13.30 | 818.710 | 640.714 | 12.999 0.002 | 12.481 0.002 | 11.707 0.009 | 11.321 0.012 | 11.003 0.002 | 0.032 0.008 |
| 2 | 22 54 02.22 | +60 54 57.20 | 1032.410 | 691.088 | 13.518 0.002 | 12.964 0.002 | 12.156 0.009 | 11.761 0.011 | 11.381 0.004 | 0.038 0.006 |
| 3 | 22 53 30.17 | +60 53 38.60 | 914.148 | 994.003 | 13.964 0.003 | 13.492 0.002 | 12.740 0.002 | 12.321 0.010 | 11.946 0.004 | 0.022 0.020 |
| – | – | – | – | – | – | – | – | – | – | – |
The instrumental magnitudes were converted into the standard system
using least square linear regression procedure outlined by Stetson (1992).
The photometric calibration equations used are:
where and are the standard magnitudes; and are the instrumental magnitudes obtained after time and aperture correction; and is the airmass. We have ignored the second-order color correction terms as they are generally small in comparison to the internal photometric errors as given by DAOPHOT. The photometric errors as a function of brightness range are given in Table 2. It can be seen that the errors become large (mag) for stars fainter than mag, and hence the measurements beyond this magnitude are less reliable and are not considered in further analysis. At band, we could detect 1817 stars in region and their photometric magnitudes are given in Table 3 (available only in electronic form). The difference of calibrated magnitudes derived using above transformation to that of the Landolt (1992) magnitudes are plotted in Figure 1. We generated secondary standards in the cluster field using data of 25th October 2006 to standardise the data observed on 7th and 8th of November 2005. We, therefore also plot differences in magnitudes of the secondary standards on these dates. No systematic effect has been seen in the residuals from night-to-night and its distribution is random in nature with a typical accuracy of mag in band.
Figure 2 shows a comparison of the present CCD photometry with the previously reported CCD photometry by Bhatt et al. (1993), Beauchamp, Moffat & Drissen (1994) and Subramaniam et al. (2006). The difference (present-literature) is plotted as a function of magnitude and a detailed statistics are given in Table 4 (available only in electronic form). In comparison to the photometric data of Beauchamp, Moffat & Drissen (1994), the colors obtained by us are bluer by mag, colors are redder by mag and the magnitude is fainter by mag. Our photometry is in agreement with Subramaniam et al. (2006) and Bhatt et al. (1993). It is worth pointing out that our data is mag deeper from Subramaniam et al. (2006) and Bhatt et al. (1993), i.e., 22.0 mag.
| V range | |||||
|---|---|---|---|---|---|
| Bhatt et al. (1993) | |||||
| (8) | (6) | (4) | (7) | (6) | |
| – | – | – | – | – | – |

2.3 Completeness of the data
The completeness of the data used in the present work was estimated using the ADDSTAR routine of the DAOPHOT II. In brief, the method consists of randomly adding artificial stars (about 10–15% of the originally detected stars) of known magnitudes and positions into the original frames. The frames were re-reduced using the same procedure used for the original frames. The ratio of the number of recovered stars to those added in each magnitude interval gives the completeness factor (CF) as a function of magnitude. The CF was obtained using the stars which were recovered in both and pass-bands. The detailed procedures have been outlined elsewhere (Sagar & Richtler, 1991; Sagar & Griffiths, 1998; Pandey et al., 2001; Nilakshi & Sagar, 2002). The CF as a function of magnitude is given in Table 5.
| Magnitude range | NGC 7419 | Field region | |
|---|---|---|---|
| ( mag) | |||
| 13-14 | 1.00 | 1.00 | 1.00 |
| 14-15 | 1.00 | 1.00 | 1.00 |
| 15-16 | 1.00 | 1.00 | 1.00 |
| 16-17 | 1.00 | 0.98 | 0.99 |
| 17-18 | 0.89 | 0.97 | 0.98 |
| 18-19 | 0.57 | 0.93 | 0.96 |
| 19-20 | 0.59 | 0.89 | 0.97 |
| 20-21 | 0.60 | 0.86 | 0.93 |
| 21-22 | 0.15 | 0.38 | 0.47 |
2.4 H photometric data
| ID | X | Y | -index | Remark | |||||
| (h m s) | (° ′ ′′) | (pixel) | (pixel) | (mag) | (mag) | (mag) | (mag) | ||
| (1) | (2) | (3) | (4) | (5) | (6) | (7) | (8) | (9) | (10) |
| 12 | 22 54 14 | 60 48 39 | 541.2 | 549.5 | 13.75 | 12.63 | Yes, BMD(389), PK, Sub(M) | ||
| 15 | 22 54 39 | 60 47 24 | 454.5 | 310.5 | 13.93 | 12.96 | No, BMD(1129), PK | ||
| 18 | 22 54 26 | 60 49 02 | 576.0 | 442.9 | 14.12 | 13.15 | No, BMD(781), PK, Sub(C) | ||
| 19 | 22 54 20 | 60 49 52 | 639.5 | 496.0 | 14.14 | 13.05 | Yes, BMD(620), PK, Sub(G) | ||
| 20 | 22 54 15 | 60 49 50 | 634.7 | 545.2 | 14.14 | 13.11 | No, BMD(417), PK, Sub(J) | ||
| 21 | 22 54 23 | 60 50 04 | 656.1 | 473.7 | 14.20 | 13.07 | Yes, BMD(702), PK, Sub(4) | ||
| 23 | 22 54 23 | 60 49 53 | 642.3 | 475.6 | 14.23 | 13.09 | Yes, BMD(692), PK, Sub(3) | ||
| 27 | 22 54 20 | 60 48 36 | 539.0 | 499.1 | 14.36 | 13.33 | No, BMD(585), PK, Sub(I) | ||
| 29 | 22 54 37 | 60 48 36 | 547.6 | 335.7 | 14.39 | 13.23 | Yes, BMD(1076), PK, Sub(A) | ||
| 38 | 22 54 27 | 60 48 52 | 564.0 | 428.1 | 14.88 | 13.76 | Yes, BMD(831), PK, Sub(B) | ||
| 39 | 22 54 20 | 60 48 54 | 563.3 | 492.1 | 14.93 | 13.92 | No, BMD(621), PK, Sub(K) | ||
| 48 | 22 54 18 | 60 48 57 | 566.2 | 517.2 | 15.14 | 14.08 | Yes, BMD(504), PK, Sub(L) | ||
| 57 | 22 54 26 | 60 49 05 | 581.2 | 435.0 | 15.37 | 14.30 | No, BMD(815), PK, Sub(2) | ||
| 59 | 22 54 08 | 60 50 23 | 673.6 | 621.9 | 15.44 | 14.18 | Yes, BMD(239), PK, Sub(5) | ||
| 64 | 22 54 16 | 60 47 49 | 476.0 | 532.4 | 15.54 | 14.32 | Yes, BMD(427), PK, Sub(N) | ||
| 66 | 22 54 14 | 60 46 20 | 358.0 | 543.2 | 15.56 | 14.51 | No, BMD(375), Sub(P) | ||
| 69 | 22 54 24 | 60 49 31 | 613.6 | 463.4 | 15.70 | 14.69 | Yes, BMD(728), PK, Sub(D) | ||
| 71 | 22 54 20 | 60 48 51 | 559.3 | 500.3 | 15.71 | 14.76 | No, BMD(582), PK, Sub(H) | ||
| 73 | 22 54 32 | 60 47 57 | 494.2 | 374.4 | 15.72 | 14.65 | No, BMD(967), PK | ||
| 74 | 22 54 10 | 60 49 39 | 617.3 | 595.2 | 15.73 | 14.67 | No, BMD(290), PK | ||
| 75 | 22 54 29 | 60 49 08 | 586.1 | 408.3 | 15.78 | 14.68 | Yes, BMD(884), PK, Sub(1) | ||
| 81 | 22 54 17 | 60 48 23 | 520.3 | 526.5 | 15.95 | 14.98 | No, BMD(451), PK | ||
| 85 | 22 54 17 | 60 48 18 | 514.4 | 524.8 | 15.97 | 14.93 | No, BMD(458), PK | ||
| 89 | 22 54 15 | 60 51 22 | 755.0 | 556.0 | 16.01 | 14.92 | Yes, Sub(Q) | ||
| 91 | 22 54 13 | 60 50 09 | 658.0 | 572.1 | 16.06 | 15.00 | No, BMD(351), PK | ||
| 95 | 22 54 17 | 60 51 37 | 776.5 | 535.6 | 16.11 | 15.10 | Yes, Sub(R) | ||
| 110 | 22 54 26 | 60 47 57 | 491.7 | 435.1 | 16.35 | 15.28 | Yes, BMD(795), PK, Sub(6), | ||
| 126 | 22 54 12 | 60 48 33 | 532.6 | 569.7 | 16.50 | 15.43 | No, BMD(340), PK | ||
| 127 | 22 54 19 | 60 48 14 | 509.7 | 506.9 | 16.50 | 15.45 | No, BMD(551), PK | ||
| 139 | 22 54 24 | 60 47 36 | 462.8 | 450.1 | 16.65 | 15.43 | Yes, BMD(745), Sub(E) | ||
| 145 | 22 54 07 | 60 48 17 | 508.8 | 618.9 | 16.71 | 15.33 | Yes | ||
| 181 | 22 54 51 | 60 48 27 | 543.4 | 199.9 | 17.07 | 15.95 | Yes, field | ||
| 218 | 22 54 24 | 60 47 01 | 416.6 | 447.5 | 17.32 | 16.17 | Yes, BMD(741), PK, Sub(F) | ||
| 321 | 22 54 13 | 60 50 27 | 681.9 | 572.7 | 18.13 | 16.92 | Yes, BMD(352), | ||
| 438 | 22 54 38 | 60 52 10 | 829.5 | 331.6 | 18.81 | 17.55 | Yes, field | ||
| —† | 22 53 33 | 60 45 51 | 300.2 | 938.4 | 18.87 | 17.27 | Yes, field | ||
| 655 | 22 54 56 | 60 47 41 | 485.2 | 148.1 | 19.53 | 18.14 | Yes, field | ||
| 703 | 22 53 37 | 60 53 22 | 895.1 | 925.5 | 19.65 | 18.45 | Yes, field | ||
| 714 | 22 54 40 | 60 49 24 | 612.6 | 306.4 | 19.68 | 18.40 | Yes, BMD(1157) | ||
| 716 | 22 54 57 | 60 53 38 | 954.5 | 157.8 | 19.68 | 18.37 | Yes, field | ||
| 791 | 22 55 05 | 60 53 02 | 911.0 | 82.3 | 19.90 | 18.52 | Yes, field | ||
| 801 | 22 54 34 | 60 51 19 | 760.3 | 366.9 | 19.92 | 18.59 | Yes | ||
| 808 | 22 54 40 | 60 48 31 | 542.9 | 303.1 | 19.94 | 18.70 | Yes, BMD(1153) | ||
| 831 | 22 54 13 | 60 45 59 | 329.3 | 553.2 | 20.01 | 18.45 | Yes |
Notes: † – Error in Vmagnitude is greater than 0.1 mag.

To identify emission line stars, we use -index () parameter, where and are the magnitude of a star in the H and H -continuum filter, respectively. In an area of , we could measure -index for 1065 stars and the same is plotted against colors in Figure 3. We estimated a mean -index iteratively for these stars by 3-sigma clipping. Seven such iterations resulted in a constant mean value of 0.097 mag and a RMS scatter () of 0.116 mag. Stars having -index within are therefore considered as having normal strength at H feature. A star is considered as H emitter if mag and H absorber if mag. The observed characteristics of stars with H emission are given in Table 6. H emission stars reported only by others in the literature are also listed in Table 6. This could be due to the variable nature of H emission from the stars.
We detect 29 H emission-line stars, and along with 15 more reported by Pigulski & Kopacki (2000) and Subramaniam et al. (2006), the total number of H emission-line stars in the region around the cluster have now increased to 44. Of these, thirteen are newly identified in the present work. Though some late-type dwarfs do show strong chromospheric H in emission, but a few false detection may not be ruled out. As a non-emission late-type star generally has a series of strong metal oxide absorption lines, such as TiO in its spectrum and this may lead to an under-estimation of their continuum, hence making the star an H emitter (Huang, Chen & Hsiao, 2006, e.g.).
3 Properties of the cluster
3.1 Radial density profile

We estimate the cluster center iteratively by calculating average X and Y positions of stars with mag within 80 pixels from eye estimated center, until it converged to a constant value. The coordinates of the cluster center are found to be and . Using this method, a typical error expected in locating the center is 5′′. To estimate extent of the cluster, we divide the cluster region into a number of concentric circles with an annulus of width . The projected radial stellar density profile is plotted in Figure 4 for three magnitude limits – e.g. =17, 18, 20 mag. The error bars denote Poisson statistics. The is parameterized as (King, 1962; Kaluzny & Udalski, 1992)
| (1) |
where and are the core radius of the cluster and central star density, respectively. As the observed area () is large compared to the cluster diameter, we estimate using outer region () of the cluster and to derive and , we performed a Levenberg-Marquardt non-linear fitting routine (Press et al., 1992) to equation 1. The fitted parameters are shown in Figure 4. We define extent of the cluster () as the radius at which equals 3 level above the field star density. Using optical data, we have estimated the core radius of about 1′ and cluster radius of 4005 for the cluster. This is also supported by the radial density profile fits at 2MASS K-band data. The catalogue of open cluster by Dias et al. (2002) have been reported the radius of the cluster as 25. To reduce the effect of field star contamination, we therefore, consider lower limit of radius as 35 for further analysis.
3.2 Color-magnitude diagrams

The ; and color-magnitude diagrams (CMDs) of the cluster region along with CMD of the field region are shown in Figure 5. Morphology of the CMDs is typical of a young-age open star cluster and the main sequence extends down to mag in CMD. It is seen that the field star contamination becomes more evident for stars with mag, therefore, a statistical criteria was used to remove the field star contamination, following procedure adopted by Sandhu, Pandey & Sagar (2003). For this purpose, we assume a uniform distribution of field stars in an area outside the cluster region (). The luminosity function (LF) derived from the CMD of the field region was subtracted from the LF of the cluster region. For a randomly selected star in the CMD of field region, the nearest star in the CMD of cluster region within mag and mag of the field star was removed. The necessary corrections for CF have also been considered in statistical subtraction. Statistical subtraction of data have been done till mag only as they have CF value 0.5. The diagram of statistically cleaned cluster sample is shown in Figure 5. Further, to select main-sequence members more reliably, we define blue and red envelope in statistically cleaned CMD and the same is shown in the left panel of Figure 6.
3.3 Interstellar reddening
3.3.1 Law of interstellar reddening
| Object | |||||||||
|---|---|---|---|---|---|---|---|---|---|
| NGC 7419 | 0.900.09 | 0.620.02 | 1.290.04 | 0.370.04 | 0.410.01 | 0.250.01 | 0.520.01 | 1.140.01 | 1.200.02 |
| Normal value | 0.72 | 0.62 | 1.25 | 0.32 | 0.43 | 0.27 | 0.56 | 1.13 | 1.21 |
| ID | BMD ID | Spectral Type | E(B-V) | =1.1 | ||||
|---|---|---|---|---|---|---|---|---|
| 8 | 687 | B2.5 II | 1.741 | 0.883 | 0.641 | 1.283 | 2.924 | 3.216 |
| 13 | 473 | B2.5 III | 1.648 | 0.891 | 0.623 | 1.245 | 2.754 | 3.030 |
| 15 | 1129 | B4.0 III | 1.669 | 0.752 | 0.639 | 1.266 | 2.833 | 3.116 |
| 16 | 190 | B0.0 III | 1.999 | 0.924 | 0.642 | 1.267 | 2.837 | 3.120 |
| 20 | 417 | B1/2 III | 1.845 | 0.912 | 0.638 | 1.263 | 2.903 | 3.193 |
| 12 | 389 | B1/2 III | 1.789 | 0.896 | 0.670 | 1.313 | 3.014 | 3.315 |
We investigated the nature of interstellar reddening towards the cluster direction using the color excess ratio method as described by Johnson (1968). We select stars with spectral types earlier than A0 by applying criterion of and on probable members of the cluster (§3.2). From this list we exclude stars showing either H emission (see§2.4) or NIR excess (see§4) as their reddening properties are likely to be different from the normal stars Kumar et al. (2004). We estimate intrinsic colors using Q-method (Johnson & Morgan, 1953, cf.) and iteratively estimate reddening free parameter Q [, where ], till the color excess ratios become constant within the photometric errors. For the first iteration, we assume . The color excesses are determined using intrinsic colors as derived from the MKK spectral type-luminosity class color relation given by Caldwell et al. (1993) for , , and and by Koornneef (1983) for , and . Mean values of color excess ratios derived for the cluster are given in Table 7 and except , all other color excess ratios are in agreement with that expected for normal interstellar matter (Cardelli, Clayton & Mathis, 1989). The value of () is significantly greater than the normal value of , which implies that the average dust grain sizes are smaller than average. The ratio of total-to-selective extinction is estimated using the relation (Whittet & van Breda, 1980) and it is found to be .
We have also determined the value of color excess ratios using our photometry and spectral classification of six stars (see Table 8) available in the literature (Caron et al., 2003; Beauchamp, Moffat & Drissen, 1994). Intrinsic colors 33 3 The intrinsic colors of Johnson in Wegner (1994) are converted into Cousins using Bessell (1979) transformation relations. are read from Wegner (1994) for and , from Fitzgerald (1970) for . The mean value of () using this method is in good agreement with the one derived from iterative Q-method. Further, the excess ratios at other wavebands, and mean value of () are also close to the one derived using Q-method (see Table 8).
Higher value of color excess ratio , as found above, is also supported by the CMD (Figure 5), in which the isochrones (Girardi et al., 2002, hereafter GRD02) are found to fit well with . Such anomalous values of are not uncommon for the interstellar matter in the Milkyway and a higher value of () has also been reported along lines of sight of other star forming clusters, for example, NGC 869 (Pandey et al., 2003, ;); Markarian 50 (Baume, Vázquez & Carraro, 2004, ;) and NGC 7510 (Barbon & Hassan, 1996, ;) However, they report normal value for other color excesses in these clusters. For further analysis, we have therefore used the normal value of color excess ratios except for the value , which is adopted as 0.90.

3.3.2 Determination of reddening

Figure 7 shows observed color-color, , diagram for the cluster region. To determine reddening , the intrinsic colors for main-sequence stars with solar metallicity (Schmidt-Kaler, 1982) are reddened along the reddening vector (). This reddened main-sequence suggests that for the cluster region varies from 1.5 to 1.9 mag, with a visual mean value of about 1.7 mag. This reddening variation ( mag) for cluster members is well above the typical width of intrinsic main-sequence stars i.e. mag, which is caused usually due to photometric accuracy and the presence of binary stars (Sagar et al., 1987). It therefore indicates the presence of variable reddening within the cluster region, which is also reported by Subramaniam et al. (2006). Few emission-line stars (open circles) are found to have mag and these may either be embedded deep in the parent cloud or be surrounded with circumstellar matter. Using iterative Q-method (§3.3.1), we derive mean value of as mag, which is same as estimated visually by color-color diagram, and hence we adopt this value in our further analysis.
3.4 Turn-off age of the cluster
Turn-off age of the cluster is determined by comparing the theoretical stellar evolutionary models, the Padova isochrones GRD02 for solar metallicity Z=0.019 with observed CMDs (see Figure 5). Theoretical isochrones for ages 4, 20 and 25 Myr, corrected for the mean reddening mag, are shown with solid lines and are visually fitted to the bluest envelope of CMDs consisting of probable members as selected in §3.2. It is found that results in a better isochrone fit in CMD than the normal value, (§3.3.1). Locations of the red supergiants (Caron et al., 2003) BMD 921 (M2.5Iab), BMD 696 (M2.5Iab) and BMD 435 (M2.5Iab) are found to be consistent with the isochrones, while BMD 139 (M3.5I) and BMD 950 (M7.5), both pulsating supergiants were prone to produce more scatter in distance and age estimate of NGC 7419. Thus, using the visual-fit method, the present data finds the turn-off age of the cluster to lie between 19 Myr to 25 Myr and hence we assign an age of Myr.
We also estimate age using morphological age method (Phelps, Janes & Montgometry, 1994; Pandey et al., 1997), which employes color-index parameter (CIP), defined as the difference in the color index between the blue turnoff point of the main-sequence and the color at the base of the red giant branch. For NGC 7419, CIP is calculated as 1.654 mag and it represents the age between 20 and 25 Myrs, which is in good agreement with our previous value. The present age estimate is similar to the one derived by Subramaniam et al. (2006) less than the 50 Myr given by Bhatt et al. (1993) and older than 14 Myr derived by Beauchamp, Moffat & Drissen (1994).
3.5 Distance to the cluster
The zero-age main-sequence fitting procedure (Figure 5) is used to derive the distance of the cluster and the distance modulus is estimated as mag which corresponds to a distance of pc. The distance determination is further performed using a maximum likelihood -minimization method which employes fitting two-dimensional distributions to stellar data in color magnitude space (Naylor & Jeffries, 2006; Mayne et al., 2007; Jeffries et al., 2007). This takes into account the effects of binary population as well as observed photometric errors. Assuming an age of Myr and a binary fraction of 0.5, the best-fit Padova isochrone with solar metallicity yields a distance modulus of 12.55 mag (Figure 6,§3.2). Emission-line stars were excluded from this fit. Adding a systematic error of 0.28 mag due to differential reddening to each data point would result with 68% confidence ranges from 12.24 to 12.76 mag. We, therefore adopt a distance of pc for NGC 7419, which is similar to the estimate of Subramaniam et al. (2006) but higher from the value reported by Beauchamp, Moffat & Drissen (1994) and Bhatt et al. (1993).
4 Near-Infrared Data and Intermediate mass stars
To understand the global scenario of star formation around NGC 7419, we use NIR data for point sources within a square degree region centered on and , which is 1423 west from the cluster center. It contains the entire cluster and the surrounding star forming region. Data have been obtained from the 2MASS Point Source Catalog (PSC) (Cutri et al., 2003). We have selected the sources based on the ‘read-flag’ which gives the uncertainties in the magnitudes. We retain 2MASS sources with ‘read flag’ values of 1-2 for good quality data in our analysis. The colors were transformed from 2MASS system to California Institute of Technology system using the relations given on the 2MASS web site 44 4 http://www.astro.caltech.edu/jmc/2mass/v3/transformations/ .


4.1 Color-color diagrams
The color-color diagram is plotted for the cluster region (471 stars) and the surrounding square degree region (22100 stars), in Figures 8. Solid lines represent unreddened main-sequence and giant branch (Bessell & Brett, 1988). The parallel solid lines are the reddening vectors for early and late-type stars (drawn from the base and the tip of two branches). Location of T-Tauri stars (Meyer, Calvet & Hillenbrand, 1997, TTS;), proto-star (PS) like objects, classical Be stars and Herbig Ae/Be (Dougherty et al., 1994; Hernandez et al., 2005) are also shown. The extinction ratio , and have been taken from Cardelli, Clayton & Mathis (1989). Stars below the reddening vectors are considered to have NIR excess. The asterisks represent all the stars with H emission (Table 6). Of 44 emission-line stars only 39 stars have NIR counterparts within . NIR excess is shown by 17 emission-line stars within the cluster region but 4 more emission-line stars are situated at the boundary of the reddening vector, therefore they have also considered as NIR excess stars within error bars in colors. From spectroscopic studies, Subramaniam et al. (2006) have identified them as Herbig Ae/Be stars. Therefore, NGC 7419 is a peculiar cluster having such a large number of Herbig Ae/Be stars. In surrounding region, 90 sources are found in the T-Tauri locus (Meyer, Calvet & Hillenbrand, 1997). These sources are considered to be mostly classical T-Tauri stars (Class II objects) with large NIR excesses and belong to the YSO population. There may be an overlap in NIR colors of Herbig Ae/Be stars and T-Tauri stars in the TTS region (Hillenbrand et al., 1992). Such a large number of young stars represent the youth of this region. But all the T-Tauri stars with NIR excesses are situated outside the cluster region.
4.2 Cluster Age from Herbig Ae/Be stars
Figure 9 shows color magnitude diagram for H emission stars (open circles; Table 6), NIR excess stars (black dots), stars with X-ray counterpart (asterisks; §8.3). Star BMD 950 is not shown as it shows a large error ( mag) in band. It is seen that most of Herbig Ae/Be stars are located to the right side of the main-sequence and to estimate their age, we use pre-main-sequence isochrones from Siess, Dufour & Forestini (2000), hereafter SES00, for ages 0.3, 0.5, 1, 2, 4 and 8 Myr, shown with dashed lines in Figure 9. For reference, the post-main-sequence isochrone of 25 Myr age GRD02 have been shown by continuous lines. Only one X-ray source and three emission-line star lie in the range of 3.5–8 Myr isochrones, which may arise due to field star contamination of the Herbig Ae/Be stars loci in the NIR color-color diagram (Figure 8). Therefore, considering only the large number of Herbig Ae/Be stars, i.e. emission-line stars with NIR excess, it is very likely that the turn-on age of the cluster cannot be more than 2 Myr.

4.3 Mass of Herbig Ae/Be stars using NIR color-magnitude diagram


Stellar masses are determined using NIR color-magnitude diagram. We prefer over or , as the waveband is less affected by the emission from circumstellar material (Bertot, Basri & Bouvier, 1988). Left panel of Figure 10 shows NIR CMD for the cluster region NGC 7419. The 4 Myr post-main-sequence isochrone GRD02 and pre-main-sequence evolutionary tracks for mass range SES00 are plotted assuming a distance of 3.2 kpc and a mean reddening of 1.70 mag (§3.3,§3.5). Reddening and extinction corrections to the isochrone and tracks are made using the relation and (Cardelli, Clayton & Mathis, 1989), where . Location of 21 Herbig Ae/Be stars in NIR CMD is represented by open circles and it is seen that 66% of these are located between the mass range . Only two stars lie in the mass range .
Right panel of Figure 10 represents NIR CMD for 90 probable YSO candidates (shown with filled circles) identified in a square degree region around the cluster (Figure 8). None of these YSOs are present in the cluster region and hence we argue that the population of YSOs is most likely associated with a local arm molecular cloud sh2-154 (Ungerechts et al., 2000), see §5 for detailed discussion. We, therefore, correct the theoretical isochrones SES00, for extinction assuming the cloud distance of 1.4 kpc (Khalil, Joncas & Nekka, 2004) and for reddening assuming a value of 0.4 mag/kpc towards the direction of NGC 7419 (Joshi, 2005). The corrected isochrones are shown with solid curves in the right panel of Figure 10 and they trace the locus of 6 Myr pre-main-sequence stars having masses in the range . It is observed that masses of all of the YSOs lie in the range indicating them to be T-Tauri stars. Therefore, almost all of the YSO candidates are low mass pre-main-sequence stars.
5 Spatial distribution of low mass pre-main-sequence candidates
| ID | IRAS PSC | Remark | ||||
|---|---|---|---|---|---|---|
| (Jy) | (Jy) | (Jy) | (Jy) | |||
| – | 22493+6018 | 7.04 | 2.39 | 3.12 | 48.91 | VMW Cep |
| 42 | 22527+6030 | 2.53 | 0.77 | 17.05 | 87.48 | VMZCep |
| – | 22525+6033 | 112.10 | 92.30 | 17.05 | 50.10 | M7.5Iab |
| 14 | 22520+6031 | 3.10 | 1.06 | 17.05 | 50.87 | M3.5 Iab |
| – | 22512+6100 | 108.50 | 93.30 | 16.68 | 15.27 | V386Cep |
| – | 22538+6102 | 1.04 | 0.49 | 6.50 | 70.00 | — |
| – | 22486+6028 | 0.85 | 0.37 | 4.95 | 53.07 | — |
| – | 22490+6043 | 0.54 | 0.35 | 5.35 | 39.51 | — |
| – | 22469+6053 | 0.46 | 0.25 | 5.55 | 71.76 | — |
| – | 22480+6056 | 0.30 | 0.25 | 5.34 | 68.93 | — |
| ID | Name | Remark | ||||
|---|---|---|---|---|---|---|
| MSX PSC | (Jy) | (Jy) | (Jy) | |||
| – | G108.6966+01.0686 | 6.70 | 5.80 | 3.72 | VMWCep | |
| – | G109.1599+01.1206 | 87.83 | 133.58 | 96.95 | M7.5 Iab | |
| 42 | G109.1632+01.0645 | 3.31 | 2.14 | 1.48 | VMZ Cep | |
| 5 | G109.1353+01.1118 | 3.40 | 2.00 | 1.68 | M2.5 Iab | |
| 4 | G109.1302+01.1321 | 3.43 | 2.11 | 1.33 | M2.5 Iab | |
| 7 | G109.1445+01.0947 | 1.71 | 0.71 | 0.74 | M2.5 Iab | |
| 14 | G109.0901+01.1184 | 3.38 | 2.41 | 1.58 | M3.5 Iab | |
| – | G109.2152+01.6007 | 63.48 | 83.70 | 66.06 | V386Cep |

In Figure 11, we show a square degree -band image, reproduced from DSS55 5 Digital sky survey – http://stdatu.stsci.edu/dss/, of the field containing YSO candidates and the cluster NGC 7419. Inner () and outer boundaries () of the cluster are encircled. Point sources from MSX (Midcourse Space Experiment) which surveyed the Galactic plane in four mid-infrared bands - A(8.28 m), C(12.13 m), D(14.65 m), and E(21.34 m) at spatial resolution of (Price et al., 2001), are also shown in Figure 11. Information about 10 IRAS (Infra-Red Astronomical Satellite) point sources and 8 MSX point sources are given in Table 9 and Table 10, respectively. The MSX sources are denoted by white open circles while asterisks represent IRAS sources. YSO candidates are denoted by open square boxes. Of 8 MSX sources, six are identified with five supergiants and a carbon star and the other two are G108.6966+01.0686, a carbon star VMW Cep (Kukarkin et al., 1968), and G109.2152+01.6007, a semi regular pulsating star V386 Cep (Stephenson, 1984). The cluster supergiants also have IRAS counterpart, and their presence in NGC 7419 is also supported from mid-infrared data.
In the following, we describe the attenuation properties of a square degree region around the cluster (see §4). Dobashi et al. (2005) recently produced extinction maps of the entire region of the Galaxy in the galactic latitude range by applying traditional star count technique to the optical DSS sources. We retrieved the FITS images of the extinction map of the field containing NGC 7419 and their surrounding region from their on-line website66 6 http://darkclouds.u-gakugei.ac.jp/astronomer/astronomer.html. In Figure 11, we overlay the contours of high resolution extinction map. The contours are plotted at 2.5 to 4.5 with an interval of 0.3 mag. The extinction towards the location of the cluster shows relatively low () values, in comparison to the outer region of the cluster especially, towards the west, the east and the south, where extinction increases up to , and mag, respectively. These enhanced attenuations are identified with the dense cloud clumps P5, P15 and P20 of dark cloud 699 (Dobashi et al., 2005). Using star count method it would be difficult to detect dust obscuration located at a cluster distance of 3.2 kpc, as the cloud would become inconspicuous due to large number of foreground stars (Dobashi et al., 2005; Medhi et al., 2008). We, therefore, argue that the dust obscuration would be due to a foreground cloud.
In order to see the dust emission characteristics of this cloud, we superimpose the IRAS 100m contours obtained from the Infrared Processing and Analysis Center (IPAC) on -band DSS image in Figure 12, left panel. The IRAS survey was done in four bands 12 m, 25 m, 60 m and 100 m from mid-infrared to far-infrared. The contours are plotted after smoothing the IRAS m image. The contours are drawn at 134 (outermost) to 204 with the increment of 10 . The IRAS dust emissions support the presence of dust obscuration at the location of cloud clumps P5, P15 and P20. The star count extinction map is seen to be highly correlated with the 100m IRAS dust map and represent the same morphology of the cloud. We also show the 12CO temperature map of the region, see right panel in Figure 12 (Kerton & Brunt, 2003). The contours are drawn for temperature ranges K with the increment of 0.5 K. The peak of CO emission is most likely associated with clump P5 ( westward). A slight mismatch might be the effect of low resolution of the extinction map (Dobashi et al., 2005). It is seen that 60% of total YSO population seems to be associated with the clumpy region P5. Therefore, the clump P5 may provide a fertile environment for the formation of the low mass stars.
Interestingly, the spatial distribution of TT stars is highly correlated with the extinction and IRAS dust map (see Figure 11), it is therefore likely that the population of YSOs (§4) might be associated with the foreground dark cloud. Avedisova (2002) identify a local arm star forming region Sh2-154, situated in the north-east direction from the cluster. Optical diameter and distance of Sh2-154 is estimated respectively as and 1.4 kpc (Blitz, Fich & Stark, 1982). Hence, the YSO population (Figure 8) could be part of Sh2-154 and associated with a dark cloud clump 699/P5 and 699/P15 as identified by Dobashi et al. (2005).
The effect of environment on the production of the low mass stars has been investigated with the help of the distribution of the reddening in the cloud by assuming that they are situated at the same distance. The value for each star was measured by tracing back to the intrinsic lines along the reddening vector found in Meyer, Calvet & Hillenbrand (1997). The value of is found to vary from 0 to 3 mag. Only one YSO has 5 mag. The spatial distribution of the from 0 to 5 mag is shown in Figure 13, left panel. No spatial gradient of is found with the spatial distribution of the YSOs. The frequency distribution of (Figure 13, right panel) represents that 77% YSOs are having less than 1.0 mag and 15% of YSOs with in between 1.0 to 2.0 mag. It shows that the environment for the YSOs is almost similar.
The effect of the youthfulness of the YSOs in the spatial distribution can also be investigated with the help , which is expected due to the presence of the circumstellar disk dissipating with time Oasa et al. (2006). For YSOs, it is determined by the method used in Matsuyanagi (2006) and it lies in the range mag. The distribution of (Figure 14, left panel) does not show any spatial gradient with distribution of the YSOs, indicating that the YSOs having different age are distributed uniformly within the cloud. Frequency distribution of the excess is shown in Figure 14, right panel and it indicates that 89% of YSOs have nearly similar age. This represents a uniform distribution of the star formation rate within the cloud.
The morphology of the cloud is almost the same for all the YSOs and we find very little age dispersion in the YSOs. There is no significant contribution of the external agents found in the formation of these YSOs in this cloud. Therefore, such a uniform distribution of YSO candidates might be the result of primordial fragmentation.


6 Mass function
| Magnitude range | Mass Range | Mean | Inner region | Outer region | Whole region | |||
| ( mag) | (M⊙) | log (M⊙) | N | log | N | log | N | log |
| MS | ||||||||
| 15.0 - 16.0 | 8.59 - 7.10 | 0.894 | 9 | 2.036 | 6 | 1.860 | 15 | 2.258 |
| 16.0 - 17.0 | 7.10 - 5.20 | 0.789 | 11 | 1.912 | 16 | 2.075 | 27 | 2.302 |
| 17.0 - 18.0 | 5.20 - 3.57 | 0.642 | 14 | 1.933 | 27 | 2.218 | 41 | 2.400 |
| 18.0 - 19.0 | 3.57 - 2.45 | 0.479 | 16 | 1.991 | 34 | 2.318 | 50 | 2.486 |
| 19.0 - 20.0 | 2.45 - 1.78 | 0.326 | 13 | 1.972 | 65 | 2.671 | 78 | 2.750 |
| 20.0 - 21.0 | 1.78 - 1.44 | 0.207 | 14 | 2.172 | 96 | 3.008 | 110 | 3.067 |
| PMS | ||||||||
| 7.00 - 6.00 | 0.544 | 4 | 1.505 | 7 | 1.748 | 11 | 1.945 | |
| 6.00 - 5.00 | 0.653 | 3 | 1.491 | 11 | 2.055 | 14 | 2.160 | |
| 5.00 - 4.00 | 0.740 | 5 | 1.800 | 4 | 1.703 | 9 | 2.056 | |
| 4.00 - 3.00 | 0.067 | 5 | 1.873 | 16 | 2.378 | 21 | 2.496 | |
The initial mass function (IMF) is the distribution of stellar masses that form in a star formation event in a given volume of space. It is an important result of star formation and together with the star formation rate, the IMF dictates the evolution and fate of galaxies and star clusters (Kroupa, 2002). However, the direct determination of IMF is not possible due to the dynamical evolution of stellar systems. Therefore, we derived MF which is often expressed by the power law, and the slope of the MF is given as :
| (2) |
where is the number of star per unit logarithmic mass interval. In the solar neighborhood the classical value derived by Salpeter (1955) is . In order to estimate the MF for the cluster region, we have used statistically cleaned sample described in §3.2. We have divided statistically cleaned sample for two star formation episodes. The first star formation episode is at 25 Myr and the masses corresponding to mag have reached to the main-sequence, therefore only main-sequence MF have been considered for this episode. In Figure 15, the MS represents the main-sequence band (selected in §3.2) and is drawn by long-dashed lines. The stars within this band are shown by solid dots. The main-sequence theoretical isochrone from GRD02 is shown by solid line at 25 Myr age with upper limit at mag because the stars above this point have been evolved from the main-sequence. Due to the above mentioned reasons, we have considered the stars with magnitude ranges mag for the main-sequence MF. The second episode is at age Myr, therefore pre-main-sequence MF has been derived for the stellar population attached with this episode. The pre-main-sequence theoretical isochrones by SES00 have been drawn by solid lines for ages 2 Myr and 0.1 Myr (upper limit of age in model), and by dashed lines with dots for masses ranges from 2 to 7 , respectively. The stars which are lying in between this age range have been used for the estimate of pre-main-sequence MF and shown by triangles in Figure 15. The Herbig Ae/Be stars, described in §4, are shown by open circles. All these stars are excluded in the estimation of main-sequence MF even though they are lying inside the selected MS band, and considered as pre-main-sequence stars and included in the estimation of pre-main-sequence MF. We have used the stars shown by triangles in Figure 15 and the Herbig Ae/Be stars inside the MS band for the estimation of pre-main sequence MF for masses down to due to the incompleteness of mass below this limit.
We have derived the MF from LF using the theoretical evolutionary models. The MF in two subregions i.e., the inner () and the outer (1′35) region of the cluster, respectively, as well as for the whole cluster region () are given in Table 11 and plotted in Figure 16.
The slope of the MF of the main-sequence stars in the inner region of the cluster is estimated as , which is flatter than the Salpeter (1955) value, while for the stars in the outer region, , which is similar to the Salpeter (1955) value. The value for the stars is thus steeper in the outer region indicating a preferential distribution of relatively massive stars towards the cluster center indicating a segregation of stellar masses. The slope for the MF for the whole cluster is , which is similar to the Salpeter value in the mass range of . This value of the MF is similar to the value estimated by Beauchamp, Moffat & Drissen (1994) i.e. estimated at age14 Myr and distance kpc for the cluster region.
The slopes of the pre-main-sequence MF for the intermediate mass range in the cluster are derived as for inner, for outer, and for whole cluster region. The value of the pre-main-sequence MF slope is significantly flatter than the Salpeter value.

7 Mass segregation
There is evidence for mass segregation in a few Galactic as well as LMC star clusters, with the highest mass stars preferentially found towards the center of the cluster (Sagar et al., 1988; Sagar & Richtler, 1991; Sagar & Griffiths, 1998; Pandey et al., 2001; Pandey et al., 2005; Kumar, Sagar & Melnick, 2008, see). It is a well accepted finding that stars in the clusters evolve rapidly towards a state of energy equipartition through stellar encounters i.e., mass segregation. However, observations of very young clusters (Sagar et al., 1988; Pandey, Mahra & Sagar, 1992; Pandey et al., 2005; Hillenbrand, 1997, e.g.,) suggest that the mass segregation may be the imprint of star formation itself.
We have subdivided the main-sequence sample (used for the main-sequence MF in §6) into two mass groups (; ) to characterize the degree of mass segregation in NGC 7419. Figure 17 shows cumulative distribution of main-sequence stars as a function of radius in two different mass groups. Effect of mass segregation can be seen in this figure in the sense that more massive stars () tend to lie towards the cluster center. The Kolmogorov-Smirnov (KS) test confirms the statement that the cumulative distribution of massive stars in the cluster is different from that of relatively less massive stars at a confidence level of 99%. There is a strong evidence of mass segregation in the main-sequence stars within this cluster. We estimated the relaxation time to decide whether the mass segregation discussed above is primordial or due to dynamical relaxation. To estimate the dynamical relaxation time , we have used the relation
| (3) |
where is the number of cluster stars, is the radius containing half of the cluster mass and is the average mass of the cluster stars (Spitzer & Hart, 1971). The total number of stars in the cluster region are estimated as 321 in the mass range (). For the half mass radius, we have used half of the cluster extent i.e., 1.63 pc. Taking average mass of the cluster as , we have estimated the dynamical relaxation time for the cluster as 8.0 Myr, which is lower than the turn-off age of the cluster i.e., 19 – 25 Myr. Therefore, we can conclude that the cluster is dynamically relaxed.


8 X-ray Data Analysis
| Parameter | NGC 7419 |
|---|---|
| Observation ID | 0201160501 |
| Start time (UT) | 02 Feb 2004 02:40:39 |
| Stop time (UT) | 02 Feb 2004 14:19:16 |
| Usable time(ks) | 39.62(MOS1),40.21(MOS2),35.35(PN) |
| EPIC mode | full frame |
| Optical filter | Medium |
We have used the archival X-ray data from the XMM-Newton observations of NGC 7419. The observations were proposed by Christian Motch to search for Be+white dwarfs binaries in NGC 7419. The observation details are given in Table 12. Our analysis is based on the CCD images from the European Photon Imaging Camera (EPIC). The details of the X-ray telescope and EPIC PN and MOS cameras are given by Jansen et al. (2001), Strüder et al. (2001) and Turner et al. (2001). Data reduction followed standard procedures using the XMM-Newton Science Analysis System software (SAS; version 7.0.0). Event files for MOS and PN are generated by using tasks and , respectively. Data from the three cameras were individually screened for high background episodes and the time intervals during which the total count rate (for single events of energy above 10 keV) in the instruments exceeded 0.35 and 1.0 counts s-1 for the MOS and PN detectors, respectively, were excluded.
8.1 Source detection and identification

| XID | Count Rates | Hardness ratio | Remarks | |||
|---|---|---|---|---|---|---|
| (h m s) | (° ′ ′′) | |||||
| 1 | 22 52 35 | 60 47 37 | 10.92 1.50 | -0.40 0.170 | 0.34 0.21 | IR |
| 2 | 22 52 40 | 60 54 06 | 1.44 0.58 | 0.25 0.393 | -0.20 | —— |
| 3 | 22 52 45 | 60 56 01 | 17.97 1.58 | 0.16 0.098 | -0.19 0.11 | IR |
| 4 | 22 52 46 | 60 54 00 | 2.61 0.74 | -0.01 0.276 | -0.58 0.48 | —— |
| 5 | 22 52 46 | 60 54 57 | 294.66 5.33 | 0.47 0.023 | -0.37 0.02 | IR |
| 6 | 22 52 49 | 60 50 01 | 3.89 0.73 | 0.82 0.357 | 0.28 0.19 | IR, PCM |
| 7 | 22 53 05 | 60 39 19 | 4.83 2.06 | -0.43 | 0.64 | —— |
| 8 | 22 53 06 | 60 57 08 | 4.15 0.83 | 0.19 0.512 | 0.77 0.26 | —— |
| 9 | 22 53 17 | 60 38 13 | 2.82 1.82 | 0.54 0.565 | -0.63 | IR |
| 10 | 22 53 21 | 60 41 09 | 5.05 0.73 | 0.21 0.167 | -0.10 0.17 | IR |
| 11 | 22 53 22 | 60 58 08 | 2.20 0.57 | 0.43 0.255 | -0.43 | —— |
| 12 | 22 53 23 | 60 46 12 | 3.91 0.54 | 0.12 0.145 | -0.34 0.18 | IR |
| 13 | 22 53 35 | 60 53 12 | 3.75 0.59 | 0.71 0.683 | 0.83 0.21 | PCM |
| 14 | 22 53 36 | 60 55 47 | 3.38 0.61 | 0.69 0.421 | 0.54 0.21 | PCM |
| 15 | 22 53 37 | 60 44 37 | 0.84 0.31 | 0.64 | 0.67 0.44 | PCM |
| 16 | 22 53 41 | 61 03 43 | 18.95 2.03 | 0.40 0.118 | -0.50 0.14 | IR |
| 17 | 22 53 42 | 60 59 38 | 3.18 0.75 | 0.04 0.233 | -0.10 0.31 | IR |
| 18 | 22 53 52 | 61 05 04 | 6.12 1.14 | 0.97 | 0.71 0.23 | PCM |
| 19 | 22 53 53 | 60 48 48 | 5.45 0.55 | 0.83 0.331 | 0.70 0.12 | IR, OPT, PCM, Cl |
| 20 | 22 53 57 | 60 59 14 | 1.32 0.51 | 0.58 0.406 | -0.41 0.46 | IR |
| 21 | 22 53 57 | 60 56 02 | 8.79 0.96 | 0.85 | 0.88 0.15 | IR, PCM |
| 22 | 22 54 00 | 60 54 15 | 1.56 0.41 | 0.70 | 0.63 0.31 | PCM |
| 23 | 22 54 00 | 60 48 22 | 2.56 0.43 | 0.70 | 0.75 0.21 | OPT, PCM, Cl |
| 24 | 22 54 04 | 60 45 45 | 0.69 0.24 | 0.08 0.321 | 0.13 0.19 | IR, OPT |
| 25 | 22 54 05 | 60 48 04 | 5.68 0.71 | 0.07 0.183 | 0.48 0.16 | IR, OPT, Cl |
| 26 | 22 54 07 | 60 43 54 | 1.75 0.37 | 0.28 0.230 | -0.22 0.26 | IR, OPT |
| 27 | 22 54 10 | 60 49 29 | 7.18 1.17 | -0.56 0.352 | 0.84 0.25 | Cl |
| 28 | 22 54 11 | 60 55 23 | 5.96 0.78 | 0.30 0.137 | -0.51 0.18 | IR |
| 29 | 22 54 12 | 60 47 51 | 1.64 0.37 | -0.48 | 0.75 0.28 | IR, OPT, Cl |
| 30 | 22 54 12 | 60 45 59 | 1.62 0.33 | 0.09 0.20 | -0.98 0.39 | IR, OPT, Cl |
| 31 | 22 54 16 | 60 50 36 | 5.61 0.73 | -0.16 0.17 | 0.41 0.17 | IR, OPT, Cl |
| 32 | 22 54 18 | 60 48 48 | 4.78 0.71 | 0.37 | 0.53 0.17 | IR, OPT, Cl |
| 33 | 22 54 21 | 60 59 42 | 24.48 1.52 | 0.02 0.06 | -0.65 0.10 | —— |
| 34 | 22 54 25 | 60 39 07 | 1.66 0.40 | 0.49 0.25 | -0.25 | IR |
| 35 | 22 54 27 | 60 48 44 | 1.40 0.38 | 0.60 0.52 | 0.50 0.31 | PCM, Cl |
| 36 | 22 54 29 | 60 43 49 | 1.64 0.55 | -0.06 0.29 | -0.18 | IR, OPT |
| 37 | 22 54 29 | 60 35 57 | 7.26 2.37 | -0.24 | 0.84 | —— |
| 38 | 22 54 30 | 60 48 12 | 1.54 0.36 | 0.85 0.69 | 0.65 0.28 | OPT, PCM, Cl |
| 39 | 22 54 35 | 60 50 05 | 5.96 1.05 | 0.60 0.20 | -0.43 0.21 | OPT, Cl |
| 40 | 22 54 39 | 60 41 03 | 4.48 0.59 | 0.32 0.14 | -0.58 0.19 | IR |
| 41 | 22 54 42 | 60 44 38 | 3.33 0.84 | -0.14 | 0.79 | IR, OPT |
| 42 | 22 54 44 | 60 44 01 | 1.50 0.39 | 0.46 | 0.60 | —— |
| 43 | 22 54 46 | 60 48 27 | 1.09 0.32 | 0.37 0.91 | 0.80 0.38 | —— |
| 44 | 22 54 47 | 60 45 18 | 1.25 0.34 | 0.78 | 0.56 | PCM |
| 45 | 22 54 49 | 60 52 01 | 1.14 0.35 | 0.78 | 0.53 | PCM |
| 46 | 22 54 50 | 60 43 29 | 3.78 0.54 | 0.93 0.83 | 0.87 0.19 | OPT, PCM |
| 47 | 22 54 55 | 60 47 42 | 2.25 0.42 | 0.31 0.21 | -0.03 0.22 | IR, OPT |
| 48 | 22 54 56 | 60 45 37 | 1.22 0.36 | 0.43 0.40 | 0.23 0.32 | IR, OPT |
| 49 | 22 54 58 | 60 55 27 | 2.91 0.56 | 0.74 | 0.88 0.29 | PCM |
| 50 | 22 55 02 | 60 53 11 | 1.40 0.48 | 0.86 | 0.60 | PCM |
| 51 | 22 55 05 | 60 36 45 | 4.92 2.32 | 0.93 | 0.79 | PCM |
| 52 | 22 55 16 | 60 54 07 | 3.07 0.60 | 0.97 0.72 | 0.72 0.24 | IR, OPT, PCM |
| 53 | 22 55 17 | 60 46 39 | 0.92 0.37 | 0.70 | 0.82 0.52 | IR, OPT, PCM |
| 54 | 22 55 22 | 60 53 52 | 3.12 0.61 | 0.96 | 0.63 0.23 | PCM |
| 55 | 22 55 22 | 60 58 10 | 12.19 1.22 | 0.01 0.11 | -0.30 0.14 | IR |
| 56 | 22 55 24 | 60 47 02 | 3.35 0.97 | -0.23 0.64 | 0.76 0.39 | —— |
| 57 | 22 55 27 | 60 57 18 | 2.14 0.61 | 0.20 0.27 | -0.70 0.44 | —— |
| 58 | 22 55 30 | 60 41 35 | 4.14 1.05 | -0.62 0.41 | 0.74 0.42 | —— |
| 59 | 22 55 31 | 60 51 39 | 6.48 1.25 | -0.46 0.45 | 0.84 0.28 | —— |
| 60 | 22 55 34 | 60 42 23 | 1.85 0.55 | 0.99 | 0.54 | PCM |
| 61 | 22 55 38 | 60 50 42 | 4.95 0.77 | 0.87 | 0.79 | PCM |
| 62 | 22 55 44 | 60 50 43 | 5.48 1.08 | -0.76 0.44 | 0.91 0.32 | —— |
| 63 | 22 55 46 | 60 46 48 | 7.41 0.48 | 0.93 | -0.12 | PCM |
| 64 | 22 55 47 | 60 44 58 | 9.86 1.08 | 0.58 0.13 | -0.42 0.13 | IR |
| 65 | 22 55 54 | 60 47 14 | 2.22 0.63 | 0.10 1.50 | 0.94 0.39 | —— |
| 66 | 22 55 56 | 60 56 50 | 2.94 0.83 | -0.02 0.30 | 0.14 0.37 | IR |
The source detection is based on the SAS point source detection algorithm . Three energy ranges were selected – a soft () band (0.3 – 0.7 keV), a medium () band (0.7 – 1.2 keV) and a hard () band (1.2 – 7.5 keV), and we built the corresponding images for the different instruments of the EPIC. Finally, source detection was performed on these images using task, which is a chain script of various sub tasks.
We inspected each source manually to reject false detections due to the instrumental artifacts, from the final list created by task. In this way, we found 66 sources with a combined maximum likelihood value greater than 10 in all three instruments. The details of all the genuine X-ray sources in the energy band 0.3 – 7.5 keV are tabulated in Table 13 and shown in Figure 18.
We cross-correlated the X-ray source list with our optical photometric source list and NIR 2MASS All Sky data release data (Cutri et al., 2003) within the search radius 6′′. The position of the stars in optical CCD are converted into and using the Guide Star Catalogue- II (GSC 2.2, 2001). There are 18 X-ray sources with optical counterparts and 31 with NIR counterparts found after cross-correlation. Furthermore, none of the Herbig Ae/Be stars is having an X-ray counterpart. The unidentified X-ray sources i.e., without having any optical or NIR counterparts within XMM-Newton field of view (), are 31 in number (47% of the total).
8.2 The detection limit


The analysis of detection limits in the XMM-Newton field of view is equally important to decide the X-ray emission level of undetected Herbig Ae/Be stars, as none of the Herbig Ae/Be stars is emitting X-rays. The faintest source detected above in the XMM-Newton field of view (FOV) has a count rate of counts s-1 in the PN detector. The detection limit is not constant throughout the field of view because of the following three reasons: (a) a gap between the CCDs, and unoverlapped detector areas leading to a non-uniform effective detection area, (b) the decreasing exposure duration from the FOV center to its edges, causing a non-uniformity in the effective exposure times as well, and (c) the dense population of the stars near the center of the cluster affecting the detection limit non-uniformly. We have neglected the effects of the gap between CCDs, as an approximation, and investigated the effects of other parameters on the detection limit.
We analyzed the exposure map created by the task for the PN detector in the energy band 0.3 – 7.5 keV to derive the effect of exposure duration. It displays a smooth decrease in the counts from the center of the FOV to its edges by about a factor of three. If we are not considering the background effect, the signal-to-noise ratio is smaller by a factor of for the source at the edges of the FOV compare to the source at the center. Therefore, the detection limit in the edges of the FOV will be twice the detection limit at the center of the FOV due to the non-uniformity of exposure duration.
The variations in the detection limit due to the dense clustering at the center of FOV have been determined using the approach by Sana et al. (2006). We computed an equivalent PN count rate in the energy band 0.3 – 7.5 keV due to the gap between CCDs. An empirical relation between count rates in the PN and MOS detectors was calculated and found to be approximately linear. For the sources which fall in the gaps between the PN CCDs, this relation is used to convert the MOS count rates into the PN count rates and these PN count rates are called pn-equivalent count rates. Figure 19, left panel, displays the source pn-equivalent count rates as a function of the distance from the center of the FOV i.e., the center of the cluster NGC 7419. We adjusted a four-degree polynomial by selecting the faintest sources to derive an empirical detection limit in terms of pn-equivalent count rates () as a function of distance () from the center of the FOV. This detection limit (in units of ) is shown by a solid line in Figure 19, left panel and described by the following relation:
| (4) |
where the distance is expressed in arcmin from the center of the FOV. Left panel of Figure 19 shows that the detection limit is higher in center of the FOV (), which is the cluster region as decided in §3.1. It might be the effect of the extended X-ray emission from the cluster region, discovered in §8.5. The detection limit increases towards the CCD edges, as estimated by the exposure map. Using mission count rate simulator, WebPIMMS77 7 WebPIMMS is a NASA’s HEASARC tool powered by PIMMS version 3.9. It is hosted at URL: http://heasarc.gsfc.nasa.gov/Tools/w3pimms.html, we converted the pn-equivalent count rates into fluxes and luminosities. Assuming a hydrogen column density () of , at 1.70 mag for the cluster NGC 7419, the Raymond-Smith single temperature optically thin thermal plasma models were used at temperatures (kT) of 0.2 keV, 1.0 keV and 2.0 keV. Results are displayed in Figure 19, right panel for different plasma temperatures. Luminosities are calculated for the distance of the cluster NGC 7419 i.e., 3.2 kpc. Within the cluster region (), the detection limit of flux varies from to for soft X-ray sources at kT=0.2 keV, to for X-ray sources at kT=1.0 keV, and to for X-ray sources at kT=2.0 keV. We have estimated the detection limit of 21 Herbig Ae/Be stars, according to their positions in the cluster region using equation 4. As majority of Herbig Ae/Be stars have X-ray temperatures greater than 1.0 keV (Stelzer et al., 2006; Hamaguchi, Yamauchi & Koyama, 2005), the detection limits for these stars are estimated as the median of the limiting X-ray luminosity () of Herbig Ae/Be stars i.e., .
8.3 Probable Members Using Hardness Ratio


We have determined the X-ray hardness ratio and defined as
| (5) |
| (6) |
where , and denote the soft band (0.3 – 0.7 keV), the medium band (0.7 – 1.2 keV) and the hard band (1.2 – 7.5 keV), respectively. For undetected sources, we used upper limits as a function of distance from the center of FOV to its edges in each the energy bands using the method mentioned in §8.2. In cases where no counts are observed in any one energy band, the or are either +1.0 (no soft counts) or -1.0 (no hard counts), we have replaced the zero counts value by the upper limits depending upon the source position in the CCD in that energy band. The hardness ratios and of the X-ray sources in the XMM-Newton FOV are displayed in Figure 20. X-ray sources are represented by solid dots, X-ray sources having optical counterparts, NIR counterparts and extended behavior are denoted by open circles, open squares and the symbol of star, respectively. X-ray sources with rightward arrows represent the upper limits in , and downward arrows represent the upper limits in . Solid lines represent hardness ratios derived from model spectra.
We have simulated the values of and using plasma model APEC (Atomic Plasma Emission Code) to relate these hardness ratios to the spectral properties of the sources and to decide the membership of X-ray sources in the cluster region. Using the EPIC-pn response matrices within XSPEC, we have generated model spectra for monothermal plasma (1T-APEC) and two-temperature plasma (2T-APEC : the coronal X-ray emission from active late-type stars is generally not monothermal and consistent with the 2T thermal plasma models, (Favata et al., 2003; Tsujimoto et al., 2002; Stelzer et al., 2006, see)). We considered plasma temperatures (kT) from 0.2 keV to 8.0 keV for 1T-APEC model, and kT1 from 0.2 to 0.8 keV with the combination of kT2 from 0.9 to 9.6 keV for 2T-APEC model at different hydrogen column density ()=, , , (for cluster region), .
The X-ray sources lying in between are probably the foreground stars having either NIR counterparts or optical counterparts. As the value of mean for the cluster is estimated as from the optical studies, X-ray stars located in between belong to nearly the same cluster environment. In Figure 20, the X-ray sources situated inside the dotted box are considered as probable members belonging to the cluster. Most of the X-ray sources inside this box are having only upper limits in the soft bands and have hard spectra, which is a consequence of the absorption of the soft components of the energy by the large column densities. A few sources are fitted neither by 1T-APEC model nor 2T-APEC model and show a soft energy component as well as a hard energy component. Most of these sources are unidentified sources not having any NIR or optical counterparts. They may be the foreground stars, whose positions are uncertain in hardness ratio diagram because of the large uncertainty in the hardness ratios. But, for a few X-ray sources, the uncertainty in hardness ratios is not so large that their location can be explained within the temperature range of the models. They may be either the foreground stars having very high hard energy component greater than 9 keV or the 1T-APEC and 2T-APEC model are not enough to characterise them.
8.4 X-ray Luminosity Function

X-ray luminosity function (XLF) is frequently employed to characterize a stellar population. We performed statistical analysis of XLF using Kaplan-Meier estimator of integral distribution functions. We have derived the median of weak-lined and classical T-Tauri stars in Taurus-Auriga region (age Myrs) using the data from Stelzer & Neuhäuser (2001) and for Herbig Ae/Be stars, we have used the sample of Stelzer et al. (2006) and Hamaguchi, Yamauchi & Koyama (2005). The median of four probable members in the cluster is estimated as 30.75 . For weak-lined T-Tauri, classical T-Tauri, and Herbig Ae/Be stars in the sample of Stelzer et al. (2006) and Hamaguchi, Yamauchi & Koyama (2005), the median have been estimated as 29.88, 29.07, 29.29 and 31.15 erg s-1, respectively. A comparison of the XLFs of T-Tauri stars and Herbig Ae/Be stars with the cluster members are shown in Figure 21.
The X-ray upper limits indicate that the Herbig Ae/Be stars in NGC 7419 are not systematically more active than T-Tauri in Taurus-Auriga region and Herbig Ae/Be stars in Stelzer et al. (2006). But the median value of XLF of Herbig Ae/Be stars in Hamaguchi, Yamauchi & Koyama (2005) is more than the upper limits in the cluster. Our exposure and resolution (see §8.5) are not enough to reach the median value of of T-Tauri stars, therefore, we can not conclude whether Herbig Ae/Be stars can have an XLF similar to either the T-Tauri stars or Herbig Ae/Be stars in Stelzer et al. (2006). A much deeper detection level is clearly needed in order to reach definitive conclusions concerning in the X-ray emission from Herbig Ae/Be stars. However, the more important conclusion to draw from this analysis is that the Herbig Ae/Be stars in NGC 7419 are not as active as in the sample of Hamaguchi, Yamauchi & Koyama (2005).
8.5 Extended X-ray Emission
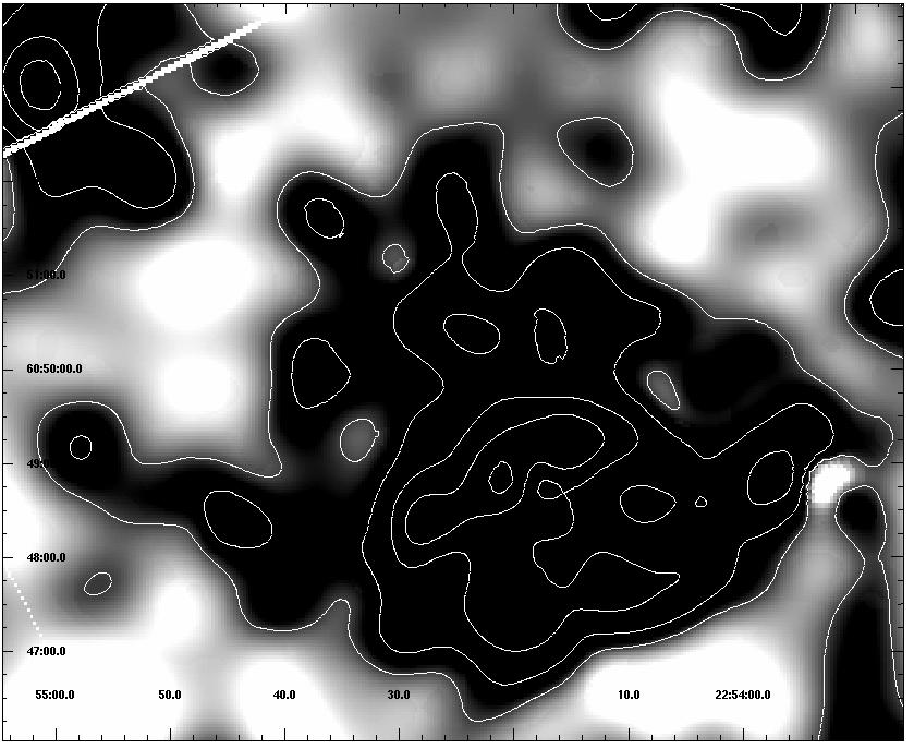

The extended emission from the cluster region NGC 7419 has been studied using MOS images. PN data were not used since chip gaps, bad columns, and the the out-of-time event correction would have complicated the analysis. We have created the MOS images and associated exposure maps in three bands: soft band (0.3 – 0.7 keV), medium band (0.7 – 1.2 keV) and hard band (1.2 – 7.5 keV). We have chosen adaptive smoothstyle with signal-to-noise ratio 10 in the task , for getting the faint emission from the cluster region. The resulting mosaic image with point sources are weighted, masked and exposure-corrected following the procedure described in the documentation for the SAS task 88 8 http://xmm.gsfc.nasa.gov/docs/xmm/sas/help/asmooth/index.html. The point sources are removed from the image using cheesemask but the background is not subtracted from it.
The signature of extended emission is not present in the soft band (0.3 – 0.7 keV) and medium band (0.7 – 1.2 keV) images of the MOS, because of the the absorption of the soft X-ray component due to the large hydrogen column density (). All the probable point sources have hard spectra, therefore, it is very likely that the extended emission is due to unresolved hard X-ray sources in the cluster. The X-ray contour map of the diffuse X-ray emission in energy band 1.2 – 7.5 keV is shown in Figure 22. The entire cluster region is covered by the central CCD of the MOS, therefore, we have chosen background regions of 22745 pixels beyond the diffuse emission but within the central CCD. The contours are plotted above the 3 of the mean background count rates. The extended X-ray emission from the cluster region contains 0.084 in 14611 pixels and corresponds to 5.76. The pixel size is set at . Therefore, the total extended emission has a size of 16.23 arcmin2. We have estimated the count rate from the extended emission as 1.38, after subtracting the mean background count rate. Using WebPIMMS ver3.9a, this count rate is converted into flux after considering Raymond-Smith thermal plasma model at 1 keV and estimated as , which corresponds to the luminosity in the energy band 1.2 – 7.5 keV. We have chosen the beamwidth as 50 pixel i.e., (smoothing beam width). We have estimated 18 beam elements in per arcmin2 region and estimated of unresolved sources as . Therefore, we are expecting 288 unresolved X-ray sources in the total diffuse component.
The of unresolved X-ray sources is comparable with the of T-Tauri stars i.e., 28 log 32 in energy band 0.5 to 8.0 keV, with a peak around log 29, (Feigelson et al., 2005). It can be explained by the presence of 288 T-Tauri stars in the cluster, which are not resolved by XMM-Newton observatory. Higher resolution (sub arcsec) data are urgently required to explore this issue.
8.6 X-Ray emission and Herbig Ae/Be stars
We have examined a sample of 21 Herbig Ae/Be in this cluster using 2MASS data, H photometry and the spectroscopic studies reported by Subramaniam et al. (2006). However, none of Herbig Ae/Be stars has an X-ray counterpart. In Figure 23, the distribution of the X-ray point sources which are having optical counterparts, supergiants (5 in number) and the Herbig Ae/Be stars within the cluster are shown by black open circles (with ID from Table 13), black open squares and white open circles, respectively.
The detection limit analysis §8.2 and the XLF (Figure 21) indicate that the observed from the low mass pre-main-sequence stars is less than upper limits of the detection (Stelzer & Neuhäuser, 2001, see,) i.e., 28 log 32 in energy band 0.5 to 8.0 keV, with a peak around log 29 , (Feigelson et al. 2005). Therefore, if a Herbig star is having a T-Tauri star as a binary companion, then we cannot detect the X-ray emission from it. Therefore, the generation of X-ray emission from Herbig Ae/Be stars (Zinnecker & Preibisch, 1994; Damiani et al., 1994; Stelzer et al., 2006, see,) might be the result of a T-Tauri binary companion which is not detectable in our study and we can not rule out the companion hypothesis for the generation of X-ray emission from Herbig Ae/Be stars. It might happen that the Herbig Ae/Be star itself is emitting X-rays but the level of the X-ray emission is less than the detection limit. A similar kind of process as in T-Tauri stars could then take place in the Herbig Ae/Be stars for the generation of X-rays.
9 Summary and Conclusions
A deep optical and narrow band H observations along with multi-wavelength archival data from the surveys such as 2MASS, MSX, IRAS and XMM-Newton are used to understand the global scenario of star formation and the basic parameters of the cluster NGC 7419. XMM-Newton archival data have also been used to study the X-ray emission mechanism from the cluster.
The radius of the cluster NGC 7419 has been found to be 4005 using radial density profile. The reddening law in the direction of the cluster is found to be normal at longer wavelengths but anomalous at shorter wavelengths. Reddening, , is found to be varying between 1.5 to 1.9 mag with a mean value mag. The turn-off age and the distance of the cluster are estimated to be Myr and , respectively. The MF for the main-sequence stars in the cluster is estimated as having in the mass range , which is a similar to the Salpeter (1955) value. Effect of mass segregation is found in the main-sequence stars which may be the result of dynamical evolution.
Using the NIR color-color diagram and narrow band H observations, we have identified 21 Herbig Ae/Be in the cluster region with the masses lying between 3 to . The ages of these Herbig Ae/Be stars are found to be in the range of 0.3 to 2.0 Myr. The significant difference between turn-off age and turn-on age of the cluster represents a second episode of star formation in the cluster. We have found 90 YSOs having masses in the range from 0.1 to with the help of NIR color-color diagram around the cluster. The presence of such a large number of NIR excess sources (T-Tauri stars) shows a recent star formation episode in the surroundings of the cluster region. Using extinction, dust and 12CO maps, we found that these YSOs are probably associated with a foreground star forming region Sh-154 and not related with the cluster region. We found no obvious trend in spatial distribution of YSOs with and . The dispersion in and is also very low which indicates that a majority of the YSOs are born at the same time in the same environment. Therefore, it is possible that primordial fragmentation of the cloud may be responsible for the formation of the low mass stars within this cloud.
We have detected 66 X-ray sources in the observed field by XMM-Newton observatory using archival X-ray data. Out of these sources, 23 are knowm to be the probable members of the cluster based on analysis of their X-ray colors. Fifteen X-ray sources are without any optical or NIR counterparts. These may be the young embedded sources which need to be investigated further. We have derived the detection limits of X-ray observations based on the position of the X-ray source in the field of view and on its energy spectrum. Thus, the median value for the detection limit for the 21 Hebig Ae/Be stars in the field is . We have compared the XLF for the cluster members with the T-Tauri stars and Herbig Ae/Be stars. Because of insufficient exposure and resolution, the sensitivity was not enough to reach the level of the median X-ray luminosity observed in T-Tauri stars in Taurus-Auriga region and Herbig Ae/Be stars in Stelzer et al. (2006). Therefore a conclusive comparison of X-ray properties of the stars cannot be made. However, the comparison indicates that Herbig Ae/Be stars in NGC 7419 tend to be less X-ray luminous than in the sample of Hamaguchi, Yamauchi & Koyama (2005), which shows that X-ray activity level of the Herbig Ae/Be stars is not more than in the T-Tauri stars. Therefore, we can support the binary T-Tauri companion hypothesis for the generation of X-rays in Herbig Ae/Be stars. It is also possible that a Herbig Ae/Be star is itself emitting X-rays but the level of the X-ray emission is similar to that of the T-Tauri stars. The cluster region shows an extended X-ray emission with a total luminosity estimated to be . This diffuse emission might be the result of X-ray emission from T-Tauri type stars which could not be resolved by XMM-Newton observations. It requires 288 T-Tauri stars each having , if it originates from such stars. High resolution deep observations such as from CHANDRA are required for a detailed analysis of this cluster region.
acknowledgments
Authors are thankful to the anonymous referee for constructive comments. This publication makes use of data products from XMM-Newton archives using the high energy astrophysics science archive research center which is established at Goddard by NASA. We acknowledge Dr. Randall Smith from Goddard Space Flight Center NASA and XMM-Newton Help Desk for their remarkable support in X-ray data analysis. This research has also made use of data from the Two Micron All Sky Survey, which is a joint project of the University of Massachusetts; the Infrared Processing and Analysis Center/California Institute of Technology, funded by the National Aeronautics and Space Administration and the National Science Foundation and VizieR catalogue access tool, CDS, Strasbourg, France. One of us (BK) acknowledges support from the Chilean center of Astrophysics FONDAP No. 15010003.
References
- Avedisova (2002) Avedisova V. S., 2002, Astron. Reports, 46, 193
- Beauchamp, Moffat & Drissen (1994) Beauchamp A., Moffat A. F. J., Drissen L., 1994, ApJS, 93, 187
- Baume, Vázquez & Carraro (2004) Baume G., Vázqez R., Carraro G., 2004, MNRAS, 355, 475
- Barbon & Hassan (1996) Barbon R., Hassan S. M., 1996, A&AS, 115, 325
- Bertot, Basri & Bouvier (1988) Bertout C., Basri G., Bouvier J., 1988, ApJ, 330, 350
- Bessell (1979) Bessell M. S., 1979, PASP, 91, 589
- Bessell & Brett (1988) Bessell M. S., Brett J. M., 1988, PASP, 100, 1134
- Bhatt et al. (1993) Bhatt B. C., Pandey A. K., Mohan, V. Mahara H. S., Paliwal, D. C., 1993, Bull. Astron. Soc. India, 21, 33
- Blanco et al. (1955) Blanco V., Nassau J. J., Stock J., Wehlau W., 1955, ApJ, 121, 637
- Blitz, Fich & Stark (1982) Blitz L., Fich M., Stark A. A., 1982, ApJS, 49, 183
- Caldwell et al. (1993) Caldwell A. R. John, Cousins A. W. J., Ahlers C. C., Wamelen P. van, Maritz E. J., 1993, SssAAO Circ. 15
- Cardelli, Clayton & Mathis (1989) Cardelli J. A., Clayton G. C., Mathis J. S., 1989, ApJ, 345, 245
- Caron et al. (2003) Caron G., Moffat A., St-Louis N., Wade G. A., 2003, AJ, 126, 1415
- Cutri et al. (2003) Cutri R. M., Skrutskie M. F., van Dyk S., Beichman C. A., Carpenter J. M., Chester T., Cambresy L., Evans T. et al., 2003, The IRSA 2MASS All-Sky Point Source Catalog, NASA/IPAC Infrared Science Archive http://irsa.ipac.caltech.edu/applications/Gator/
- Damiani et al. (1994) Damiani F., Micela G., Sciortino S., Harnden F. R. Jr., 1994, ApJ, 436, 807
- Dobashi et al. (2005) Dobashi K., Uehara H., Kandori R., Sakurai T., Kaiden M., Umemoto T., Sato F., 2005, PASP, 57, 1
- Dias et al. (2002) Dias W. S., Alessi B. S., Moitinho, A., Lépine J. R. D., 2002, A&A, 389, 871
- Dougherty et al. (1994) Dougherty S. M., Waters L. B. F. M., Burk G., Cote J., Cramer N., van Kerkwijk M. H., Taylor A. R., 1994, A&A, 290, 609
- Favata et al. (2003) Favata F., Giardino G., Sciortino S., Damiani F., 2003, A&A, 403, 187
- Feigelson et al. (2005) Feigelson E. D., Getman K., Townsley L., Garmire G., Preibisch T., Grosso N., Montmerle T., Muench A., McCaughrean M., 2005, ApJS, 160, 379
- Fitzgerald (1970) Fitzgerald M. P., 1970, A&A, 4, 234
- Girardi et al. (2002) Girardi L., Bertelli G., Bressan A., Chiosi C., Groenewegen M. A. T., Marigo P., Salasnich B., Weiss A., 2002, A&A, 391, 195
- Hamaguchi, Yamauchi & Koyama (2005) Hamaguchi K., Yamauchi S., Koyama K., 2005, ApJ, 618, 360
- Hernandez et al. (2005) Hernandez J., Calvet N., Hartmann L., Briceno C., Sicilia-Aguilar A., Berlind P., 2005, AJ, 129, 856
- Hillenbrand et al. (1992) Hillenbrand L. A., Strom S. E., Vrba F. J., Keene J., 1992, ApJ, 397, 613
- Hillenbrand (1997) Hillenbrand L. A., 1997, AJ, 113, 1733
- Huang, Chen & Hsiao (2006) Huang F., Chen W. P., Hsiao W. S., 2006, JTAM, 4, 27
- Jansen et al. (2001) Jansen F., Lumb D., Altieri B., Clavel J., Ehle M., Erd C., Gabriel C., Guainazzi M. et al., 2001, A&A, 365, 1
- Jeffries et al. (2007) Jeffries R. D., Oliveira J. M., Naylor, T., Mayne N. J., Littlefair S. P., 2007, MNRAS, 376, 580
- Johnson & Morgan (1953) Johnson H. L., Morgan W. W., 1953, ApJ, 117, 313
- Johnson (1968) Johnson H. L., 1968, in Middlehurst B. M., Aller, L.H., eds, Nebulae and Interstellar Matter. Univ. Chicago, 191
- Joshi (2005) Joshi Y. C., 2005, MNRAS, 362, 1259
- Kaluzny & Udalski (1992) Kaluzny J., Udalski A., 1992, Acta Astron., 42, 29
- Kerton & Brunt (2003) Kerton C. R., Brunt C. M., 2003, A&A, 399, 1083
- Khalil, Joncas & Nekka (2004) Khalil A., Joncas G., Nekka F., 2004, ApJ, 601, 352
- King (1962) King, I., 1962, AJ, 67, 471
- Koornneef (1983) Koornneef J., 1983, A&A, 128, 84
- Kroupa (2002) Kroupa P., 2002, Science, 295, 82
- Kukarkin et al. (1968) Kukarkin B. V., Efremov Yu. N., Frolov M. S., Medvedeva G. I., Kholopov P. N., Kurochkin N. E., Kukarkina N. P., Perova N. B. et al., IBVS, 1968, 311, 1
- Kumar et al. (2004) Kumar Brijesh, Sagar Ram, Sanwal B. B., Bessell M. S., MNRAS, 353, 991
- Kumar, Sagar & Melnick (2008) Kumar B., Sagar R., Melnick J., 2008, MNRAS, 386, 1380
- Landolt (1992) Landolt A. U., 1992, AJ, 104, 340
- Matsuyanagi (2006) Matsuyanagi I., Itoh Y., Sugitani K., Oasa Y., Mukai T., Tamura M., 2006, PASJ, 58, 29
- Mayne et al. (2007) Mayne N. J., Naylor T., Littlefair S. P., Saunders Eric S., Jeffries R. D., 2007, MNRAS, 375, 1220
- Medhi et al. (2008) Medhi, B. J., Maheswar G., Pandey J. C., Kumar T. S., Sagar R., 2008, MNRAS, 388, 105
- Meyer, Calvet & Hillenbrand (1997) Meyer M., Calvet N., Hillenbrand L. A., 1997, AJ, 114, 288
- Moffat & Vogt (1973) Moffat A. F. J., Vogt N., 1973, A&A, 23, 317
- Naylor & Jeffries (2006) Naylor T., Jeffries R. D, 2006, MNRAS, 373, 1251
- Nilakshi & Sagar (2002) Nilakshi, Sagar R., 2002, A&A, 381, 65
- Oasa et al. (2006) Oasa Y., Tamura M., Nakajima Y., Itoh Y., Maihara T., Iwamuro F., Motohara K., Hayashi S. S. et al., 2006, AJ, 131
- Pandey, Mahra & Sagar (1992) Pandey A. K., Mahra H. S., Sagar R., 1992, Bull. Astron. Soc. India, 20, 287
- Pandey et al. (1997) Pandey A. K., Durgapal A. K., Bhatt B. C., Mohan V., Mahra H. S., 1997, A&A, 122, 111
- Pandey et al. (2001) Pandey A. K., Nilakshi, Ougra K., Sagar R., Tarusawa K., 2001, A&A, 374, 504
- Pandey et al. (2003) Pandey A. K., Upadhyay K., Nakada Y. , Ogura K., 2003, A&A, 397, 191
- Pandey et al. (2005) Pandey A. K., Upadhyay K., Ougra K., Sagar R., Mohan V., Mito H., Bhatt H. C., Bhatt B. C., 2005, MNRAS, 358, 1290
- Phelps, Janes & Montgometry (1994) Phelps R. L., Janes K. A., Montgomery K. A., 1994, AJ, 107, 1079
- Pigulski & Kopacki (2000) Pigulski A., Kopacki G., 2000, A&A, 146, 465
- Press et al. (1992) Press, W. H., Teukolsky, S. A., Vetterling, W. T., et al. 1992, Numerical recipes in FORTRAN. The art of scientific computing.
- Price et al. (2001) Price S. D., Egan M. P., Carey S. J., Mizuno D. R., Kuchar T. A., 2001, AJ, 121, 2819
- Sagar et al. (1987) Sagar Ram, 1987 MNRAS, 228, 483
- Sagar et al. (1988) Sagar R., Miakutin V. I., Piskunov, A. E., Dluzhnevskaia O. B., 1988, MNRAS, 234, 831
- Sagar & Richtler (1991) Sagar R., Richtler T., 1991, A&A, 250, 324.
- Sagar & Griffiths (1998) Sagar R., Griffiths W. K., 1998, MNRAS, 299, 777
- Salpeter (1955) Salpeter E. E., 1955, ApJ, 121, 161.
- Sana et al. (2006) Sana H., Gosset E., Rauw G., Sung H., Vreux J.-M., 2006, A&A, 454, 1063
- Sandhu, Pandey & Sagar (2003) Sandhu T. S., Pandey A. K., Sagar R, 2003, A&A, 408, 515
- Schmidt-Kaler (1982) Schmidt - Kaler Th., 1982, In: Landolt/Bornstein, Numerical Data and Functional Relationship in Science and Technology, New series, Group VI, Vol. 2b, Scaifers K. & Voigt H. H. (eds.) Springer - Verlog, Berlin, p. 14
- Siess, Dufour & Forestini (2000) Siess L., Dufour E., Forestini M., 2000, A&A, 358, 593
- Spitzer & Hart (1971) Spitzer L. Jr., Hart M. H., 1971, ApJ, 164, 399
- Stetson (1987) Stetson P. B., 1987, PASP, 99, 191
- Stetson (1992) Stetson P. B., 1992, in ASP Conf. Ser. Vol. 25, Astronomical Data Analysis Software and Systems I. Astron. Soc. Pac., ed. Worrall D. M., & Biemesderfer C., Barnes J., San Francisco, 297
- Stelzer & Neuhäuser (2001) Stelzer B., Neuhäuser R., 2001, A&A, 377, 538
- Stelzer et al. (2006) Stelzer B., Huélamo N., Micela G., Hubrig S., 2006, A&A, 452, 1001
- Stephenson (1984) Stephenson C. B., 1984, PW&SO, 3, 1
- Strüder et al. (2001) Strüder L., Briel U., Dennerl K., Hartmann R., Kendziorra E., Meidinger N., Pfeffermann E., Reppin C., 2001, A&A, 365, 18
- Subramaniam et al. (2006) Subramaniam A., Mathew B., Bhatt B. C., Ramya S., 2006, MNRAS, 370, 743
- Tsujimoto et al. (2002) Tsujimoto M., Koyama K., Tsuboi Y., Goto M., Kobayashi N., 2002, ApJ, 556, 574
- Turner et al. (2001) Turner M. J. L., Abbey A., Arnaud M., Balasini M., Barbera M., Belsole E., Bennie P. J., Bernard J. P. et al., 2001, A&A, 365, 27
- Ungerechts et al. (2000) Ungerechts H., Umbanhowar P., Thaddeus P., 2000, ApJ, 537, 221
- van de Hulst et al. (1954) van de Hulst H. C., Mullar C. A., Oort J., 1954, BAN, 12, 117
- Wegner (1994) Wegner W., 1994, MNRAS, 270, 229
- Whittet & van Breda (1980) Whittet D. C. B., van Breda I. G., 1980, MNRAS, 192, 467
- Zinnecker & Preibisch (1994) Zinnecker H., Preibisch T., 1994, A&A, 292, 152