Emergence of a Quasar Outflow
Abstract
We report the first discovery of the emergence of a high-velocity broad-line outflow in a luminous quasar, J105400.40+034801.2 at redshift . The outflow is evident in ultraviolet C iv and Si iv absorption lines with velocity shifts km s-1 and deblended widths FWHM 4000 km s-1. These features are marginally strong and broad enough to be considered broad absorption lines (BALs), but their large velocities exclude them from the standard BAL definition. The outflow lines appeared between two observations in the years 2002.18 and 2006.96. A third observation in 2008.48 showed the lines becoming 40% weaker and 10% to 15% narrower. There is no evidence for acceleration or for any outflow gas at velocities 23,000 km s-1. The lines appear to be optically thick, with the absorber covering just 20% of the quasar continuum source. This indicates a characteristic absorber size of cm, but with a BAL-like total column density and average space density cm-3. We attribute the emergence of the outflow lines to a substantial flow structure moving across our line of sight, possibly near the ragged edge of the main BAL flow or possibly related to the onset of a BAL evolutionary phase.
Keywords:
galaxies: active — quasars: general — quasars: absorption lines — quasars: individual: J105400.40+034801.21 Introduction
Accretion disk outflows are an important part of the quasar phenomenon. They are known to be present in at least 50% of optically-selected quasars (Hamann & Sabra, 2004; Nestor et al., 2008; Ganguly & Brotherton, 2008; Rodríguez Hidalgo et al., 2008). They might play a critical role in the accretion physics and in the observational properties of quasars, and they might expel enough metal-rich gas and kinetic energy to have a major impact on star formation and galaxy evolution in their surroundings (Kauffmann & Haehnelt, 2000; Richards et al., 2002; Di Matteo et al., 2005; Everett, 2005; Proga, 2005). The outflows appear most conspicuously in quasar spectra as broad absorption lines (BALs), which typically have velocity widths of 5000–20,000 km s-1. However, there is also a variety of weaker and narrower outflow lines that are just as common as BALs. These include the so-called “mini”-BALs, which appear at velocities from near 0 to 0.2 with profile widths from the BAL range down to a few hundred km s-1. Understanding the relationships between the various outflow lines is fundamental to our understanding of the outflows themselves. For example, in one scenario, the different line types represent different manifestations of a single outflow phenomenon viewed at different angles (Elvis, 2000; Ganguly et al., 2001). Alternatively, they might represent an evolutionary sequence, where weak mini-BALs appear near the beginning or end of a more powerful BAL outflow phase (Hamann & Sabra, 2004).
Variability studies can help test these ideas by providing constraints on the outflow dynamics, stability, location and basic physical properties. Recent studies have shown, for example, that mini-BALs tend to be more variable than the broader and stronger BALs (Gibson et al., 2008; Rodríguez Hidalgo et al., 2008; Capellupo et al., 2008). Approximately half of mini-BALs show significant variations on time scales from a few years to few months in the quasar rest-frame. In rare cases, weak mini-BALs become much stronger and broader like BALs, or they disappear altogether. Following the emergence of a quasar outflow would be particularly valuable, but we know almost nothing about such occurances because variability programs start with quasars that are already known to have outflow lines. The only known case of an emerging BAL outflow was in a narrow line Seyfert 1 galaxy at redshift 0.03 (Leighly et al., 2005; Leighly, 2008). The dramatic appearance of BALs in this object is surprising because it is much less luminous (by a factor of 100) than typical BAL quasars.
In this paper, we report the first discovery of an emerging high-velocity BAL-like outflow in a luminous quasar, J105400.40+034801.2 at redshift 2.1. We observed this quasar as part of a program to study metal-strong damped Ly (DLA) absorption systems (Herbert-Fort et al., 2006; Kaplan & et al., 2008). Those data showed the new appearance of broad outflow lines compared to spectra obtained several years earlier by the Sloan Digital Sky Survey (SDSS). In the sections below we discuss the observations (§2), the measured properties of the outflow lines (§3), and some theoretical implications of our results (§4).
2 Observations
The Sloan Digitial Sky Survey (SDSS) obtained the first high-quality spectrum of J105400.40+034801.2 on 5 March 2002 (2002.18). We retrieved the fully reduced spectrum from the SDSS archives, Data Release 6. This spectrum covers wavelengths from 3805 Å to 9210 Å at resolution (150 km s-1). The absolute fluxes measured through through a 3′′ aperture fiber are expected to be accurate to within a few percent (Adelman-McCarthy et al., 2008). The emission line redshift and the blue and red magnitudes reported by the SDSS are , and , respectively. We also note that this quasar is radio-quiet based on a non-detection in the FIRST radio survey (Becker, White, & Helfand, 1995).
We observed J105400.40+034801.2 on 16 December 2006 (2006.96) using the Multi-Mirrored Telescope (MMT) Spectrograph in the blue channel with the 800 groove/mm grating. Combined with a 1.5′′ wide slit, this setup provided wavelength coverage from 3090 Å to 5095 Å at resolution (220 km s-1). The exposure time was 720 s. After noticing the broad outflow lines in the MMT data, we obtained another spectrum on 30 May 2008 (2008.48) using the Low Resolution Imaging Spectrograph (LRIS) at the Keck Observatory. In this case, a 600 groove/mm grating blazed at 6000 Å and a 1′′ entrance slit provided wavelength coverage from 3105 Å to 5600 Å at resolution (300 km s-1). The total exposure time was 400 s. The observations at the MMT and Keck were both performed with the slit at the parallactic angle. The spectra were extracted and processed by standard techniques using the Low Redux Pipeline11 1 http://www.ucolick.org/xavier/LowRedux/index.html software package. The relative fluxes were calibrated using spectrophotometric standards observed on the same night. The absolute fluxes have uncertainties up to 50%.
3 Results
Figure 1 shows the three spectra obtained in 2002.18 (SDSS), 2006.96 (MMT) and 2008.41 (Keck). The wavelengths in the quasar rest frame are based on reported by the SDSS. The vertical flux scale in the figure applies to the SDSS spectrum. The other spectra are scaled vertically to match the SDSS fluxes at continuum wavelengths. The SDSS and MMT spectra are shown after smoothing for easier display. This smoothing has no effect on the appearance of broad features like the outflow lines and the broad emission lines (BELs).
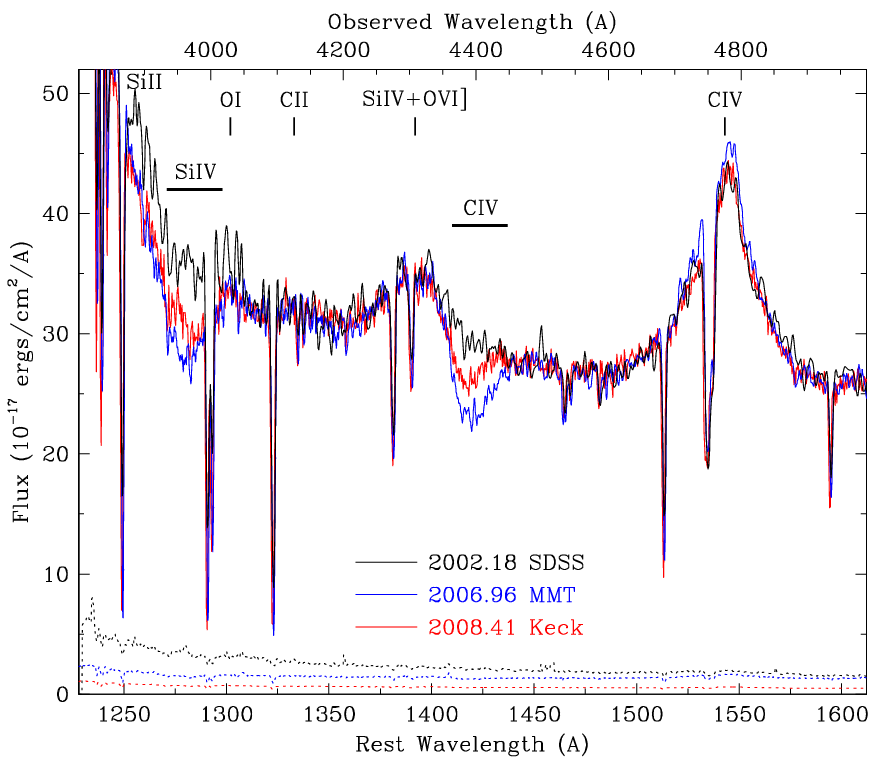
Broad high-velocity outflow lines are clearly present in Si iv 1394,1403 and C iv 1548,1551 in the 2006.96 and 2008.48 spectra. They appeared in 1.54 yr (rest frame) between the 2002.18 and 2006.96 observations, and then they weakened again 0.47 years later in the 2008.48 measurement. Meanwhile, the BEL profiles and equivalent widths (including Ly and C iii] 1909 not shown in Fig. 1) varied by 5%. The discovery spectrum of J105400.40+034801.2 obtained in 1988.15 (Clowes & Campusano, 1994) is much noisier and has a lower resolution () than the data shown in Figure 1. Outflow lines like the ones measured in 2006.96 would probably not be detectable in those data. However, the 1988.15 spectrum does rule out the presence of broad absorption features with 2 or more times the strength of the lines in 2006.96. No other outflow lines in the broad outflow system are detected in any of the data. The 2006.96 and 2008.48 spectra both have a depression at the position of N v 1239,1243 that is consistent with the broad absorption in C iv and Si iv. However, we cannot confirm the reality of this feature because the spectra at those wavelengths are severely contaminated by Ly forest lines.
To measure the outflow lines quantitatively, we define a “pseudo”-continuum across the true quasar continuum and the tops of the BELs. This pseudo-continuum matches the 2008.48 spectrum except at the wavelengths of the broad absorption, where it follows the 2002.18 data. The result is shown in the top panel of Figure 2. Notice that the pseudo-continuum ignores the bump in the 2002.18 SDSS spectrum around 3900 Å (1260 Å rest). We attribute this bump to an anomaly in the SDSS flux calibration. Our experience with many similar SDSS spectra indicates that anomalies like this do sometimes occur near the blue edge of the SDSS wavelength coverage. In any case, this feature is not related to the Si iv outflow line because it has no analog near the C iv feature.
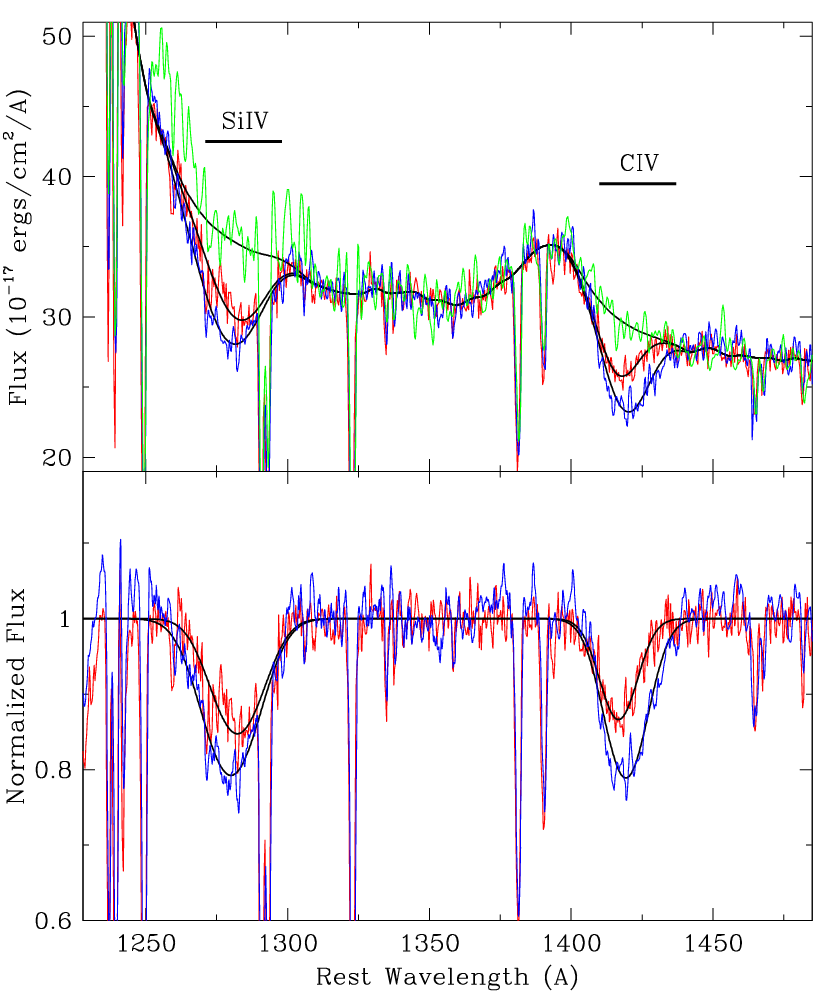
The bottom panel in Figure 2 shows the 2006.96 and 2008.48 spectra normalized by the pseudo-continuum. We fit the broad Si iv and C iv absorption lines in these normalized spectra using gaussian optical depth profiles. The Si iv and C iv transitions are doublets with velocity separations of 500 km s-1 and 1930 km s-1, respectively. Our fits include one gaussian per doublet member, with the redshifts and doppler velocities tied together. We assume that the doublet members have equal strengths based on the evidence for line saturation described in §4.1. In our fitting procedure, this means forcing the optical depths within the doublets to be equal even though their actual ratios based on oscillator strengths should be 2:1. The fits assume implicitly that the absorbing gas fully covers the quasar emission regions. We will discuss the effects of partial covering and line saturation in §4.1 below.
Figure 2 shows the final fits to the broad outflow lines. Table 1 lists some of the derived results, including the rest equivalent width (REW) of the entire blended doublet, and the absorption redshift (), the velocity shift ( measured from ), the full width at half minimum (FWHM) of the individual doublet lines, and the logarithmic ionic column density () derived from the weaker doublet members. Note that the column densities are lower limits because of probable saturation effects (§4.1).
| Line | REW | FHWM | |||
| (Å) | (km s-1) | (km s-1) | (cm-2) | ||
| ———————— 2006.96 (MMT) ———————— | |||||
| Si IV | 6.21 | 1.833 | 26,430 | 4830 | 14.84 |
| C IV | 4.83 | 1.835 | 26,270 | 3660 | 15.08 |
| ———————— 2008.48 (Keck) ———————— | |||||
| Si IV | 4.07 | 1.838 | 25,900 | 4330 | 14.66 |
| C IV | 2.54 | 1.830 | 26,810 | 3160 | 14.80 |
The broad outflow lines in 2006.96 had velocity shifts km s-1 and deblended FWHMs near 4000 km s-1. The actual measured width of the C iv blend was FWHM 4320 km s-1. These features are strong and broad enough to be considered BALs. However, their large velocity shifts lead to a balnicity index of zero, which excludes them from the standard BAL definition (Weymann et al., 1991). Their appearance in 2006.96 corresponds to strengthening by at least a factor of 5 compared to the 2002.18 observation. Then they became roughly 40% weaker and 10% to 15% narrower by 2008.48.
The uncertainties in our measured results are difficult to assess. The C iv data should be more reliable than Si iv because the spectra at the C iv wavelengths are less noisy and there is less blending with underlying BELs. There is no obvious explanation for the different FWHMs and velocity shifts reported for C iv and Si iv lines in Table 1 in terms of our fits to the lines or the pseudo-continuum. These differences might be real, or they might be indications of the true measurement uncertainties, mostly in the Si iv line.
4 Discussion
4.1 Covering Fractions and Optical Depths
If the outflow gas does not fully cover the background emission regions, then our line fits in §3 will underestimate the true optical depths and column densities. Partial covering appears to be common in BALs and it is well documented in many narrow-line outflow systems where resolved doublets provide direct measures of the covering fractions and true optical depths (Hamann et al., 1997; Hamann, 1998; Ganguly et al., 1999; Arav et al., 2001; Hamann & Sabra, 2004; Gabel et al., 2005). The net result can be shallow optically thick lines whose strengths and profiles are controlled by a velocity-dependent covering fraction.
In the J105400.40+034801.2 outflow, we cannot constrain the true optical depths based on resolved doublet ratios. However, standard photoionization models applied to quasar outflows predict that the optical depth in C iv should be at least 5 times larger than Si iv if the Si/C abundance is roughly solar and the degree of ionization favors Si+3 and C+3 over other ions (Hamann, 1997; Hamann & Ferland, 1999). The observed Si iv/C iv absorption ratio near unity in weak lines strongly suggests that both features are saturated. Their measured line depths then imply that the covering fraction was 20% (at line center) in 2006.96. In addition, the velocity shift of the outflow lines leads to little or no absorption at the BEL wavelengths (Figure 1). Therefore, the 20% covering fraction applies to the background continuum source.
4.2 Physical Properties and Time Scales
We can place some interesting constraints on the outflow physical properties by making a few reasonable assumptions. For example, in the photoionization calculations just mentioned, our lower limit on the Si+3 column density in 2006.96 (Table 1) corresponds to a total hydrogen column of if the Si/H abundance is roughly solar. In the more likely event that the Si iv line is saturated with line-center optical depth (§4.1), the total column density in the absorber would be .
Partial covering of the quasar continuum source (§4.1) implies that the absorbing region is small. The radius of the accretion disk continuum source at 1550 Å is expected to be roughly cm in luminous quasars like J105400.40+034801.222 2 We estimate the bolometric luminosity of J105400.40+034801.2 to be ergs s-1 based on the observed SDSS flux at 1450 Å (rest), a cosmology with km s-1 Mpc, , and a standard bolometric correction factor . This implies characteristic radii for the continuum source at 1550 Å of cm and for the C iv BEL region of cm (Peterson et al., 2004; Bentz et al., 2007; Gaskell, 2008; Hamann & Simon, 2008).. In simple geometries, the 20% covering fraction indicates a characteristic absorber radius of cm. (We do not consider the possibility of continuum flux scattered from some larger region because the 20% covering fraction would require that 80% of the observed continuum is scattered light.) Comparing this size to the minimum column density above indicates further that the average volume density is cm-3.
The outflow dynamical times are interesting for comparison to the observed variabilities. BAL-like outflows are believed to be launched from a rotating accretion disk, and the C iv absorption lines might form at radii just beyond the C iv BEL region (Murray & Chiang, 1997; Proga, Stone, & Kallman, 2000; Everett, 2005). A characteristic flow time in this situation would be yr, where km s-1 is the flow speed and is the CIV BEL region radius2. The transit time for absorbing clouds crossing the 1550 Å continuum source depends on the transverse velocities in the flow (i.e., perpendicular to our lines of sight). If the transverse velocities in the Si iv and C iv absorbing gas are similar to the disk rotation speed just beyond , roughly km s-1, then the transit time would be yr. Thus it appears that the transit time is more compatible with the observations than the overall flow time.
4.3 What Caused the Outflow Line Variations?
Did a new BAL-like outflow emerge from a situation where there was previously no outflow at all? We cannot answer that question except to note that there were no indications of structural changes in the accretion disk that might signal the onset of an outflow. In particular, the BELs and near-UV spectral slope did not change significantly during the absorption line variability period, and we can rule out large (factor of 2) changes in the near-UV flux. There are also no clear signs of acceleration. If a new outflow did emerge in J105400.40+034801.2, it probably appeared in our line of sight as Si+3 and C+3 after the acceleration to km s-1 had already occurred.
The emergence of outflow lines might have been caused by changes in the ionization or by the movement of gas across our lines of sight. Changes in the ionization are an unlikely explanation for several reasons. First, the C iv and Si iv BELs did not vary. Their ionization is controlled by the same far-UV flux that controls the C iv and Si iv absorption lines. Changes in quasar continuum fluxes are known to cause changes in the BELs after a time lag related to the light travel time between the continuum source and the BEL region. The lag time for the C iv BEL in J105400.40+034801.2 should be about half a year in the rest frame2. Therefore, substantial changes in the far-UV flux should have been evident in the CIV BEL. Second, weak Si iv and C iv absorption lines affected by changes in the ionization should exhibit measurable changes in the Si iv/C iv line ratio (see the photoionization calculations mentioned in §4.1). This did not occur in J105400.40+034801.2 because the lines are optically thick. Their strengths depend on the covering fraction much more than the degree of ionization.
We conclude that the outflow line variations were caused by changes in the covering fraction related to the movement of gas across our line of sight (see also Gibson et al. 2008). Our crude estimate of the crossing time, 1 yr (§4.2), is broadly consistent with this conclusion. Instabilities might also play a role by producing transient flow structures capable of C iv and Si iv absorption. However, instabilities might be expected evolve on roughly a flow time, 7 yr (§4.2), which is perhaps too slow to explain the observations. Better assessments of the origins of the variability will require detailed hydrodynamic simulations.
5 Summary and Conclusions
We have described the first known case of an emerging broad-line outflow in a luminous high-redshift quasar, J105400.40+034801.2. The outflow is evident in Si iv and C iv absorption lines having FWHM km s-1 and velocity shifts km s-1. These features are not technically BALs because their large velocity shifts lead to a balnicity index of zero. Nonetheless, they represent a powerful outflow with and cm-3. The outflow lines appeared between two observations 1.54 yr apart in the quasar rest frame. A third observation 0.47 yr later shows the lines becoming weaker again by 40%. We attribute this behavior to a substantial flow structure crossing our line of sight to the continuum source.
Overall, the outflow lines discussed here are similar to high-velocity mini-BALs observed in other quasars (Rodríguez Hidalgo et al., 2008). These features are characteristically narrower, weaker and more variable than the classic strong BALs. One possible explanation for these outflow lines is that they form along the ragged edge of the main BAL outflow, where the flow structures could be naturally smaller and more volatile. If BAL outflows are typically clumpy or filamentary (Hall et al., 2007), then perhaps the mini-BALs represent individual clumps or filaments along the edges of these flows. Another possibility is that mini-BALs and other similar outflow lines represent the sputtering beginning or end stages of a BAL evolutionary phase. Continued monitoring of quasars like J105400.40+034801.2, e.g., with multi-wavelength measurements to get better constraints on the ionization and column densities, will help to test these theoretical ideas.
Acknowledgments
We are grateful to Karen Leighly, Daniel Capellupo, Doron Chelouche, Daniel Proga and an anonymous referee for helpful comments.
References
- Adelman-McCarthy et al. (2008) Adelman-McCarthy J. K., et al., 2008, ApJS, 175, 297
- Arav et al. (2001) Arav N., et al., 2001, ApJ, 561, 118
- Becker, White, & Helfand (1995) Becker R. H., White R. L., Helfand D. J., 1995, ApJ, 450, 559
- Bentz et al. (2007) Bentz M. C., Denney K. D., Peterson B. M., Pogge R. W., 2007, ASPC, 373, 380
- Capellupo et al. (2008) Capellupo D., Hamann F., Rodríguez Hidalgo P., Shields J., 2008, in prep.
- Clowes & Campusano (1994) Clowes R. G., Campusano L. E., 1994, MNRAS, 266, 317
- Di Matteo et al. (2005) Di Matteo T., Springel V., Hernquist L., 2005, Nat, 433, 604
- Elvis (2000) Elvis M., 2000, ApJ, 545, 63
- Everett (2005) Everett J. E., 2005, ApJ, 631, 689
- Gabel et al. (2005) Gabel J. R., et al., 2005, ApJ, 623, 85
- Ganguly et al. (1999) Ganguly R., Eracleous M., Charlton J. C., Churchill C. W., 1999, AJ, 117, 2594
- Ganguly et al. (2001) Ganguly R., Bond N. A., Charlton J. C., Eracleous M., Brandt W. N., Churchill C. W., 2001, ApJ, 549, 133
- Ganguly & Brotherton (2008) Ganguly R., Brotherton M. S., 2008, ApJ, 672, 102
- Gaskell (2008) Gaskell C. M., 2008, RMxAC, 32, 1
- Gibson et al. (2008) Gibson R. R., Brandt W. N., Schneider D. P., Gallagher S. C., 2008, ApJ, 675, 985
- Hall et al. (2007) Hall P. B., Sadavoy S. I., Hutsemekers D., Everett J. E., Rafiee A., 2007, ApJ, 665, 174
- Hamann (1997) Hamann F., 1997, ApJS, 109, 279
- Hamann (1998) Hamann F., 1998, ApJ, 500, 798
- Hamann & Simon (2008) Hamann F., Simon L. E., 2008, in prep.
- Hamann et al. (1997) Hamann F., Barlow T. A., Junkkarinen V., Burbidge E. M., 1997, ApJ, 478, 80
- Hamann & Ferland (1999) Hamann F., Ferland G., 1999, ARA&A, 37, 487
- Hamann & Sabra (2004) Hamann F., Sabra B., 2004, ASPC, 311, 203
- Herbert-Fort et al. (2006) Herbert-Fort S., Prochaska J. X., Dessauges-Zavadsky M., Ellison S. L., Howk J. C., Wolfe A. M., Prochter G. E., 2006, PASP, 118, 1077
- Kaplan & et al. (2008) Kaplan K. F., et al. 2008, in prep.
- Kauffmann & Haehnelt (2000) Kauffmann G., Haehnelt M., 2000, MNRAS, 311, 576
- Leighly (2008) Leighly K., 2008, ApJ, (submitted)
- Leighly et al. (2005) Leighly, K. M., Casebeer, D. A., Hamann, F., & Grupe, D. 2005, Bulletin of the American Astronomical Society, 37, 1184
- Murray & Chiang (1997) Murray N., Chiang J., 1997, ApJ, 474, 91
- Nestor et al. (2008) Nestor D., Hamann F., Rodriguez Hidalgo P., 2008, MNRAS, 386, 2055
- Peterson et al. (2004) Peterson B. M., et al., 2004, ApJ, 613, 682
- Proga, Stone, & Kallman (2000) Proga D., Stone J. M., Kallman T. R., 2000, ApJ, 543, 686
- Proga (2005) Proga D., 2005, ApJ, 630, L9
- Richards et al. (2002) Richards G. T., Vanden Berk D. E., Reichard T. A., Hall P. B., Schneider D. P., SubbaRao M., Thakar A. R., York D. G., 2002, AJ, 124, 1
- Rodríguez Hidalgo et al. (2008) Rodríguez Hidalgo P., Hamann F., Nestor D. B., Shields J., 2008, in prep.
- Weymann et al. (1991) Weymann R. J., Morris S. L., Foltz C. B., Hewett P. C., 1991, ApJ, 373, 23