Stark deceleration of OH radicals
in low-field-seeking and high-field-seeking quantum states
Abstract
The Stark deceleration of OH radicals in both low-field-seeking and high-field-seeking levels of the rovibronic ground state is demonstrated using a single experimental setup. Applying alternating-gradient focusing, OH radicals in their low-field-seeking state have been decelerated from 345 m/s to 239 m/s, removing 50 % of the kinetic energy using only 27 deceleration stages. The alternating-gradient decelerator allows to independently control longitudinal and transverse manipulation of the molecules. Optimized high-voltage switching sequences for the alternating-gradient deceleration are applied, in order to adjust the dynamic focusing strength in every deceleration stage to the changing velocity over the deceleration process. In addition we have also decelerated OH radicals in their high-field-seeking state from 355 m/s to 316 m/s. For the states involved, a real crossing of hyperfine levels occurs at 640 V/cm, which is examined by varying a bias voltage applied to the electrodes.
Keywords:
alternating-gradient focusing; deceleration; cold molecule; polar molecule; OH radical; Stark effect; low-field-seeking state; high-field-seeking statepacs
37.10.Mn, 37.20.+j, 33.15.-eI Introduction
Since the first demonstration of Stark deceleration [1] tremendous advances have been made in the deceleration and trapping of molecules in low-field-seeking (lfs) states [2, 3]. Meanwhile, several groups have successfully implemented Stark decelerators and applied them for the deceleration of different molecules, namely metastable CO [1], different isotopologues of NH3 [2, 4] and OH [3, 5], NH [6], SO2 [7], and H2CO [8]. In several other laboratories Stark decelerators are planned or currently under construction. These studies are limited to molecules in low-field-seeking (lfs) states. However, large molecules exhibit practically only high-field-seeking states, and the absolute ground state of any molecule is high-field seeking (hfs). Therefore, it is desirable to extend Stark deceleration to hfs states. This can be achieved by using dynamic, alternating-gradient (AG) focusing schemes in the deceleration process [9, 10, 11]. AG deceleration has successfully been applied in the deceleration of metastable CO [10, 11], the heavy diatomic molecule YbF [12], and different rotational states of the large polyatomic molecule benzonitrile [13].
Using AG focusing the whole deceleration process is analogous to the operation of a LINAC [14]. Although the forces on the neutral molecules are typically eight orders of magnitude weaker than those applied in charged particle accelerators, the Stark deceleration process can be used to slow neutral molecules in practice (vide supra). In contrast to the LINAC, the focusing process for neutral molecules is quantum-state specific. This has been exploited, for example, for the separation of individual conformers of large molecules [15]. Analogous to the LINAC, the phase stability of the Stark deceleration process [16, 4] ensures that the velocity of a selected part of the beam can be varied without loss, i. e., molecules within a certain initial volume in phase space are kept together throughout the deceleration process, independent of the length of the decelerator. The concept of phase stability also applies to optical analogs of the Stark decelerator [17, 18, 19]. For the electric field deceleration of atoms and molecules in Rydberg states [20], schemes that employ phase stability have also been brought forward [21], and decelerated Rydberg hydrogen atoms have been trapped using electrostatic fields [22]. Furthermore, the magnetic analog of the Stark decelerator, the multistage Zeeman decelerator [23], has been used to decelerate oxygen molecules [24].
The first description and experimental demonstration of phase stability in a Stark decelerator was given by Bethlem et al. using a beam of metastable CO molecules [16]. This initial model for phase stability describes the longitudinal motion of molecules in a Stark decelerator and predicts its longitudinal acceptance. Recently, an extended model for longitudinal phase stability, including higher-order terms in the analysis, was presented [25]. This model predicts a variety of additional phase-stable regions, referred to as resonances, whose existence have been experimentally verified [25]. The longitudinal motion has also been accurately described by an analytical wave model [26]. In these models for longitudinal phase stability, the motion of molecules through a Stark decelerator is treated one-dimensionally, i. e., the trajectories of the molecules are assumed to be exactly along the molecular beam axis. In a practical Stark decelerator, however, the molecules in the beam also have velocity components perpendicular to the molecular beam axis. The electric fields applied in the decelerator have to drive the selected molecules back towards the molecular beam axis, resulting in a transverse oscillatory motion. The influence of the coupling of longitudinal and transverse motion and its influence on the phase stability have been studied and resonances similar to the parametric oscillations in AC ion traps [27] and AC traps for neutral molecules [28, 29, 30, 31] have been observed [32]. Using overtones in the Stark decelerator, the coupling can be changed and improved transmission has been obtained [25, 32]. In these experiments, only a fraction of the electric field stages is used for the deceleration and remaining ones can be used for optimized transverse focusing.
Recently, advanced, more complicated electrode geometries using normal deceleration stages and quadrupole focusing stages have been proposed in order to allow for the decoupling of transverse focusing and longitudinal manipulation of the molecular packet [33], but no experimental evidence for the improvement due to such electrode geometries has been given yet. However, the independent manipulation of longitudinal and transverse motion has already been shown for the deceleration of molecules in high-field-seeking states using the alternating-gradient decelerator [10, 12, 11, 13]. The transverse distribution of molecules exiting the decelerator has been experimentally observed using an imaging system [11]. Here we demonstrate that an array of electrodes in alternating-gradient geometry can also be used for the focusing and deceleration of molecules in lfs states.
We have set up an alternating-gradient Stark decelerator in which the electrodes creating the electric fields are oriented along the molecular beam axis, with pairs of two parallel electrodes per stage, as shown in figure 1 a.

The decelerator consists of successive pairs of electrodes which are rotated by 90∘ around the molecular beam axis. In this electrode arrangement the molecules are decelerated in the space between two successive electrode pairs, very similar to the normal Stark decelerator. In addition, however, this geometry allows to independently provide transverse focusing when the molecular packet is inside the electrode pair, where the electric field gradient in longitudinal direction vanishes. One has to take into account that for an individual stage the force is focusing in one transverse direction but defocusing in the other, as shown by the electric field norm and focusing force given in figure 1 b and c: Molecules in lfs states are focused in the plane of the electrodes and are defocused in the plane perpendicular to the electrodes. Therefore, electrode pairs are arranged in perpendicular transverse planes and AG focusing is used to transport molecules through the beamline, similar to dynamic focusing in charged particle accelerators.
Here, we apply AG deceleration for the deceleration of OH in its lfs state. Using a prototype setup, consisting of only 27 stages, we could remove 50 % of the kinetic energy from the molecular packets in a supersonic jet. The independent control over the transverse focusing allows to adopt the focusing strength of the electric field stages to the velocity of the molecular packet and, therefore, to keep the transverse focusing and the transverse acceptance constant over the whole deceleration process. In addition, using exactly the same experimental setup, we have also decelerated OH radicals in their hfs state. This lower -doubling component of the rotational ground state is the absolute ground state of OH. These experiments demonstrate the versatility of the AG decelerator, which can be used for the deceleration of molecules in any polar quantum state.
By applying different bias voltages to the decelerator electrodes, which provide a minimum electric field strength to the molecules throughout the whole deceleration process, we could observe the level crossing of two hyperfine states of OH in its hfs state. This level crossing manifests itself in a loss channel for the decelerated packet, which can be suppressed by applying bias voltages large enough to always stay above the field strength of the crossing.
II Experimental details
The experiments described here are performed in the same molecular-beam machine that was previously used for the deceleration of benzonitrile (C7H5N) [13]. This setup is schematically shown in figure 2.
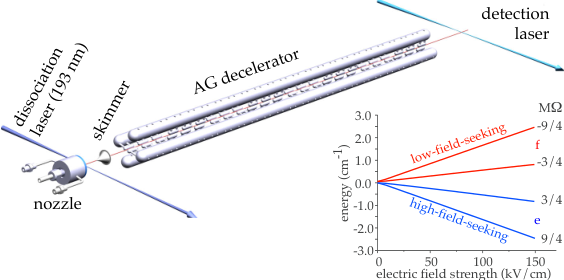
A pulsed beam of OH radicals is produced by photodissociation (193 nm) of molecules that are co-expanded with xenon. 20 mm downstream the radicals pass a 1.5 mm diameter skimmer, which is mounted directly on a gate valve [34] to allow for a short nozzle-to-decelerator distance, and enter a second differentially pumped vacuum chamber. The first electrode pair of the decelerator starts 37 mm behind the tip of the skimmer. The decelerator consists of 27 electrode pairs arranged along the molecular beam axis. Each electrode has a length of 13 mm, a diameter of 6 mm, and the spherical end caps of the electrodes have a radius of 3 mm. The two electrodes of every stage have a distance of 2 mm, successive electrode pairs are placed at center-to-center distances of 20 mm along the molecular beam axis and successively rotated by 90∘ after every three electrode pairs. The total length of the decelerator is 533 mm. For the two opposing electrodes of every pair voltages are switched between kV, corresponding to a maximum electric field of 142.5 kV/cm on the molecular beam axis, and a bias voltage of typically kV. The exact field strength values are given in figure 1 b. OH radicals are detected 655 mm behind the laser production by laser-induced fluorescence (LIF) using time-resolved photon-counting. In the experiments presented here we use a frequency-stabilized continuous-wave ring-dye laser for the electronic excitation () of the molecules. Its narrow linewidth (1 MHz) allows to specifically detect molecules in a given hyperfine state. At the same time, we can record the complete arrival time distribution of each molecular packet, as the laser excitation and the photon detection are continuous. In that way complete time-of-flight (TOF) profiles of the molecular packets from the nozzle to the detector can be recorded in a single shot experiment. For the experimental TOF profiles shown in this paper the data from 8000 experiments are averaged, corresponding to a measuring time of approximately 7 min at 20 Hz.
III Switching schemes
The alternating-gradient decelerator allows to individually choose the transverse focusing and the deceleration strength, both for molecules in lfs and in hfs states [11]. To describe the sequence of times at which the high voltages are switched, we use the concept of a synchronous molecule, which is by definition always at the same position within an AG lens when the high voltages are switched. For the deceleration of molecules in lfs states, one must let the molecular packet fly from regions of low electric field into regions of high electric fields. In order to achieve phase stability the field must be switched off on the rising flank of the field, i. e., before the molecular packet enters the region of constant electric field along the molecular beam axis inside the pair of electrodes. That way, faster molecules are decelerated more and slower ones less than the synchronous molecule, resulting in an oscillation of the molecules in the packet around the synchronous molecule, and the packet is effectively kept together [4]. Here, we have applied a switching pattern based on the ones used in the normal Stark decelerator: when the synchronous molecule is 2 mm before the position of minimum electric field (the center between two successive electrode pairs), the fields on both pairs of electrodes are switched on. When the field is again switched off 2 mm behind the center position, the molecular packet is bunched longitudinally [35]. If the field is kept on longer, however, it is decelerated, as the packet now has to climb more of the potential hill into the electrode pair. To achieve transverse focusing the fields are then switched on and off once more for every stage when the molecules are inside the electrode pair.
For the first high-voltage pulse in every stage, the position along the molecular beam axis where we switch off the electric field for the synchronous molecule is called ; this position is specified relative to the minimum of the electric field in between two neighboring electrode pairs. The length over which the field is applied is . These values and determine the amount of deceleration and longitudinal focusing (bunching), respectively. In principle, determines also the length of the molecular packet that is bunched, but this effect is negligible here due to the small length of the initial packet. The second high-voltage pulse is applied symmetrically around the center of the electrode pair and the fields are switched on over a distance for the synchronous molecule. The length of this pulse determines the amount of transverse focusing. These parameters are graphically depicted next to the experimental results given in section V.
For maximum longitudinal acceptance the amount of energy removed from the synchronous molecule per stage should be constant and, therefore, should be constant over the whole decelerator. Accordingly, the transverse focusing should also be constant over the decelerator and, therefore, the molecules should spend the same time in the focusing field for every stage. In previous AG deceleration experiments [10, 12, 11, 13] the velocity change was small and a constant focusing length could be used. Since we achieve a larger velocity change in the experiments presented here, the focusing parameter has to be lowered over the course of the deceleration to compensate for the velocity changes. Generally, a constant amount of energy is removed from the molecular packet per deceleration stage, resulting in a quadratic reduction of velocity during the deceleration process. In order to obtain constant transverse focusing, which provides the maximum transverse acceptance, should also be reduced quadratically during the deceleration process. As a first order approximation, we have experimentally optimized a linearly changing , resulting in an increase of the peak intensities of the decelerated molecular packets of up to 20 % relative to the intensities obtained using switching sequences with a constant . However, when the velocity changes during the deceleration process will be even larger than demonstrated here, quadratic changes of will become crucial. Additionally, it has to be taken into account that the deceleration pulse has also a transverse focusing effect. This effect is larger if we let the molecular packet fly further towards the electrodes, i. e., for stronger deceleration. Therefore, the amount of focusing has generally to be lowered for larger . The actual parameter values used in the experiments are depicted alongside the experimental data described in section V.
For the deceleration of packets of OH radicals in their hfs state, switching sequences as described before are used [13]. We characterize the switching sequences by a and parameter. For the synchronous molecule, is the position along the molecular beam axis where the electric field is switched off in every electric field lens, relative to the center of the electrode pairs, with positive values running towards the detector. is the length over which the electric field is switched on. It determines the amount of transverse focusing, where a larger value corresponds to stronger focusing, and the parameter describes amount of deceleration, with larger values corresponding to more deceleration.
IV Trajectory calculations
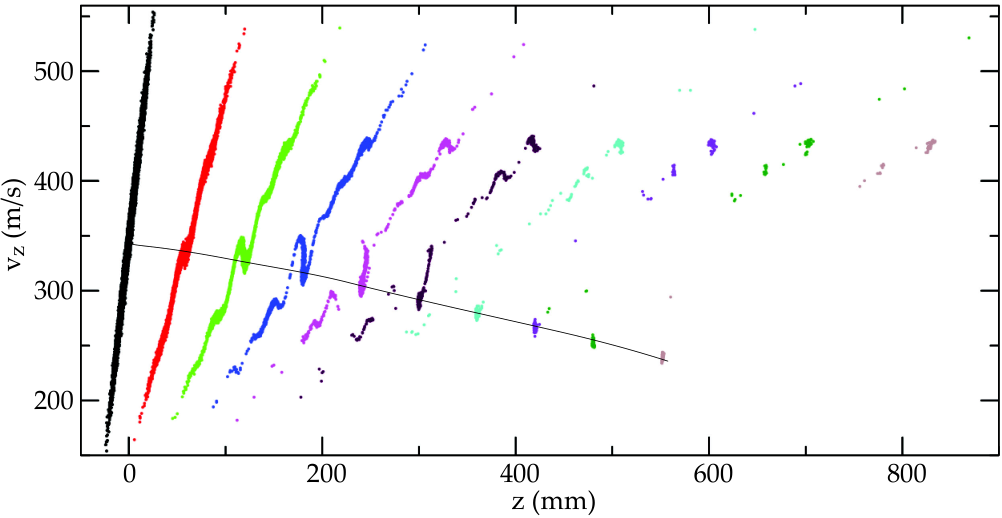
Corresponding trajectory calculations to simulate the TOF profiles are performed using the libcoldmol program package [36]. In the simulations, we have included all hyperfine levels of the respective -doubling component of OH, i. e., the and the less polar states (see figure 2), using the appropriate weighting due to the number of hyperfine states belonging to these two manifolds. These simulations also yield the phase-space distributions of the molecules at any time during the deceleration process. In figure 3 the phase-space distributions for the times when the synchronous molecule is at the center of every third electrode are plotted, starting 20 mm before the center of the first electrode. Transverse and longitudinal phase-space distributions of OH radicals in the lfs state and the hfs state at the detector are shown in figures 4 and 5, respectively. The distributions of molecules in the captured packets are shown in gray (red). Due to the finite length of the decelerator molecules can also reach the detector on metastable trajectories. For the transverse distributions these molecules are shown in black.


The phase-space acceptance of the decelerator for a given switching sequence can be derived from trajectory calculations.
In figure 6 the longitudinal phase-space acceptances of the AG decelerator for OH radicals in their low-field seeking state are shown for different high-voltage sequences applied. All phase-space acceptances are calculated by numerical trajectory calculations using the correct electric fields and field gradients obtained using finite element methods (Comsol Multiphysics). For each set of parameters trajectories from a uniform distribution of an initial six-dimensional phase-space area of (mmm/s)3 through a 2 m long decelerator are calculated. In all panels the acceptance along the molecular beam axis is plotted. The upper two images (a and b) show the phase-space acceptance obtained from calculations where all molecules are confined on the molecular beam axis. Generally, in such a calculation all molecules eventually reach the detector. In figure 6 a only the initial phase-space positions of molecules that reach the detector within the synchronous packet, the packet around the synchronous molecule, are plotted. In figure 6 b the initial phase-space positions of molecules that reach the detector within the synchronous packet and of molecules in the packets half an electrode pair ahead and behind are plotted (vide infra). In figure 6 c and d the corresponding densities of the projections onto the plane of initial phase-space positions of the molecules reaching the detector in full three-dimensional simulations are plotted.
When the AG decelerator would be used analogous to a normal Stark decelerator for the deceleration of OH in its lfs state, the high voltages are only switched on when the synchronous molecule is between successive electrode pairs. This results in the one- and three-dimensional phase-space acceptances shown in figure 6 a and c, respectively. In the three-dimensional calculation, only a small ring of accepted initial phase-space positions is observed. For most phase-space positions, i. e., the central part of the one-dimensional distribution, the process is not stable. The observed halo and the central region of instability have been described before for the normal Stark decelerator and the halo has been ascribed to instabilities due to the coupling of longitudinal and transverse motion [32]. In the normal Stark decelerator this problem can be mitigated by applying overtone switching frequencies.
However, the AG decelerator allows to independently control the deceleration and the transverse focusing strength, allowing to minimize losses due to such parametric amplification from the coupling of longitudinal and transverse motion. The result of applying an additional transverse focusing field around the center of the AG lenses is shown in figure 6 b and d: Here, the acceptance is calculated using the switching sequence applied in the experiments described below. In the one-dimensional calculation the packet is split up into two somewhat smaller packets due to the smaller lattice-cell lengths: The molecules feel the force of the electric fields every 10 mm instead of every 20 mm due to the doubled number of high-voltage pulses – half of them for longitudinal bunching, the other half for transverse focusing. Since “the molecules do not know this”, they might use the fields intended for bunching for focusing instead, and vice versa. For the three-dimensional calculation under these conditions the projection of the initial phase-space density onto the plane is highest around the synchronous molecule, allowing to efficiently couple a molecular beam, which typically has a Gaussian-like phase-space distribution, into the AG decelerator.
From these trajectory calculations the phase-space acceptance for guiding OH radicals in their lfs state at 345 m/s is determined to (mmm/s)3. This is one order of magnitude smaller than the corresponding phase-space acceptance of a normal Stark decelerator with similar dimensions, i. e., 2 mm electrode spacing and 5.5 mm lens-to-lens distance, and the same voltages applied.
V Experimental results
The experimental results for the deceleration of OH in its lfs state are shown in figure 7, together with their respective simulations.
Comparing the TOF distributions for free-flight and guiding measurements, shown in the lowest two traces of figure 7 b, the improved peak intensity of the focused packet relative to the unfocused packet is obvious. Moreover, due to the velocity selectivity of the focusing the velocity distribution of the accepted packet is considerably narrower, corresponding to a colder packet of molecules. This can also be seen in the phase-space distributions shown in figure 4. In all deceleration measurements we have applied a linear variation of over the decelerator, which resulted in a maximum improvement of 21 % compared to a constant for the strongest deceleration sequences. The variation of is depicted in figure 7 a by the shaded areas. For the strongest deceleration sequence we could decelerate OH from 345 m/s to 239 m/s, removing more than 50 % of the kinetic energy. In additional experiments (not shown) we have also decelerated packets of OH in its lfs state from 305 m/s to 199 m/s [37], the slowest velocity obtained for molecular packets from an AG decelerator so far.
The TOF profiles for the deceleration of OH in its hfs state are shown in figure 8.
When letting the molecular packet fly out of the electrode pair while the electrodes are powered, an overall reduction of the molecular velocity results in a delayed arrival at the detector. For increased , the final velocity is decreased further, down to a final velocity of 316 m/s for mm. For this strongest deceleration the kinetic energy of the molecules is reduced by approximately 21 %.
For all simulations, the intensity ratios of the measurements with an electric field applied match the experimental results rather well. They do, however, predict a considerably larger intensity of the focused beams compared to the free flight measurements than is observed experimentally. We ascribed this to mechanical misalignment of the high-voltage electrodes. When we assume the electrode pairs to be shifted in a random fashion in all three dimensions, using a Gaussian distribution with a standard deviation of m, a decrease of the simulated intensities is obtained that matches the experimental results.
In addition, molecules can be lost from the polar quantum states due to Majorana transitions or diabatic following of potential energy curves. These effects are minimized by applying V bias voltage to the electrodes instead of switching to ground, as described above and used in all experiments shown here. For the experiments on OH in its lfs states, a steady signal increase up to a factor of 3.5 can be observed when tuning the bias voltage from 0 V to V. We ascribe this to transverse focusing effects of the bias field. For the hfs states the integrated intensities of the synchronous packet is given as a function of the bias field strength in figure 9 a. For a threshold voltage of 67 V, which corresponds to an electric field strength at the center of the AG lenses of 640 V/cm, a sudden rise in signal intensity is observed.
At this field strength a real crossing between two hyperfine states occurs, which is marked by the arrow in figure 9 b. One of these levels belongs to the manifolds, whereas the other level belongs to the manifolds. Both hyperfine states have negative parity. The coupling of states with the same parity is dipole forbidden. In an electric field, however, hyperfine states of different parities mix. In figure 9 c, the squares of the mixing coefficients for both hyperfine levels of the crossing are shown. For positive parity, the mixing ratios at an electric field strength of 640 V/cm are 1 % and 4 % for the and state, respectively. This parity mixing for bias voltages below the threshold can be sufficient to allow transitions from the state to the state. In our experiment, only the state is detected, and, therefore, the detected intensity is reduced. However, it is obvious that the losses can be minimized by applying a bias voltage just above the field strength at which the crossing occurs.
VI Conclusions
The alternating-gradient focusing and deceleration of OH in both high-field-seeking and low-field-seeking states of its rovibronic ground state have been demonstrated using a single experimental setup. This work demonstrates the versatility of the AG decelerator, which can, in principle, be used for the deceleration of molecules in any polar quantum state.
For OH radicals in the lfs state more than 50 % of the kinetic energy has been removed in deceleration experiments using an AG decelerator with 27 stages. Moreover, it has been demonstrated that the AG decelerator allows to separately change the transverse and longitudinal focusing properties. The deceleration achieved in this work has to be compared to the deceleration of OH using a normal Stark decelerator, where OH in the lfs state has been decelerated to a standstill, using 108 deceleration stages, and finally trapped using an electrostatic trap [3]. Due to the small number of electrodes of the AG decelerator, deceleration to a standstill was not possible. Moreover, the phase-space acceptance of the AG decelerator is an order of magnitude smaller than for the normal Stark decelerator.
For the deceleration of the OH radicals in their hfs absolute ground state (), the same switching sequences as used in previous experiments have been applied [10, 12, 11, 13] and about 21 % of the molecules’ kinetic energy has been removed. In addition, the dependence of the transmission through the decelerator on an applied bias voltage has been studied, and for OH in its hfs state a threshold behavior has been found. This is attributed to a real crossing of hyperfine states at the corresponding electric field strength.
Acknowledgements.
We acknowledge helpful discussions with Sebastiaan Y. T. van de Meerakker and Hendrick L. Bethlem, as well as financial support from the Deutsche Forschungsgemeinschaft within the priority program 1116 “Interactions in ultracold gases”.References
- [1] H. L. Bethlem, G. Berden, and G. Meijer, Phys. Rev. Lett. 83, 1558 (1999).
- [2] H. L. Bethlem, G. Berden, F. M. H. Crompvoets, R. T. Jongma, A. J. A. van Roij, and G. Meijer, Nature 406, 491 (2000a).
- [3] S. Y. T. van de Meerakker, P. H. M. Smeets, N. Vanhaecke, R. T. Jongma, and G. Meijer, Phys. Rev. Lett. 94, 023004 (2005a).
- [4] H. L. Bethlem, F. M. H. Crompvoets, R. T. Jongma, S. Y. T. van de Meerakker, and G. Meijer, Phys. Rev. A 65, 053416 (2002a).
- [5] J. R. Bochinski, E. R. Hudson, H. J. Lewandowski, G. Meijer, and J. Ye, Phys. Rev. Lett. 91, 243001 (2003).
- [6] S. Y. van de Meerakker, I. Labazan, S. Hoekstra, J. Küpper, and G. Meijer, J. Phys. B 39, S1077 (2006a).
- [7] S. Jung, E. Tiemann, and C. Lisdat, Phys. Rev. A 74, 040701 (2006).
- [8] E. R. Hudson, C. Ticknor, B. C. Sawyer, C. A. Taatjes, H. J. Lewandowski, J. R. Bochinski, J. L. Bohn, and J. Ye, Phys. Rev. A 73, 063404 (2006).
- [9] D. Auerbach, E. E. A. Bromberg, and L. Wharton, J. Chem. Phys. 45, 2160 (1966).
- [10] H. L. Bethlem, A. J. A. van Roij, R. T. Jongma, and G. Meijer, Phys. Rev. Lett. 88, 133003 (2002b).
- [11] H. L. Bethlem, M. R. Tarbutt, J. Küpper, D. Carty, K. Wohlfart, E. A. Hinds, and G. Meijer, J. Phys. B 39, R263 (2006a).
- [12] M. R. Tarbutt, H. L. Bethlem, J. J. Hudson, V. L. Ryabov, V. A. Ryzhov, B. E. Sauer, G. Meijer, and E. A. Hinds, Phys. Rev. Lett. 92, 173002 (2004).
- [13] K. Wohlfart, F. Grätz, F. Filsinger, H. Haak, G. Meijer, and J. Küpper, Phys. Rev. A 77, 031404(R) (2008).
- [14] S. Y. Lee, Accelerator physics (World Scientific, Singapore, 2004), 2nd ed.
- [15] F. Filsinger, U. Erlekam, G. von Helden, J. Küpper, and G. Meijer, Phys. Rev. Lett. 100 (2008).
- [16] H. L. Bethlem, G. Berden, A. J. A. van Roij, F. M. H. Crompvoets, and G. Meijer, Phys. Rev. Lett. 84, 5744 (2000b).
- [17] G. J. Dong, W. P. Lu, and P. F. Barker, Phys. Rev. A 69, 013409 (2004).
- [18] R. Fulton, A. I. Bishop, M. N. Shneider, and P. F. Barker, Nature Phys. 2, 465 (2006a).
- [19] R. Fulton, A. I. Bishop, M. N. Shneider, and P. F. Barker, J. Phys. B 39, S1097 (2006b).
- [20] E. Vliegen and F. Merkt, J. Phys. B 38, 1623 (2005).
- [21] N. Vanhaecke, D. Comparat, and P. Pillet, J. Phys. B 38, S409 (2005).
- [22] S. Hogan and F. Merkt, Phys. Rev. Lett. 100, 043001 (2008).
- [23] N. Vanhaecke, U. Meier, M. Andrist, B. H. Meier, and F. Merkt, Phys. Rev. A 75, 031402(R) (2007).
- [24] E. Narevicius, A. Libson, C. G. Parthey, I. Chavez, J. Narevicius, U. Even, and M. G. Raizen, Phys. Rev. A 77, 051401 (2008).
- [25] S. Y. T. van de Meerakker, N. Vanhaecke, H. L. Bethlem, and G. Meijer, Phys. Rev. A 71, 053409 (2005b).
- [26] K. Gubbels, G. Meijer, and B. Friedrich, Phys. Rev. A 73, 063406 (2006).
- [27] R. Alheit, S. Kleineidam, F. Vedel, M. Vedel, and G. Werth, Int. J. Mass Spectrom. 154, 155 (1996).
- [28] J. van Veldhoven, H. L. Bethlem, and G. Meijer, Phys. Rev. Lett. 94, 083001 (2005).
- [29] H. L. Bethlem, J. van Veldhoven, M. Schnell, and G. Meijer, Phys. Rev. A 74, 063403 (2006b).
- [30] M. Schnell, P. Lützow, J. van Veldhoven, H. L. Bethlem, J. Küpper, B. Friedrich, M. Schleier-Smith, H. Haak, and G. Meijer, J. Phys. Chem. A 111, 7411 (2007).
- [31] P. Lützow, M. Schnell, and G. Meijer, Phys. Rev. A 77, 063402 (2008).
- [32] S. Y. T. van de Meerakker, N. Vanhaecke, H. L. Bethlem, and G. Meijer, Phys. Rev. A 73, 023401 (2006b).
- [33] B. C. Sawyer, B. K. Stuhl, B. L. Lev, J. Ye, and E. R. Hudson, Eur. Phys. J. D 48, 197 (2008).
- [34] J. Küpper, H. Haak, K. Wohlfart, and G. Meijer, Rev. Sci. Instrum. 77, 016106 (2006).
- [35] F. M. H. Crompvoets, R. T. Jongma, H. L. Bethlem, A. J. A. van Roij, and G. Meijer, Phys. Rev. Lett. 89, 093004 (2002).
- [36] J. Küpper and F. Filsinger, libcoldmol: A particle trajectory calculation framework (2003–2008), URL: http://libcoldmol.cold-molecules.info.
- [37] K. Wohlfart, Dissertation, Free University, Berlin, Germany (2008).