Helioseismic analysis of the solar flare-induced sunquake of 2005 January 15. II: A magneto-seismic study
Abstract
On 2005 January 15, the active region AR10720 produced an X1.2 solar flare that induced high levels of seismicity into the photospheric layers. The seismic source was detected using helioseismic holography and analysed in detail in Paper I. Egression power maps at 6 mHz with a 2 mHz bandwidth revealed a compact acoustic source strongly correlated with the footpoints of the coronal loop that hosted the flare. We present a magneto-siesmic study of this active region in order to understand, for the first time, the magnetic topological structure of a coronal field that hosts an acoustically active solar flare. The accompanying analysis attempts to answer questions such as: Can the magnetic field act as a barrier and prevent seismic waves from spreading away from the focus of the sunquake? And, what is the most efficient magnetic structure that would facilitate the development of a strong seismic source in the photosphere?
Keywords:
Sun: flares — Sun: helioseismology — Sun: oscillations1 Introduction
Our understanding of the acoustics of solar flares has been greatly improved in recent years through a combination of observational and computational techniques. It was Wolff (1972) who first suggested that solar flares could release acoustic noise into the solar interior. Kosovichev & Zharkova (1995) simulated this phenomenon for the first time, and soon after, Kosovichev & Zharkova (1998) discovered the first seismic event, in the form of ripples, propagating away from the flare of 1996 July 9. With the advancement of local helioseismic techniques such as helioseismic holography (Lindsey & Braun, 2000), we have now detected numerous seismic sources of varying size and intensity produced by M- and X-class flares (Donea, Braun, & Lindsey, 1999; Donea & Lindsey, 2005; Donea et al., 2006; Moradi et al., 2007; Besliu-Ionescu et al., 2007; Martínez-Oliveros et al., 2007). Extended work on this field has also been continued by Kosovichev (2006); Zharkova & Zharkov (2007); Martínez-Oliveros, Moradi & Donea (2008).
During the impulsive phase of a flare, the coronal magnetic energy is transferred down into the photosphere and further into the solar interior. This energy is then refracted back to the solar surface within approximately 50 Mm of the source and within an hour of the beginning of the flare. The surface manifestation of this phenomenon is the appearance of “ripples” on the solar surface, which we identify as sunquakes. It is interesting to note that the majority of flares do not generate sunquakes. Most large flares are seismically inactive, which suggests that the strong magnetic fields of the hosting active regions may substantially alter the behaviour of helioseismic signals emerging from below. To date, the magnetism of solar seismic regions has not been studied in depth. Braun, Duvall & Labonte (1987) and Braun (1995) observed that sunspots partially absorb wave energy and shift the phase of the oscillations. A long line of theoretical developments then followed (Cally & Bogdan, 1993; Cally, Bogdan & Zweibel, 1994; Bogdan & Cally, 1997; Crouch & Cally, 2003; Crouch & Cally, 2005) which has shown that near-surface conversion to slow magnetoacoustic waves is predominantly responsible for the absorption.
Furthermore, Schunker et al. (2005) confirmed through observations that magnetic forces should be of particular significance for acoustic signatures in penumbral regions, where the magnetic field is significantly inclined from vertical. Sudol & Harvey (2005) also found that a sizable proportion of magnetic field variations occur in the penumbral regions of flaring sunspots. Remarkably, the majority of seismic sources induced by flares are also located either inside, or within close proximity to the penumbra. These observations possibly suggest a new mechanism which may be driving seismic waves at the photospheric level. Indeed, Hudson, Fisher & Welsch (2007) have recently introduced the idea of the coupling of flare energy into a seismic wave, namely the “McClymont magnetic jerk”, produced during the impulsive phase of acoustically active flares. They estimated the mechanical work that would be done on the photosphere by a sudden coronal restructuring. Their energy estimates are similar to those based on our helioseismic observations.
During January 11 – 20 2005, AR10720 produced 5 X-class solar flares, including an X7.1 on January 20 which produced an intense solar proton storm. However, the Michelson Doppler Imager (MDI) onboard the Solar and Heliospheric Observatory (SOHO) instrument provided helioseismic observations only for the X1.2 flare of January 15. This flare was situated at N14E08 on the solar surface. The detection of the powerful seismic transient of 2005 January 15 was initially reported by Besliu-Ionescu et al. (2006) and Moradi et al. (2006a); Moradi et al. (2006b). The properties of the seismic waves generated by the event were later analysed by Kosovichev (2006). Moradi et al. (2007) (Paper I) extensively analysed the sunquake of 2005 January 15 and compared the acoustic signatures with other supporting observations. They also compared certain qualities exhibited by the flare with all other known acoustically active flares. The coincidence between strong compact acoustic source and nearby signatures of hard X-ray emission is remarkable. This and the spatial coincidence of the acoustic emission with the sudden white-light signature, suggests that the sudden heating of the low photosphere results in seismic waves at the solar surface. Moradi et al. (2007) further suggested that a detailed examination of the heated magnetic photosphere is needed to complete our studies.
In this paper we will analyse the magneto-seismic activity of AR10720. Specifically, we shall investigate the role of the photospheric and coronal magnetic fields in generating the seismic waves based on the results of Hudson, Fisher & Welsch (2007). We will also use vector magnetograms of AR10720 to analyse the evolution and dynamics of the photospheric magnetic field.
The structure of this paper is as follows. Section 2 outlines the observational data used for our analyses. Section 3 presents the location of the seismic source in AR10720 with references to Moradi et al. (2007) for details. Section 4 outlines the line-of-sight magnetic transients in AR10720 associated with the X1.2 solar flare. Section 5 shows the coronal magnetic field reconstruction models of AR10720. In the final section, we conclude with a discussion of the magnetism of the seismic region based on what we have learnt from our analyses.
2 Data
The SOHO-MDI data consists of full-disk magnetograms obtained at a cadence of 1 minute. The MDI data sets are described in more detail by Scherrer et al. (1995). We analysed a dataset with a period of 2 hours encompassing the flare. We remapped the MDI images onto a perspective that tracks solar rotation, with the region of interest fixed at the centre of the frame. The MDI images were then Postel-projected onto the frame with a nominal separation of 0.002 solar radii (1.4 Mm). The field of view in the MDI images analysed was pixels, thus incorporating a region of Mm on the solar surface.
MDI-magnetogram data provides a study of the structure and variations of l-o-s (line of sight) magnetic fields in active regions. Additionally, we have utilised photospheric vector magnetograms taken by the Imaging Vector Magnetograph (IVM) instrument at Mees Solar Observatory, Hawaii (Mickey, et al., 1996). These magnetograms provide the orientation and strength of the surface magnetic field in AR10720. The three magnetic components are: the line-of-sight magnetic field component, and the two transverse components in the plane perpendicular to the line-of-sight. The equations allowing the inversion of Stokes parameters introduce a 180o ambiguity on the azimuthal component which can be resolved using the method described in Canfield et al. (1993).
The Imaging Vector Magnetograph (IVM) provides the vector magnetic field of AR10720 on January 14, 2005 at 18:08:12 UT, six hours before the occurrence of the X1.2 flare. Rotation and scaling were applied to align the IVM data to the line-of-sight MDI magnetogram when identifying the location of the seismic source on the IVM maps.
3 Location of the seismic source
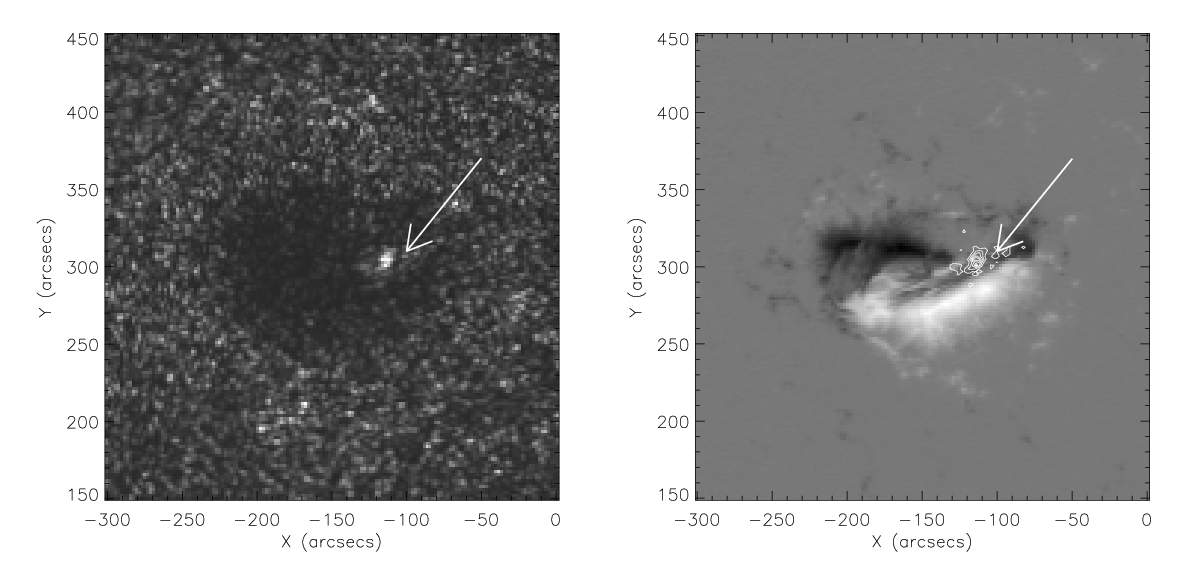
In this section we briefly describe the main characteristics of the seismic event generated by the flare of January 15, 2005. Paper I analysed the general properties of the seismic source and identified some of the (possible) triggering mechanisms of this sunquake.
In Paper I, computational seismic holography was applied to MDI dopplergram observations to image the seismic source of the flare. The resulting “egression power maps” (Figure 1, left frame) showed a relatively compact seismic source surrounded by some diffuse emission. The source was clearly visible in 2.5 – 4.5 mHz holographic images and even more pronounced in 5 – 7 mHz images. The conspicuous 6 mHz seismic source, indicated by the arrows in Figure 1, becomes apparent near the western end of the active region at 00:33 UT, reaching a maximum at 00:41 UT and disappearing at 00:47 UT. The source reveals two components: a compact kernel 10 Mm in diameter on the magnetic neutral line and a diffuse spread, parallel to the neutral line lenticular component, 45 Mm long (Paper I). These signatures correspond closely with other compact manifestations of the flare (white light emission and magnetic kernels, see next section). The suppression of ambient acoustic emission from the magnetic region considerably enhances the significance of the acoustic emission from the flare.
The powerful seismic waves produced by the sunquake had amplitudes exceeding 100 m/s, propagating with an elliptical shape with a major axis SE – NW (Kosovichev, 2006). The total energy emitted by the 5 – 7 mHz seismic source was estimated at ergs. This is about the same as the seismic energy produced by the October 28 (X17.2) flare and 200% greater than the October 29 (X10) flares (Donea & Lindsey, 2005). Indeed, the 2005 January 15 flare contributes to recent findings that relatively small flares can emit disproportionate amounts of acoustic energy (Donea & Lindsey, 2005; Moradi et al., 2007).

In Figure 2 we show that the intensity continuum and magnetic signatures of this flare spatially coincide. The upper panels show a GONG+ continuum image and a MDI line-of-sight magnetogram of AR10720 on January 15 at 00:39 UT. Panels c, d and e show differences between consecutive GONG+ intensity continuum images. For example, panel c shows the differences of GONG+ images taken at 00:38 and 00:39 UT. The subsequent two frames show consecutive differences 1 and 2 minutes later. The right column (panels f, g and h) show also differences between consecutive MDI magnetograms. The visible continuum emission is elongated along the magnetic neutral line, corresponding closely with the lenticular component of seismic emission seen at 00:42 UT in Figure 1 (left frame). The magnetic kernels coincides with both the seismic compact source, and the lenticular component. Moradi et al. (2007) also reported that the continuum radiation into the seismic area was ergs, which is times the total seismic energy we estimate the flare to have emitted into the photosphere.
4 Local Magnetic Fields in the Seismic Region


Once the position of the seismic sources are found, we study the structure and variation of the magnetic field at these locations. This work may provide important information regarding the photospheric effects from solar flares. First, we analysed l-o-s MDI magnetogram images taken during the seismic event. The seismic source is identified in the vicinity of neutral lines separating regions with opposite polarities of l-o-s magnetic component (box in Figure 3). Then, we extrapolated the magnetic field lines based on the photospheric magnetograms.
Figure 4 shows the variation of the photospheric magnetic field flux in the region of the seismic source (main kernel). A sharp decrease of the magnetic flux is observed during the impulsive phase of the flare at 00:39 UT, followed by a gradual increase for about 10 minutes, before returning to the pre-flare magnetic flux levels. For the seismic region, when averaging , we used a rectangular area of Mm2. These are reversible magnetic changes, similar to the ones discussed by Kosovichev & Zharkova (2001).
The magnetic transients visualised in Figure 2 (right column) are produced by precipitation of high energy particle beams that induce their own magnetic field and also change the thermal structure of the photosphere, an effect that has an impact on the formation of the NiI 6768 Å line (from which the is measured).
For the seismically active area of AR10720 we have detected a number of Mm seismic areas with abrupt and permanent changes in the magnetic field region as reported by the statistics of Sudol & Harvey (2005) who proposed that these were the result of significant changes in the longitudinal component of the magnetic field. We have also measured transient magnetic shifts as seen in Figure 2. These have also been detected in a number of flares, some of which were acoustically active (Kosovichev & Zharkova, 2001). The magnetic signatures are spatially and temporally consistent with the acoustic signature.
The seismic emission occurred in a region where the magnetic field is quite strong (field strengths in the range 400 – 1200 G) and where the field lines are highly inclined (a range of 60-80 degrees) to the vertical. For helioseismic purposes a strong magnetic field is certain to be important throughout the photosphere and chromosphere, particularly in penumbral regions, where the field is significantly inclined from vertical (Schunker et al., 2005). Recent theoretical and computational modelling of magnetised subphotospheres (Cally, 2006) and atmospheres (Bogdan et al., 2002) has revealed that fast-to-slow (or vice versa) magnetoacoustic wave conversion occurs strongly near surfaces where the sound and Alfvén speeds coincide, provided the local ‘attack angle’ of the wave vector to the magnetic field lines is fine. Cally & Goosens (2007) have also found significant conversion to the Alfvén wave. We will see in the next section that indeed, the low-lying loops are not only highly inclined but strongly twisted to facilitate the accumulation of the energy needed to trigger the flare.
5 Reconstruction of the 3-D magnetic field
The acoustic activity of an active region is clearly related to the structure of the coronal magnetic field, which facilitates the precipitation of beams of non-thermal particles towards the chromosphere. Martínez-Oliveros et al. (2007) suggested that the coronal magnetic field configuration (height and symmetry of loops) can be a relevant factor in the generation of photospheric seismic waves. They studied the seismicity of the August 14, 2004 M7.4 solar flare, and found that the seismic source was located just beneath low-lying, highly-sheared magnetic field lines. This type of configuration seems to facilitate the transport of flare energy into the photosphere.
In this work we have imaged the coronal magnetic field using potential (Sakurai, 1982) and non-linear force free field (NLFFF) extrapolations of the photospheric magnetic field based on the optimization method of Wheatland, Sturrock & Roumeliotis (2000). The NLFFF extrapolation of the seismic region, shows that the lower corona and upper chromosphere are dominated by magnetic field lines of middle and low altitude (Figure 5) which are highly twisted, similar to the loops of the August 14, 2004 flare.
Figure 5 shows a map of the magnetic field lines extrapolated with footpoints located at or close to the seismic region. The map shows an intricate network of low-lying magnetic field lines parallel to the magnetic neutral lines. This structure is recognizable in the Transition Region and Coronal Explorer (TRACE) image at 1600 Å(Figure 7). The extrapolation was computed using the IVM vector magnetogram of January 14, taken at 18:08 UT, 6 hours prior to the onset of the flare. The close match between the visible flaring loops in the TRACE observations and the NLFFF field lines shows that the magnetic geometry did not change drastically in the six hours prior to the flare.
The complex structure of field lines suggests that the flare sequentially illuminated the magnetic loop footpoints in some erratic order but always localised in the same small area. Perhaps this configuration, along with the impulsive characteristics of the flare provided the necessary conditions to drive this powerful sun quake. Complex and erratic motion of the HXR footpoints at the location of the seismic source has been reported before (Martínez-Oliveros, Donea & Cally, 2007; Hudson, Wolfson & Metcalf, 2006; Fletcher et al., 2007).
Although, the NLFFF extrapolation gives a better approximation to the real configuration of the magnetic field, the magnetogram on which this method is based was obtained 6 hour prior to the flare. So, in order to obtain a more general description of the magnetic field configuration before, at the maximum, and after the flare, we calculate potential magnetic field extrapolations at different representative times, based on SOHO-MDI magnetograms (Figure 6). We focus our attention to the overall configuration of the magnetic field of the active region, comparing the results of the extrapolations with the observations made by Extreme ultraviolet Imaging Telescope (EIT) onboard SOHO at 195 Å. We found that the extrapolations are dominated by high and medium altitude magnetic field lines, with mainly north–south orientation. This distribution of magnetic field lines are similar to those observed by SOHO-EIT. In figure 6 we appreciate a redistribution of the magnetic field lines, that can be attribute to the reorganization of the photospheric magnetic field.


6 Discussion
We have shown that the seismic area in AR10720 is located just beneath a complex coronal loop structure with highly twisted lines, which means that the photospheric impact was significant in the region where the twisting allowed a maximum storage of energy. This twisting caused the interaction between neighbouring low-lying loops, triggering the flare. This can be seen in the SOHO-EIT images (Figure 6), where the flaring of the loops is visible along the field lines.
A main question we want to ask now is: how was this sunquake produced? That is, what was the mechanism for transporting the flare energy efficiently, from the reconnection site downward into the chromosphere?
Let us describe a number of possible mechanisms that could trigger a seismic source at the photospheric level during a flare and discuss the likehood that these mechanisms can explain the sunquake of the 2005 January 15 flare.
The first mechanism (Kosovichev & Zharkova, 1998) propose that seismic emission into the solar interior in sunquakes is the continuation of a chromospheric shock and condensation resulting from explosive ablation of the chromosphere and propagating downward through the photosphere into the underlying solar interior. Chromospheric shocks are well known under such circumstances, based on red-shifted H emission at the flare site at the onset of the flare. The simulations were worked out at length by Fisher, Canfield & McClymont (1985a); Fisher, Canfield & McClymont (1985b); Fisher, Canfield & McClymont (1985c) and others since. The hypothesis that the photospheric emission is a direct continuation of such shocks was considered by Donea & Lindsey (2005) and Kosovichev (2006). For the flare studied in this paper, the hydrodynamic impact of the photosphere was clearly significant since, amazingly, this X1.2 type flare triggered a very powerful seismic source and visible seismic waves (see Paper I and Kosovichev (2006) for details). The spatial coincidence between the HXR emission and the seismic source leads us to connect the two processes, and conclude that the high-energy electrons played an important role. However, we have to look at the statistics of acoustically active events (Besliu-Ionescu et al., 2008) and acknowledge that most solar flares do not produce sunquakes. This leads us to believe that, for the majority of flares, strong radiative damping depletes the chromospheric transient before its arrival at the low photosphere. Therefore, we need to look for alternative mechanisms to explain the excitation of seismic sources.
In Paper I we proposed a second mechanism. We stated that the coincidence between the locations of sudden white-light emission and seismic emission in all acoustically active flares (including the 2005 January 15) suggests that a substantial component of the seismic emission seen is a result of sudden heating of the low photosphere associated with the observed excess of visible continuum emission (radiative back-warming). The origin of white-light emission would have to be entirely in the chromosphere, where energetic electrons dissipate their energy (Metcalf et al., 1990; Zharkova & Kobylinskii, 1991; Zharkova & Kobylinskii, 1993), mainly by ionizing previously neutral chromospheric hydrogen approximately to the depth of the temperature minimum. It appears that the low photosphere itself would be significantly heated as well. This is primarily the result of Balmer and Paschen continuum edge recombination radiation from the overlying ionised chromospheric medium, approximately half of which we assume radiates downward and into the underlying photosphere. Donea & Lindsey (2005), Donea et al. (2006), and Moradi et al. (2007) have analysed this process in detail. Chen & Ding (2006) also affirm that the white-light flare signatures highlight the importance of radiative back-warming in transporting the energy to the low photosphere when direct heating by beam electrons is impossible.
A third possible mechanism proposed by Zharkova & Zharkov (2007), states that high-energy protons, can directly deposit energy in the photosphere, inducing a seismic source . However, for the flare of 2005 January 15 there is no indication of high-energy protons that could directly supply the energy on which the acoustic emission depends. Likewise, energetic electrons consistent with HXR signatures, seem to be unable to penetrate into the low photosphere in anywhere near sufficient numbers required to account for the direct heating needed by the seismic sources (Metcalf, Canfield & Saba, 1990).
A fourth mechanism (Hudson, Fisher & Welsch, 2007) suggested that the “McClymont magnetic jerk” can account for the seismic activity of some flares. Here, we want to apply the relations of Hudson, Fisher & Welsch (2007) for the seismic area of AR10720 in order to determine whether the “McClymont magnetic jerk” can account for the seismic activity of the 2005 January 15 flare.
For a line-of-sight MDI magnetic field change of 60 G, as measured in the region where the main kernel of the acoustic seismic appeared (area Mm Mm), the total Lorentz force, for G, is dyne ( dyne/cm2 cm2). In Paper I we observed that the photospheric impact produced a depression of about 10 km. Using this, the maximum work done by the Lorentz force on the photosphere is estimated at ergs, which is twice the energy needed by the entire seismic source to oscillate at a frequency centered at 6 mHz within a 2 mHz band. From Paper I we extract that the seismic kernel accounted for % of the total egression power (estimated at ergs) integrated over the region encompassing the entire flare signature (kernel plus the lenticular diffuse component). Of course, the inferred number is just an upper limit based on many uncertainties of the local physics. We conclude that the “McClymont magnetic jerk” may explain the formation of the acoustic kernel, but does not explain the diffuse lenticular element of seismic activity surrounding the main kernel, which is distributed along the neutral line up to 15 Mm east and 30 Mm west of the kernel (Moradi et al., 2007). The fact that the erratic motion of the HXR sources is observed only above the acoustic kernelled area sustains this assumption.
We note that if integrating over the full area of the seismic source (including the diffuse lenticular acoustic emission surrounding the main kernel) the change in magnetic field is very small (about 5 G), which is understandable, because the full area of the seismic source spans negative and positive magnetic polarities. The area is also permeated by field lines from loops of different orientation, making the local magnetic geometry much more complicated. We also emphasize that the seismic area of the solar flare of 2005 January 15 has magnetic loops of a very large inclination angle, positioning the reconnection site close to photospheric levels.
According to Hudson (2000) and Hudson, Fisher & Welsch (2007), one expects that the field in the photosphere should become “more horizontal”, as a result of the coronal magnetic field contraction that follows the decrease in the coronal magnetic energy. Limited by the existing observations, we cannot say whether the overall field structure of AR10720 had tilted even more during the flaring. Clearly, we cannot definitively affirm that for this complicated structure of AR10720 the Lorentz force is the main triggering mechanism for this quake (we remind the reader that the X1.2 flare of 2005 January 15 generated the most powerful solar seismic source detected so far). We believe that in reality, a combination of all the above mechanisms may be required to describe the entire phenomenon.
For simpler magnetic field configurations, where seismic sources have been also identified (Donea & Lindsey, 2005; Donea et al., 2006) as localised acoustic kernels at the location of moving hard X-ray footpoints, we expect the “McClymont jerk” mechanism to work efficiently in parallel with the chromospheric shocks driven by sudden, thick-target heating of the upper and middle chromosphere (Kosovichev & Zharkova, 1998; Donea & Lindsey, 2005) and the “back-warming” mechanism.

References
- (2008) Besliu-Ionescu, D., Donea, A.-C.,Lindsey, C., Cally, P. S., 2008, Recent Advances on Solar and Solar-Terrestrial Physics, Research SignPost, Trivactrum, India, in press
- (2007) Besliu-Ionescu, D., Donea, A.-C., Lindsey, C., Cally, P., Mari, G., 2007, AdSpR, 40, 1921
- (2006) Besliu-Ionescu, D., Donea, A.-C., Cally, P. S., Lindsey, C., 2006, RoAJS, 16, 203
- Bogdan et al. (2002) Bogdan, T. J. et al., 2002, Astronom. Nachr., 323, 196
- Bogdan & Cally (1997) Bogdan, T. J. & Cally, P.S., 1997, Proc. R. Soc. Lond. A, Math. Phys. Eng. Sci., Vol. 453, 943
- Braun (1995) Braun, D. C., 1995, Astrophys. J., 451, 859
- Braun & Lindsey (1999) Braun, D. C., & Lindsey, C., 1999, Astrophys. J., 513, L79
- Braun, Duvall & Labonte (1987) Braun, D. C., Duvall, T. L., Jr., Labonte, B. J, 1987, Astrophys. J., 319, L27
- Cally (2006) Cally, P. S., 2006, Phil. Trans. Roy. Soc. Lond. A ,364, 333.
- Cally & Bogdan (1993) Cally, P. S., Bogdan, T. J., 1993, Astrophys. J., 402, 721
- Cally, Bogdan & Zweibel (1994) Cally, P. S.; Bogdan, T. J.; Zweibel, E. G., 1994, Astrophys. J., 437, 505.
- Cally & Goosens (2007) Cally, P. S., Goosens, M., 2007, Solar Phys., in press
- Canfield et al. (1993) Canfield et al. , 1993, Astrophys. J., 411, 362.
- Chen & Ding (2006) Chen, Q.R. & Ding M.D.,2006, Astrophys. J., 641, 1217
- Crouch & Cally (2003) Crouch, A. D. & Cally, P. S., 2003, Solar Phys., 214, 201.
- Crouch & Cally (2005) Crouch, A. D. & Cally, P. S., 2005, Solar Phys., 227, 1.
- Donea, Braun, & Lindsey (1999) Donea, A.-C., Braun, D. C., & Lindsey, C., 1999, ApJ, 513, L143
- Donea & Lindsey (2005) Donea, A.-C., & Lindsey, C., 2005, ApJ, 630, L1168
- Donea et al. (2006) Donea, A.-C., Besliu-Ionescu, D., Cally, P. S., Lindsey, C., Zharkova, V. V., 2006, Solar Phys., 239, 113.
- Fisher, Canfield & McClymont (1985a) Fisher, G.H., Canfield, R.S. & McClymont, A.N., 1985, Astrophys. J., 289, 434
- Fisher, Canfield & McClymont (1985b) Fisher, G.H., Canfield, R.S. & McClymont, A.N., 1985, Astrophys. J., 289, 425
- Fisher, Canfield & McClymont (1985c) Fisher, G.H., Canfield, R.S. & McClymont, A.N., 1985, Astrophys. J., 289, 414
- Fletcher et al. (2007) Fletcher, L., Hannah, I. G., Hudson, H. S., Metcalf, T. R., 2007, Astrophys. J., 656, 1187
- Hudson (2000) Hudson, H. S., 2000, Astrophys. J., 531, L75
- Hudson, Fisher & Welsch (2007) Hudson, H. S., Fisher, G. W. & Welsch, B. J.: 2007, in Subsurface and Atmospheric Influences on Solar Activity, ASP Conference Series, R. Howe and R. Komm (eds.), in press.
- Hudson, Wolfson & Metcalf (2006) Hudson, H.S., Wolfson, C.J. & Metcalf, T.R., 2006, Solar Phys., 234, 79
- Kosovichev & Zharkova (1995) Kosovichev, A. G., & Zharkova, V. V., 1995, 4. SOHO Workshop Helioseismology, 2, 341
- Kosovichev & Zharkova (1998) Kosovichev, A. G., & Zharkova, V. V., 1998, Nature, 393, 317
- Kosovichev & Zharkova (2001) Kosovichev, A. G., & Zharkova, V. V., 2001, Astrophys. J., 550, L105
- Kosovichev (2006) Kosovichev, A. G., 2006, Solar Phys., 238, 1
- Lindsey & Braun (2000) Lindsey, C., & Braun, D. C., 2000, Solar Phys., 192, 261
- Martínez-Oliveros et al. (2007) Martínez-Oliveros, J.C., Moradi, H., Besliu-Ionescu, D.,Donea A.-C, Cally, P., 2007, Solar Phys. 245, 121
- Martínez-Oliveros, Donea & Cally (2007) Martínez-Oliveros, J.C., Donea A.-C, Cally, P., 2007, in Waves and Oscillations in the Solar Atmosphere: Heating and Magneto-Seismology, IAU Symposium 247, R. Erdéley and Mendoza-Briceño C.A. (eds.), 3, 110.
- Martínez-Oliveros, Moradi & Donea (2008) Martínez-Oliveros, J.C., Moradi, H., Donea A.-C, 2008, Solar Phys. In press
- Metcalf et al. (1990) Metcalf, T.R., Canfield, R.C., Avrett, E.H., Metcalf, F.T., 1990, Astrophys. J., 350, 463
- Metcalf, Canfield & Saba (1990) Metcalf, T.R., Canfield, R.C., Saba, J.L.R., 1990, Astrophys. J., 365, 391
- Mickey, et al. (1996) Mickey, D. L., Canfield, R. C., Labonte, B. J., Leka, K. D., Waterson, M. F. & Weber, H. M., 1996, Solar Phys., 168, 229
- Moradi et al. (2007) Moradi, H.; Donea, A.-C.; Lindsey, C.; Besliu-Ionescu, D.; Cally, P. S., 2007, Mon. Not. Roy. Astron. Soc., 374, 1155
- Moradi et al. (2006a) Moradi, H., Donea, A.-C, Besliu-Ionescu, D., Cally, P.S., Lindsey, C., Leka, K., 2006, in Solar MHD Theory and Observations: A High Spatial Resolution Perspective, ASP Conference Series, J. Leibacher, R. F. Stein, and H. Uitenbroek (eds.), 354, 168
- Moradi et al. (2006b) Moradi, H., Donea, A.-C, Lindsey, C., Besliu-Ionescu, D., Cally, P.S., 2006, in SOHO 18/GONG 2006/HELAS I, Beyond the spherical Sun, K. Fletcher (ed), CDROM, p.66.1
- Sakurai (1982) Sakurai, T., 1982, Solar Phys., 76, 301
- Scherrer et al. (1995) Scherrer, P.H., et al., 1995, Solar Phys., 210, 287
- Schunker et al. (2005) Schunker, H. J., Braun, D. C., Cally, P. S., & Lindsey, C., 2005, Astrophys. J., 621, L149
- Sudol & Harvey (2005) Sudol, J.J. & Harvey, J.W., 2005, Astrophys. J., 635, 697
- Wheatland, Sturrock & Roumeliotis (2000) Wheatland, M.S., Sturrock, P.A. & Roumeliotis, G., 2000, Astrophys. J., 540, 1150
- Wolff (1972) Wolff, C., 1972, Astrophys. J., 176, 833
- Zharkova & Kobylinskii (1993) Zharkova, V.V. & Kobylinskii, V.A., 1993, Solar Phys.., 17, 34
- Zharkova & Kobylinskii (1991) Zharkova, V.V. & Kobylinskii, V.A., 1991, Sov. Astronom. Lett., 143, 259
- Zharkova & Zharkov (2007) Zharkova V. V. & Zharkov S., 2007, Astrophys. J., 664, 573