Sub-milliarcsecond precision spectro-astrometry of Be stars
Abstract
Context. The origin of the disks around Be stars is still not known. Further progress requires a proper parametrization of their structure, both spatially and spectrally. This is challenging as the disks are very small.
Aims. Here we assess whether a novel method is capable of providing these data.
Methods. We obtained spectro-astrometry around the Pa line of two bright Be stars, Col and Tau, to search for disk signatures. The data, with a pixel-to-pixel precision of the centroid position of 0.3..0.4 milliarcsecond is the most accurate such data to date. Artefacts at the 0.85 mas are present in the data, but these are readily identified as they were non-repeatable in our redundant datasets. This does illustrate the need of taking multiple data to avoid spurious detections.
Results. The data are compared with model simulations of the spectro-astrometric signatures due to rotating disks around Be stars. The upper limits we find for the disk radii correspond to disk sizes of a few dozen stellar radii if they rotate Keplerian. This is very close to observationally measured and theoretically expected disk sizes, and this paper therefore demonstrates that spectro-astrometry, of which we present the first such attempt, has the potential to resolve the disks around Be stars.
Key Words.
techniques: high angular resolution - techniques: spectroscopic - stars: individual: Col, Tau - stars: emission-line,Be1 Introduction
For decades it had been surmised that Be stars are surrounded by disk-like structures. At first this was inferred by indirect means such as the doubly peaked H emission line profiles (Struve, 1931) and polarization (Poeckert, 1975). This notion was confirmed only much later by direct, interferometric observations at radio wavelengths (Dougherty & Taylor, 1992). Later, dedicated long-baseline optical and near-infrared (NIR) interferometry resolved the disks at selected baselines (e.g. Quirrenbach et al. 1997; Tycner et al. 2004; Meilland et al. 2007 - for a general review on Be stars see Porter & Rivinius 2003). So far, relatively few Be stars have been studied in this manner. This is due to the fact that the disks are small, even the largest observed disks are typically of order a few milliarcsec (mas) in diameter and observations remain challenging.
In this paper we investigate the potential of spectro-astrometry to detect disks around Be stars. This technique is a powerful tool; it enables us to investigate small scale structures with a standard instrumental set-up. In addition, since data are taken at high spectral resolution, it also allows kinematical studies to be performed at superior resolution than for interferometry. Spectro-astrometry is a proven method to study otherwise unresolved structures in longslit spectra. It has been used to study binaries (Bailey 1998; Baines et al. 2004; Baines et al. 2006; Schnerr et al. 2006), outflows from young objects (Takami et al., 2003), disks around young objects (Pontoppidan et al., 2008) and even made possible the discovery of bi-polar jets from Brown Dwarfs (Whelan et al., 2005). Conceptually, this technique is straightforward, it measures the relative spatial position of spectral features from a longslit spectrum. For example, the red- and blueshifted emission of a rotating disk will be located on opposite sides of the continuum. Even when spatially unresolved, the centroid position of the spectrum will be offset from the continuum, and this can be determined very accurately to sub-pixel values (see e.g. Bailey 1998). The method has been shown to detect binaries at separations of 0.1 arcsec in conditions where the seeing was in excess of 2 arcsec, while brightness differences between the binary components of up to 6 magnitudes have been observed as well (Baines et al., 2006). Observationally, it is a comparatively cheap method, requiring only a stable spectrograph and a digital detector. It can therefore be applied to large samples of object.
As for example demonstrated by Takami et al. (2003), the positional accuracy of the centroid mainly depends on the number of photons and the seeing and can be expressed as , with the error and full width half maximum of the profile (typically the seeing) expressed in arcsec or milliarcsec, and is the number of photons. For shot-noise dominated statistics, equates to the inverse signal-to-noise ratio (SNR) of the total spectrum. Therefore, the requirements are proper sampling, high SNR, and a narrow instrumental point spread function (i.e. good seeing). Baines et al. (2006) achieved a position accuracy, as measured from the root-mean-square (rms) variations in the position, of 2 mas in 2 arcsec seeing. The aim of the present study is to significantly improve on this statistic to investigate whether we can detect the milliarcsecond scale disks around Be stars.
This paper is organized as follows. In Sec. 2 we describe the observations of two bright, nearby Be stars. and reduction procedure. In Sec. 3 we present the results of the study, introduce the sub-milliarcsecond spectro-astrometry and we discuss the results in terms of a simple model. We conclude in Sec. 4.
| Object | HD/HR | Sp type | V | vsin | PA | exp time | SNR | Pa EW | rms pos | |
|---|---|---|---|---|---|---|---|---|---|---|
| (mag) | (kms | (o) | (s) | () | (kms-1) | (mas) | ||||
| Col | 37795 | B7IVe | 2.64 | 176 | 90-270 | 8 x 6 | 1200 | 8 | 134 | 0.35 |
| 1956 | 180-360 | 8 x 6 | 0.40 | |||||||
| Tau | 37202 | B4IIIpe | 3 | 310 | 58-238 | 8 x 10 | 1500 | 5 | 226 | 0.25 |
| 1910 | 148-328 | 8 x 10 | 0.30 | |||||||
2 Observations and Data Reduction
For this experiment we selected two Be stars that were bright, close-by and had a track record of strong hydrogen recombination line emission. These factors should ensure that they are surrounded by comparatively large disks. Indeed, Tau had been measured to have an H diameter of 7 mas (e.g. Tycner et al. 2004). Col has no published interferometric data, estimates indicate a larger size of its line emitting region than of Tau (Dachs et al., 1992). For the choice of telescope, we had to trade-off between an excellent sampling of the spectro-astrometry and the choice of target line. H may be expected to form in larger regions, but the near-infrared instrumentation described below provided excellent sampling. For this pilot study, we decided to push the best available equipment to us and observed Pa at 1.28m.
The spectro-astrometric data were obtained in service mode with the Phoenix instrument (Hinkle et al., 2003) mounted on 8m Gemini South in Chile during the night of December 19 (UT) 2004. Phoenix is a high resolution near-infrared spectrometer operating in the wavelength region 1-5m. The target line was the Pa hydrogen recombination line, a strong line in a region of the spectrum that is relatively unaffected by telluric absorption.
The grating was set such that the 1.28 m Pa line was in the centre. The detector was an Aladdin 10241024 InSb array with a pixel size of 5.9m (in wavelength, corresponding to 1.4 kms-1) spectrally, resulting in an unvignetted wavelength coverage of 1300 kms-1. The pixel size in the spatial direction was 85 milliarcsec, and the slit was 4 pixels wide. The seeing during the observations was hovering between 0.40-0.55 arcsec as measured from the central parts of the spectra. The set-up ensured that both the spatial and spectral resolution elements were sampled by 4-5 pixels. This is much better than Nyquist sampling and having the data sampled by such a large number of pixels is a crucial constraint when dealing with spectro-astrometry. Although not strictly necessary with such bright targets at this wavelength, the observations were done in the standard a-b-b-a nodding on the slit to remove sky emission.
In addition to the usual East-West and North-South slit positions, that makes sure we can measure the position angles for any extended material in the data, we observed at the opposite angles as well. The rationale is that the observations have to be repeatable and spurious effects should be identified by multiple observations. Real effects are each other’s mirror image (one is looking at the objects upside down as it were), instrumental artifacts would be present in the same direction on the array (see for more details Bailey 1998 and Baines et al. 2006). In the case of Col, the slit position angles (PA) were set at 0o, 90o, 180o, and 270o. Tau was observed at 58o, 148o, 238o, and 328o. The choice of different PAs rather than the usual EW-NW settings was that the slit would be aligned with the disk resolved in interferometric data of (Quirrenbach et al., 1997). However, they report a position angle of , and the omission of the minus sign in our instrumental set-up means that the data are somewhat less efficient than they could have been. At each slit position, the objects were observed 4 times with the nodding procedure and the total spectra consist of 16 integrations with exposure times of 6s each for Col and 10s for Tau respectively. The overhead associated with rotating the slit was small and the total on-target time was less than 45 minutes in both cases.
The data were reduced in a standard manner for optical data using both the IRAF (Tody, 1993) and Starlink software packages. Dark frames were subtracted from the original frames, which were then divided by a normalized flatfield. The intensity spectra were extracted and the individual spectra co-added to arrive at the total spectra that are discussed in the remainder of this paper. The observational details and some derived parameters are summarised in Table 1 The wavelength calibration was performed by identifying telluric absorption lines measured from the catalogue by Hinkle et al. (1995) and finding the dispersion of the spectra. The resulting wavelength should be accurate to within 0.25 kms-1. The FWHM of telluric lines that were assumed to be unresolved was measured to be in the range of 6..6.5 kms-1, in agreement with the expected resolution .
Spectro-astrometric information was extracted from the 2-dimensional longslit data by fitting a Gaussian profile to the stellar flux at each pixel in the spatial direction. By visually inspecting the data we confirmed that the Gaussians are a good representation of the point spread function. However, as Porter et al. (2004) pointed out, the precise shape of the fitting function is not very critical. The positions of the center were recorded as a function of pixel number, and later put on a wavelength scale.
Four position spectra were obtained at every position angle. The individual traces had different shapes on the larger (more than tens of pixels) scales. This effect is presumably present because they were recorded at different locations on the array because of the nodding procedure. To eliminate these large scale fluctuations, while at the same time preserving the smaller scale properties, the position spectra were fitted by a high order polynomial. The position data taken at opposite position angles (0-180o etc), were subtracted from each other to minimize any remaining instrumental effects. Prior to combining, all eight traces per orientation were visually inspected in order to identify and remove outlying data. For both orientations of Col, one trace each was discarded, for Tau all traces at a PA of 58o were retained, while 2 of the 8 traces perpendicular to this were excluded.
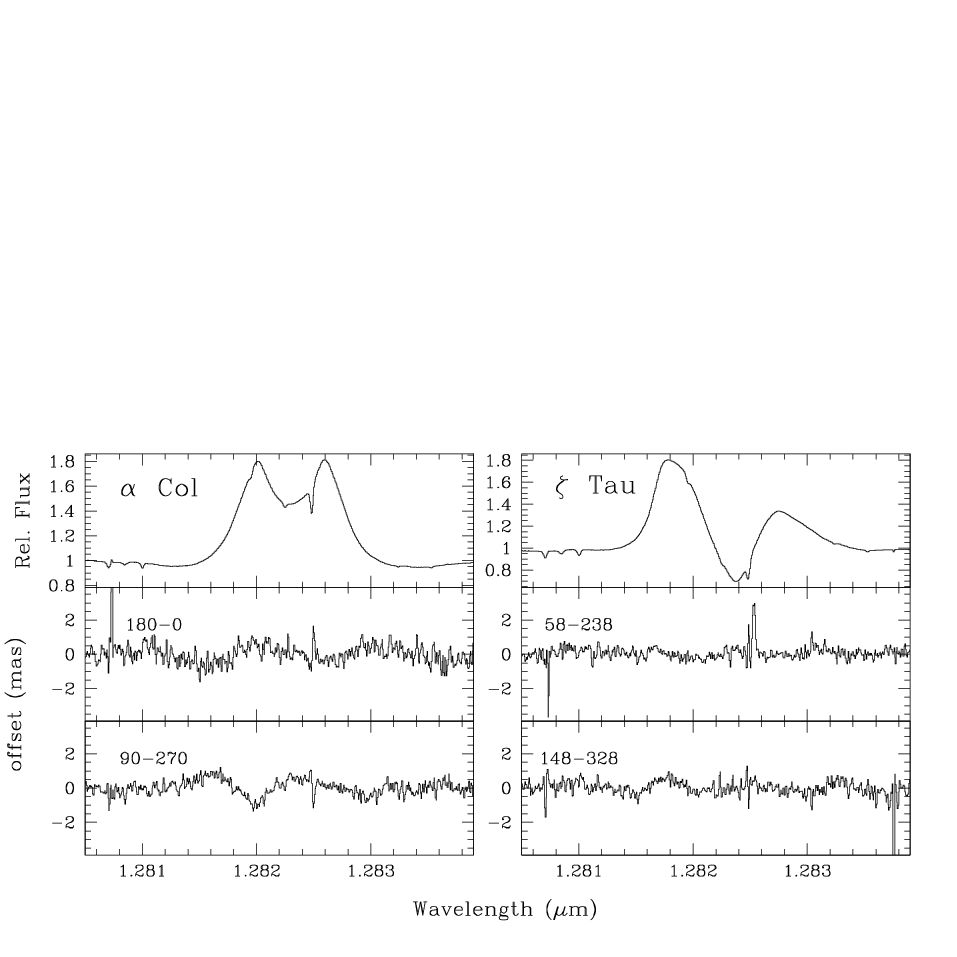
The precision in determining the photo-centre of the longslit spectra as measured from pixel-to-pixel deviations from the mean position was of order 0.3 mas (see Table 1). This positional accuracy is the best quality data ever published from a statistical pixel-to-pixel point of view. However, in the current data set we also see variations, unrelated to the pixel-to-pixel variations, over larger scales, with excursions up to 1 mas. The largest such multi-pixel variations can be seen in the East-West direction for Col (see Figure 1). A sine-wave type feature spanning many pixels with an amplitude of 0.85 mas, almost 3, appears visible. The dip corresponds to the blue peak of the Pa line profile, but the two local “maxima” around the dip do not correspond to any obvious feature in the emission line. Further inspection of the data revealed that the individual traces taken at opposite angles also show this pattern. Significantly however, the minima and maxima occur at different wavelengths, and are therefore not reproduceable. A similar behaviour is also found in the data of Tau, but in this case it is cancelled out after combination of the individual traces. We therefore conclude that the traces in Col that seem to display a “periodic” signal with an amplitude of less than a hundredth of a pixel are artefacts, as they are not reproduceable in our, redundant, data. The reasons for this are unclear and future observations are planned to investigate this issue. In summary, the data have a, statistical, precision of 0.3 mas, while larger scale artefacts of order slightly less than 1 mas are identified.
3 Results
3.1 The Pa lines
The results for Col and Tau are plotted in Fig. 1. The top panels display the total intensity spectra while the bottom two panels represent the spectro-astrometry at the two orientations respectively. Let us first discuss the Pa profiles. Both stars have doubly peaked emission lines. Col has a regular, symmetric line profile, while the blue peak of Tau’s emission is much stronger than the red peak. The Equivalent Widths () are 8 and 5 and the line peak separations are 134 and 226 kms-1 for Col and Tau respectively.
The emission at the wavelengths covered by the Pa line is due to three components. Firstly, the emission line itself, secondly continuum free-free emission and thirdly, the stellar continuum, which is diluted by the underlying, photospheric, Pa absorption line. We can estimate the contribution of the free-free emission to the total flux. At shorter wavelengths it is fairly low, as the continuum excess due to free-free emission increases towards longer wavelengths (see e.g. the in-depth study by Dougherty et al. 1991). For Tau, Dougherty et al. (1991) derive an excess of 0.1 magnitude at 1.25 m, which roughly corresponds to 10% of the emission being due to the disk. Dougherty et al. (1991) did not include Col in their sample. Dachs et al. (1988) observed the object in the optical and near-infrared one month apart and we derive a quasi-simultaneous VJ colour of . According to Koornneef (1983), (VJ for a B7V object is 0.25 mag (he does not list values for sub-giants with luminosity class IV). Taken at face value, we would thus obtain a non-physical, negative excess. However, the difference is comparable to the uncertainty in spectral class and photometric errorbars, and illustrates that the excess continuum emission at Pa must be very small. The depth of the underlying photospheric Pa absorption can be assessed using the data of Wallace et al. (2000). They present medium resolution spectroscopy of 88 MK spectral standards, amongst which a number of B-type stars. The stars in their sample with spectral types closest to ours, B7III, B7V and B3IV (HR 1791, HR 3982 and HR 6588 respectively), span a wide range in spectral type. The central dip ranges from 0.6..0.65 of the continuum for the narrower lines (B3IV, B7III) to 0.78 (B7V) for the broader line. At 100 and +100 kms-1 from the line center, where the line emission peaks are found, the absorption for all three objects reaches down to 0.85..0.9 of the continuum, i.e. a depression of 10..15%.
Hence, given that the spectral types of our target objects of B4III and B7IV, are similar to that sampled by these MK standard stars, we assume that the photospheric absorption line underneath the line peaks is about the same fraction of the line free continuum. As the peak line emission is roughly twice that of the stellar continuum (1.98 and 1.84 for Col and Tau respectively), we find that the emission from the stellar photosphere and the hydrogen recombination line are approximately equal.
3.2 The spectro-astrometry
The spectro-astrometric traces, at both orthogonal orientations, are shown in the middle and bottom panels of Fig. 1. The traces are normalized to the stellar continuum and the deviations from it are expressed in milliarcseconds. Several things are immediately apparent from the data. Firstly, the rms variations around the mean position are much smaller than 0.5 mas (Table 1). Thus, the data have a sub-milliarcsecond precision, and therefore constitute the most accurate spectro-astrometry of any object hitherto observed. As we are exploring unknown territory, it may not come as a surprise that we encounter new problems in the data. After the multi-pixel variations that stretch to slightly less than 1 mas in Col, the second obvious finding in the spectro-astrometric traces is that the telluric features show strong, in fact the strongest, signals. These narrow absorption lines are unresolved and we suspect that pixellation effects give rise to these features. Checks on data taken at opposite angles revealed that the amplitude of the excursion varies with the location of the longslit spectrum on the array. It is always in the same direction, and therefore an artefact. For illustration we kept the data in the figures. Finally, there is no obvious excursion in position space associated with the Pa profiles.
We conclude that in the present data we find no evidence for significant features in the positional data down to sub-milliarcsecond levels. It also illustrates the need for multiple exposures to ensure consistency and to avoid artifacts in the data being interpreted as real. In the following we will investigate the implications for the presence of disks around both objects and the presence of a binary companions.
3.3 On the stars’ binarity and their disks’ sizes
Based on radial measurements Tau is reported to be a single-lined, close binary (Jarad, 1987). The separation is 5 mas and, from the mass function, the primary is at least 5 magnitudes brighter than the secondary (Tycner et al., 2004). This large magnitude difference combined with the small separation makes detection of the secondary very difficult (see also Baines et al. 2006), and explains why we do not see a binary signature in the data of Tau. Col has not been reported to be a binary, and the data do not show the presence of a binary companion either.
We can estimate the size of the Pa line emitting region from the spectrum. Most methods such as the of the emission employ the entire line profile to do this (e.g. Grundstrom & Gies 2006), even interferometrically determined sizes are based on the total line emission. Here, we exploit the fact that we have spatial information available at high spectral resolution. If the disks are in Keplerian rotation, we can compute the distance from the star of the bulk of the orbiting material using its rotation velocity. Using values for the masses and radii for the spectral types (taken from Straizys & Kuriliene 1981, and interpolated between B3 and B5 to arrive at a value for Tau), we computed the Keplerian rotation speeds at the stellar surface (457 and 489 kms-1 for Col and Tau). The observed velocities at the line peaks (half the peak separation in Table 1) combined with the distances to the objects provided by Hipparcos, yield the distance of the line peak forming regions from the star of 8.8 mas ( Col) and 3.9 mas ( Tau). However, the observed velocities are smaller than the true value by a factor sin, and the distance from which the emission originates is smaller by (sin)2 (for Keplerian rotation). Taking the inclinations derived by Frémat et al. (2005, 45o and 66o) we obtain 4.4 and 3.2 mas for Col and Tau respectively. The amplitude of the excursion in the positional data associated with these separations can be calculated by simulating the data at the line-peak, convolving them with the seeing and determining the spectro-astrometric trace (cf. Baines et al. 2006). In both cases, the photo-center is precisely halfway because the line peaks are equally bright as the star. We therefore would expect, based on the above, that in the present data line excursions of up to 2.2 mas ( Col) and 1.6 mas ( Tau) can be observed. This is the maximum observable separation, as the above computation assumes that all line emission arises from a thin ring with a rotation speed corresponding to the line peak.

Not all emission at the line peak comes from a single ring however, as the projected velocities for smaller, faster, rings will be observed as well at the observed Doppler shifts. To assess this effect we performed some simple model calculations. We assume the star to be surrounded by a geometrically thin, Keplerian rotating disk reaching onto the stellar surface, with the line flux per unit area following a simple power law in radius. The main input parameters of the model are the stellar radius, rotation speed, the inclination and emission line strength (which are all fairly well known), the remaining free parameters are the disk’s outer radius and the exponent of the power law. The model produces a two dimensional position-velocity diagram, which is binned up and smoothed to represent our pixel sizes of 5 kms-1, 85 mas and seeing of 500 mas respectively. From the resulting data, the spectro-astrometry is then measured. Changing the outer radius of the model disk increases the spectro-astrometric excursions, which then occur at lower velocities, as expected from Keplerian rotation. A stronger line flux will yield a larger spectro-astrometric excursion because the photo-centre shifts more in the direction of the emission line.
In the extreme case of optically thick emission, the powerlaw will have a flat slope and the emerging line flux will be dominated by the outer parts of the disk. In the other extreme, that of optically thin emission, the power law depends on the density distribution. For an isothermal, flaring Keplerian disk, the surface density, and by implication the flux per unit area, has an powerlaw dependence (cf. Carciofi et al. 2006). As a consequence, the line emission moves towards the inner parts of the disk. The main positional excursions will thus occur at higher velocities, closer to the star and therefore be smaller than in the optically thick case. Changing the exponent of the powerlaw also affects the shape of the emission line. A shallower exponent, more representative of the optically thick case, puts more flux at lower velocities, while a steeper power law, closer to the optically thin situation, results in narrower lines, with the line peak at higher velocities.
In general though, unless the exponent gets too steep, the excursions are of similar magnitude when the same line-to-continuum ratio is simulated. We performed a large parameter study, but for the purposes of this paper, we will restrain ourselves to one illustrative example representative of both objects. We set the line-to-continuum ratio to be 2 (as per the spectra in Fig. 1 and derived above), use a stellar rotational velocity of 475 kms-1 (halfway the values for both objects) and an inclination of 55o (also roughly halfway the two objects) and use a stellar radius of 0.2 mas. For the outer radius of the disk we take 10, 30 and a maximum of 70 stellar radii (cf. Marlborough et al. 1997). The resulting data are shown in Fig. 2. The top panel presents the resulting model line profiles. As expected, the lines are doubly peaked with peak separations that are larger for smaller disk radii. The separations range from 110kms-1 for the largest disk to 160 and 270 kms-1 for the smallest disks, respectively. This trend is explained by the fact that these velocities correspond to the Keplerian rotation speeds at the maximum possible radii, where most of the line flux originates if the emission is optically thick. The most notable differences between the model line profiles and the observed line profiles are the relative narrowness of the line peaks and the little emission at low projected velocities. This is probably due to the fact that the model disks are assumed to be geometrically thin, resulting in low projected emitting surface areas at low velocities. In reality the disks are flared, and therefore the emitting area will be much larger, in particular at these low velocities. In addition, line broadening is not taken into account here. For a proper treatment, radiative transfer models such as those by Carciofi & Bjorkman (2006) will be an excellent tool. Using such advanced models is beyond the scope of this paper, in which we wish to obtain a rough figure for the excursions only.
We also note that the blue peak of Tau is much stronger than the red peak. This is most likely due to one-armed oscillations in its disk, which give rise to such asymmetry, as for example detected for Tau at the 0.7 mas level by Vakili et al. (1998). Accordingly, the positional excursion of the blue peak would be larger than that of the red one, but its signature would not affect the overall appearance of the spectro-astrometry.
Moving to the spectro-astrometric signature in the simulations, we find that the positional excursions are smaller for smaller disks (1.5, 0.6 and 0.2 mas respectively) for the same reason as that the peak separations are larger: most flux comes from the outer parts, and the largest model disk will naturally result in the largest detection. As the orientations of the disks are not aligned with the slit positions, we might in reality observe smaller excursions in our data by up to a factor of 0.7 due to projection effects.
The bottomline of the exploratory model simulations is that disks with a size of order 70 stellar radii and a predicted excursion of 1.5 mas could just about have been observed at the 3-4 level, while the 30 stellar radii disk would have been a 2 detection. These limits are approaching the real sizes of the disks. According to Tycner et al. (2004), the disk of Tau has a diameter of 7 mas, and thus a radius of 18 stellar radii, whereas Col’s disk is assumed to be larger, mainly because of its larger line EW (Dachs et al., 1992). It is clear that our pixel-to-pixel precision, of order 0.35 mas, is reaching that needed to detect Keplerian disks. It will thus be possible to measure the disks and their kinematics and therefore to properly constrain the disks with future data. In order to achieve this, observations should result in a better SNR, or be targetted at stronger emission lines (in terms of line-to-continuum ratio), either for stars with larger disks or from intrinsically stronger lines at different wavelengths such as H.
High precision data such as these combined with the latest radiative transfer models Carciofi & Bjorkman (2006) will allow us to be in a position to fully constrain the kinematical structure of Be star disks, and reveal their origin.
4 Conclusion
In conclusion, we employed high precision spectro-astrometry to assess the potential of the method to detect the disks around two Be stars. We achieved rms variations in the position spectra of order 0.3 mas, the highest precision spectro-astrometric data in the literature. We did not detect any features related to the Pa lines, but found artefacts at the 1 mas level. These were easily identified as they were non-repeatable in our redundant datasets.
Simple, robust, estimates of the size of the line forming regions showed that the current set-up was on the limit of detecting the disks, if they were rotating Keplerian. Indeed, the method has the potential to distinguish between Keplerian rotating disks and angular momentum conserving disks which would be much smaller. This study, the first of its sort, has shown that the method has great potential in probing small, sub-milliarcsecond, scale structures and future observations using improved set-up, even higher SNR, and possibly moving to the intrinsically brightest hydrogen recombination lines which should reveal even larger disk-signatures in the data are planned.
Acknowledgments
RDO is grateful for the support from the Leverhulme Trust for awarding a Research Fellowship. AMP acknowledges support from The Rothschild Community of Excellence Programme. This work is based on data from the Phoenix infrared spectrograph, developed and operated by the National Optical Astronomy Observatory. The observations are from programme GS-2004B-Q-92 obtained at the Gemini Observatory, which is operated by the Association of Universities for Research in Astronomy, Inc., under a cooperative agreement with the NSF on behalf of the Gemini partnership.
References
- Bailey (1998) Bailey, J. 1998, MNRAS, 301, 161
- Baines et al. (2004) Baines, D., Oudmaijer, R. D., Mora, A., et al. 2004, MNRAS, 353, 697
- Baines et al. (2006) Baines, D., Oudmaijer, R. D., Porter, J. M., & Pozzo, M. 2006, MNRAS, 367, 737
- Carciofi & Bjorkman (2006) Carciofi, A. C. & Bjorkman, J. E. 2006, ApJ, 639, 1081
- Carciofi et al. (2006) Carciofi, A. C., Miroshnichenko, A. S., Kusakin, A. V., et al. 2006, ApJ, 652, 1617
- Dachs et al. (1992) Dachs, J., Hummel, W., & Hanuschik, R. W. 1992, A&AS, 95, 437
- Dachs et al. (1988) Dachs, J., Kiehling, R., & Engels, D. 1988, A&A, 194, 167
- Dougherty & Taylor (1992) Dougherty, S. M. & Taylor, A. R. 1992, Nature, 359, 808
- Dougherty et al. (1991) Dougherty, S. M., Taylor, A. R., & Clark, T. A. 1991, AJ, 102, 1753
- Frémat et al. (2005) Frémat, Y., Zorec, J., Hubert, A.-M., & Floquet, M. 2005, A&A, 440, 305
- Grundstrom & Gies (2006) Grundstrom, E. D. & Gies, D. R. 2006, ApJ, 651, L53
- Hinkle et al. (1995) Hinkle, K., Wallace, L., & Livingston, W. 1995, PASP, 107, 1042
- Hinkle et al. (2003) Hinkle, K. H., Blum, R. D., Joyce, R. R., et al. 2003, in SPIE, Vol. 4834, , 353–363
- Hoffleit & Jaschek (1982) Hoffleit, D. & Jaschek, C. 1982, The Bright Star Catalogue (The Bright Star Catalogue, New Haven: Yale University Observatory (4th edition), 1982)
- Jarad (1987) Jarad, M. M. 1987, Ap&SS, 139, 83
- Koornneef (1983) Koornneef, J. 1983, A&A, 128, 84
- Marlborough et al. (1997) Marlborough, J. M., Zijlstra, J.-W., & Waters, L. B. F. M. 1997, A&A, 321, 867
- Meilland et al. (2007) Meilland, A., Stee, P., Vannier, M., et al. 2007, A&A, 464, 59
- Poeckert (1975) Poeckert, R. 1975, ApJ, 196, 777
- Pontoppidan et al. (2008) Pontoppidan, K. M., Blake, G. A., van Dishoeck, E. F., et al. 2008, ArXiv e-prints, 805.3314
- Porter et al. (2004) Porter, J. M., Oudmaijer, R. D., & Baines, D. 2004, A&A, 428, 327
- Porter & Rivinius (2003) Porter, J. M. & Rivinius, T. 2003, PASP, 115, 1153
- Quirrenbach et al. (1997) Quirrenbach, A., Bjorkman, K. S., Bjorkman, J. E., et al. 1997, ApJ, 479, 477
- Schnerr et al. (2006) Schnerr, R. S., Henrichs, H. F., Oudmaijer, R. D., & Telting, J. H. 2006, A&A, 459, L21
- Straizys & Kuriliene (1981) Straizys, V. & Kuriliene, G. 1981, Ap&SS, 80, 353
- Struve (1931) Struve, O. 1931, ApJ, 73, 94
- Takami et al. (2003) Takami, M., Bailey, J., & Chrysostomou, A. 2003, A&A, 397, 675
- Tody (1993) Tody, D. 1993, in ASP Conference Series, Vol. 52, , ed. R. J. Hanisch, R. J. V. Brissenden, & J. Barnes, 173
- Tycner et al. (2004) Tycner, C., Hajian, A. R., Armstrong, J. T., et al. 2004, AJ, 127, 1194
- Vakili et al. (1998) Vakili, F., Mourard, D., Stee, P., et al. 1998, A&A, 335, 261
- Wallace et al. (2000) Wallace, L., Meyer, M. R., Hinkle, K., & Edwards, S. 2000, ApJ, 535, 325
- Whelan et al. (2005) Whelan, E. T., Ray, T. P., Bacciotti, F., et al. 2005, Nature, 435, 652