The Dynamics of Internet Traffic: Self-Similarity, Self-Organization, and Complex Phenomena
Abstract
The Internet is the most complex system ever created in human history. Therefore, its dynamics and traffic unsurprisingly take on a rich variety of complex dynamics, self-organization, and other phenomena that have been researched for years. This paper is a review of the complex dynamics of Internet traffic. Departing from normal treatises, we will take a view from both the network engineering and physics perspectives showing the strengths and weaknesses as well as insights of both. In addition, many less covered phenomena such as traffic oscillations, large-scale effects of worm traffic, and comparisons of the Internet and biological models will be covered.
keywords
complex networks; Internet; internet traffic; self-similarity; fractals; self-organization; phase transition; critical phenomena; congestion;Internet Protocols1 Introduction
In the last ten years, research of networks, especially the Internet, has exploded amongst physicists. This follows at least twenty years of research on the same and similar questions among computer scientists and network engineering researchers. Interest in the physics community began with several seminal papers on small-world and scale-free networks [57, 194, 15, 153, 141]. Since then, this research has progressed at a rapid pace borrowing well-developed tools from statistical mechanics and thermodynamics, spectral graph theory, and percolation theory among others to enhance the understandings of fields such as Internet topology and social network analysis previously only researched by the network engineering and sociology communities. This new interdisciplinary work has been very fruitful. However, there are gaps only more recently being addressed. In particular, while the contribution of physicists to the understandings of topology and community structure in networks is substantial, often both physicists (and their counterparts in sociology or network engineering) are often unaware of work on the similar questions in other fields. In addition, similar theoretical understandings and predictions for network dynamics such as those now being reached for topology remain elusive and are still in the earliest stages. There have been good papers written on dynamics by physicists but they have yet to formulate results with the same generality or detail as the results on topology.
Just like the fist tentative measurements of Internet topology allowed the field of networks to grow, Internet traffic dynamics have provided a similar opportunity. Serious research on the macroscopic nature of Internet traffic can be traced almost to its inception, however, only in about the last 15 years has the field come of age and begun to provide truly deep insights into how communication over the largest technological edifice in human history operates. Within this time the terms, “self-similarity”, “multifractal”, and “critical phenomena” have emerged to try to refashion our ideas about the Internet and how it behaves. This paper could just be a review of the work by physicists and engineers on network traffic, however, my familiarity with the research in the field has convinced me that for a full understanding of the state of the art research in Internet traffic dynamics, separating the views of engineers and physicists would make any analysis incomplete and inadequate. An area for improvement in this research on network traffic is the increasing collaboration and cross-citation of works from other fields. Though in the study of networks there are notable exceptions, in general, physicists and engineers studying the Internet conduct their own research projects, using field specific methodologies, and publish in field specific journals with little cross-citation of relevant results from the other disciplines. Indeed, one can see from the average paper in physics journals such as Physical Review E or Physica A or from engineering journals such as the IEEE or ACM series of journals that many interrelated problems are being studied from totally different perspectives. This has sometimes caused tension, especially between physicists and network engineers, about the utility, details, or real-world validation of physics based theories and the lack of generality and generally applicable network principles among the engineering perspective.
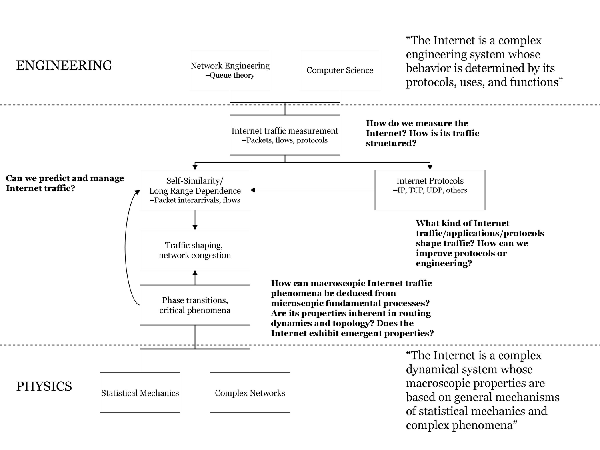
In figure 1, I have tried to give a full diagram and summary of how these different world views operate. If someone is trying to see which view is completely “right” or “wrong” they are missing the point that the Internet is in some part everything that both sides describe it as. It is an example of an engineering system that is dependent on the precise nature of its protocols and other workings to function. It is also a large-scale self-organized system not far removed from those that physicists have studied in physical systems for years. However, the research rarely reflects a full synthesis of both views. Also, both perspectives are more correct on some points than on others. For researchers interested in this area, or even those who feel themselves to be seasoned veterans, one of the first papers I recommend is [102] which is a short position paper released by the 2006 CAIDA Workshop on Internet Topology. Attended by eminent physicists and engineers, this workshop clearly spelled out the promise and peril of multidisciplinary research on Internet topology and traffic.
In line with the increasing focus on network dynamics, and the reality that many of such research projects involve the Internet, this review paper is meant to familiarize mainly physicists and engineers with the major results of each other and how they interrelate. For physicists, hopefully it will provide more exact information on the workings of packet switching systems in the Internet in order to allow us to better test our predictions against reality, build more realistic models and simulations, validate models and theories with real data such as traffic traces, and contribute to the study of network dynamics through a more complete understanding of the dynamics of the Internet. For network engineers, they can see the issues raised by statistical mechanics approaches towards network features such as congestion and realize that there can possibly be large-scale phenomena quite independent of detailed technical specifications. Since the Internet probably has the largest readily accessible and easily understandable archive of network traffic dynamics, it could likely play a huge role in empirically validating theoretical ideas and simulations of dynamics in networks.
This paper is organized in order to provide not only a review of current research in the field but to provide a basic introduction in the workings of the Internet for newcomers to the field. First, I will review the basic ideas of Internet traffic including packets, definitions of flows and throughput, and the basic protocols. While this may seem common knowledge, much work in the field can only be understood if you have the correct definitions and knowledge of the Internet basics. Therefore, this is provided to prevent confusion and perhaps inform on less discussed topics. Next, we will discuss the evolution and composition of Internet traffic as far as usage and protocols are concerned and study the basic dynamics of packet flow including packet size distribution and Internet flow characteristics. The meat of the paper involves a detailed discussion of the self-similar nature of Internet traffic and how it is defined and measured, the detailed workings and dynamics of the TCP transport protocol, as well as the large body of work by physicists on phase transition and critical phenomena models on packet switching networks. These techniques will be reviewed and their possible promises and current pitfalls addressed. Finally, several interesting and related phenomena present in Internet traffic such as oscillations will be covered. Each idea is given a firm grounding and a thorough introduction but there will be no pretense that I can completely delve into all research on any of these ideas in one paper. Self-similar traffic alone has already inspired several volumes on even its most esoteric aspects. However, it is hoped this paper will allow someone with a reasonably technical background and minimal familiarity with the subject and research to quickly grasp the main themes and results that have emerged from the research. Even for those that consider themselves experts, there may be small insights or details that have been poorly covered in most treatments and may add to their knowledge of the subject.
2 Packets, OSI Network Layers, and Key Terminology
This first section of the paper will be its longest and will explain from the ground up the nature of Internet packet traffic and its key transport level protocol, TCP. This information is essential to those attempting to understand the Internet’s functions and allows one to both understand other work in papers across many fields as well as develop more realistic models of the Internet based off its actual parameters and not idealizations.
2.1 Packets and OSI
In 1969, the Internet (then ARPANET) was first established as a distributed packet communications network that would reliably operate if some of its nodes were destroyed in an enemy attack as well as facilitate communication between computer centers in academia. Though the Internet has changed greatly up until today, its packet switching mechanism and flexibility remain its key aspects. The packet is the core unit of all Internet traffic. A packet is a discrete bundle of data which is transmitted over the Internet containing a source and destination address, routing instructions, data description, a checksum, and data payload. Packet handling and traffic management are governed by a complex set of rules and algorithms collectively defined as a protocol.
Different protocols are responsible for handling different aspects of traffic. Though this may seem trivial, protocols heavily affect the nature of traffic and models of traffic which may be completely valid for one protocol can be completely invalid for another. Also, protocols are used in different applications or tasks and these should inform any analysis of Internet traffic or predictive models describing its behavior.
In addition, there are levels of tasks handled by certain protocols and not others. These are broken out, traditionally into seven layers, by a model known as the Open Systems Interconnection (OSI) model. These seven layers are shown and described with examples in table 1. For analysis of packet data, the application, transport, network, and data link layer are typically the most relevant.
| Layer | Number | Description | Example Protocols |
|---|---|---|---|
| Application | 7 | Network applications such as terminal emulation and file transfer | HTTP, DNS, SMTP |
| Presentation | 6 | Formatting of data and encryption | SSL |
| Session | 5 | Establishment and maintenance of sessions | TCP sessions |
| Transport | 4 | Provision of reliable and unreliable end-to-end delivery | TCP, UDP |
| Network | 3 | Packet delivery, including routing | IP |
| Data Link | 2 | Framing of units of information and error checking | Ethernet, ATM |
| Physical | 1 | Transmission of bits on the physical hardware | 10BASE-T, SONET, DSL |
The higher layers (higher number) always initiate a lower level protocol. For example, for e-mail using the application protocol SMTP, SMTP starts a TCP connection which itself uses IP packets to deliver data.
Even within the same layers though, protocols can function much differently. By far the most well-known and widely used suite is the transport/network protocol combination TCP/IP. Transmission Control Protocol(TCP), which manages sessions between two interconnected computers, is a connection based protocol which means it has various means of checking and guaranteeing delivery of all packets. This is why it is widely used to transmit web pages using Hypertext Transfer Protocol (HTTP), email with Simple Mail Transfer Protocol (SMTP), and other widely used applications. TCP’s connectionless cousin is User Datagram Protocol (UDP). UDP sends packets without bothering to confirm a connection or receipt of packets. This can make it unreliable for delivery but much faster and more useful for real-time applications like voice over IP (VoIP). TCP will be covered in more detail and its differences elaborated later in the paper. These differences cause TCP to react to feedback in its traffic patterns and adjust its throughput based on these considerations.
2.2 Packet structure
Packets have two main parts: a data payload which contains specific data being transmitted and overhead which contains instructions about packet destination, routing, etc. Each level and protocol has a different amount of overhead as shown in table 2. Overhead usually has both a fixed and variable portion. However, for most transport and network layer protocols the fixed portion can usually be considered the size of the entire header. When dealing with the total size of packets and measuring throughput, one must be careful to specify whether or not the packet size includes overhead. Also, at the data link layer, there is a maximum frame size of 1500 bytes in most systems (minus data link layer overhead). The effect of packet size and packet size distribution will also be covered in more detail later in the paper.

| Protocol | Header Size |
|---|---|
| IP | 20 bytes for IPv4, 40 bytes for IPv6 |
| TCP | Normally 20 bytes, can be up to 60 bytes |
| UDP | 8 bytes |
| Ethernet | 14 bytes for header and 4 bytes for checksum |
2.3 Packet traffic characteristics
Larger than individual packets is the packet flow which can be statistically described using many important measures. Probably the most widely known and important are bandwidth, throughput, goodput, packet flow rate, flow, latency, packet loss, and Round Trip Time (RTT).
Bandwidth - Bandwidth is the maximum possible throughput over a link. Bandwidth, being an ideal, is almost never achieved under normal conditions but provides a convenient benchmark to compare the capacity of data links.
Throughput - Throughput is the rate of packet transmission over a network link, usually in megabits per second (Mbps) or kilobits per second (Kbps). It is the most widely recognized measure of network data speed and essential in understanding the performance of data traffic.
Goodput - Goodput is the measure of throughput excluding packet overhead. When analyzing data, one must be careful to ascertain whether traffic data is throughput or goodput. If it is goodput, the total throughput is actually larger because you have to incorporate the average packet overhead in the amount of data transferred. However, for both throughput or goodput, the packet flow rate is the same.
Packet Flow Rate - The rate of packet flow over a network link. This differs from throughput or goodput in only measuring the number of discrete packets that travel over the link, regardless of their size. Throughput and packet flow rate are related by the following equation
| (1) |
Where s is the average packet size including overhead, T is the average throughput, and is the average packet flow rate.
Session - A TCP communication dialog set up between two computers by first the delivery of a SYN packet, coordination request and (SYN+ACK) packet, and finally an ACK by the initiating party.
Flow - This flow must be carefully distinguished from the packet flow rate mentioned above. A flow in Internet traffic is defined several ways but in general is a connection between a source and destination which is continuously transmitting data. Usually, this means a connection based protocol such as TCP where a connection is made and data continuously transmitted until the connection times out or a standard inter-packet arrival time is exceeded in the “packet train” [92, 36]. Sometimes traffic instead of bytes is also measured in terms of the number of flows. The distribution of flow sizes and their properties will be covered later in the paper. Note when measuring flows using traffic auditing software such as Netflow or ARGUS, one must make sure to verify the exact method of flow measurement and make sure measurements across different systems are comparable and whether or not they match any of the theoretical definitions above.
Packet Loss - This is the percentage of all packets lost in transit. It is usually measured as the percent difference between packets transmitted in a packet flow and packets received on the other end from the same packet flow. This affects all traffic and is caused by many causes that lead to the loss of packets including congestion, physical connection problems, and other issues. It has a large effect on TCP throughput.
Round Trip Time (RTT) - The statistical average time it takes a packet to travel from a source to a destination and back. It is the most common measure of latency on computer networks. It is closely related to throughput and along with packet loss often used as a measure of link congestion.
2.4 Protocol traffic breakdown
Most prominent studies of Internet traffic have tended to be done over high traffic transit networks or links linking smaller networks, such as those at a university, to the overall Internet. Overall, TCP dominates all traffic with about 95% or more of total bytes, 85-95% of all packets and 75-85% of all flows using TCP as the transport protocol [184, 34, 104]. UDP comes second representing about 5% or less of traffic with its main function being sending DNS requests and communications. These results generally hold for the larger Internet, however, in measuring traffic protocol representation one must be careful to define whether a high traffic transit link, carrying traffic from many sources and applications, is used versus a link on an edge network closer to final users. Edge networks can have extremely particular traffic traces when there is large use of UDP for VoIP traffic or other multimedia type traffic.
TCP application traffic has generally evolved over time in three main eras characterized by the dominant types of traffic influenced by available applications and access speeds. In the Text Era (1969-1994) most TCP traffic was driven by email, file transfers, and USENET newsgroups. In 1989, Cáceres [26] at UC Berkeley characterized Internet traffic of being 80% TCP and 20% UDP by packet and 90% TCP and 10% UDP by bytes. TCP traffic bytes were split roughly evenly between SMTP for email and FTP for file transfer while UDP was mostly DNS. An updated study by Cáceres and collaborators in 1991 [27] monitored traffic at several universities again finding similar results. Once again at UC Berkeley 83% of packets were TCP, 16% were UDP, and about 1% were ICMP. UDP traffic was predominantly for DNS at 63% of its packets. TCP traffic in terms of packets was 28% telenet, 16% rlogin (Unix host login utility), 12% FTP, 12% SMTP, 12% NNTP (USENET), with the balance shared among other protocols. FTP was the largest protocol in bytes at 36% of all bytes. These dominant application level protocols were confirmed by Claffy and Polyzos as well [35].
Next was the Graphics or Hyperlink Era (1994-early 2000). After CERN made the World Wide Web free for any use in 1993, the graphics based web grew rapidly. In 2004, Paxson [155] reported that in Internet traffic though FTP, SMTP, and NNTP still held sway, HTTP was by far the fastest growing protocol growing 300-fold in traffic measured by connections in only two years and already vying to be the 2nd most popular TCP application level protocol. By 1995, WWW traffic had become the largest application level protocol with 21% of traffic by packets compared to 14% for FTP, 8% for NNTP and 6% for SMTP [71]. By 1997, Thompson, Miller, & Wilder [184] could report that HTTP dominated TCP traffic, 95% of all Internet traffic bytes at this point, with 75% of the overall bytes, up to 70% of the overall packets, and 75% of the overall flows during daytime hours. Its closest competitor, SMTP, was reduced to only 5% of packets and 5% of all bytes. The Internet was now a popular, mainly web and graphics based medium.
The current era is the Multimedia Era (early 2000-present). In this period, sharing of multimedia through P2P file sharing applications and streaming audio or video began to rival the web for dominance of Internet traffic. A Sprint study on an IP backbone in early 2000 [70] reports that P2P was already rivaling the web in terms of bytes transferred with at times P2P accounting for 80% of all traffic. Streaming also accounted for as much as 26% of all traffic as well. The web was still competitive, however, sometimes accounting for 90% of all traffic. By 2004, however, Fomenkov, et. al. [68] could report WWW traffic clearly peaked in late 1999/early 2000 and P2P had dominated traffic growth ever since. A recent April 2008 traffic trace study [19] shows the Web and P2P sharing 34% and 33% of total TCP/IP bytes respectively. However, P2P only accounts for about 3% of all flows compared to the 40% of all flows dominated by the web showing P2P flows are generally larger and more likely to be “elephant flows”. Another earlier study by the same team [54] gave similar results with Web and P2P (normal and encrypted) consisting of 41% and 38% of bytes and 56% and 4% of flows respectively.
One caveat on methodologies is necessary with more recent traffic. Though it is undisputable that multimedia and P2P type applications are carrying large amounts of traffic, identifying their exact nature based on port numbers is not always as exact as identifying HTTP traffic from port 80. There have been several methodologies created for traffic identification that use statistical measures in addition with TCP port numbers to determine traffic types. These include CoralReef (from CAIDA), BLINC[95], WEKA a suite of machine learning algorithms (from the University of Waikato, New Zealand), and graph based methods[91]. Reviews of these methodologies evaluate their relative usage and show though port numbers are still the largest factor, they are often not completely reliable due to users or software intentionally or unintentionally changing port numbers for various hardware and applications [96, 131, 100].
2.5 Topology
As mentioned before, topology is currently the most studied feature of the Internet and other computer networks by physicists. Due to the wide range and depth of research being done in this field, this paper will not present even a cursory review of its main ideas and results. Dealing with Internet traffic, however, it is important to balance the knowledgeable networking engineering perspective with the more abstract methods used by physicists. For the now widely familiar methods of physicists, the author recommends several outstanding review papers [7, 142, 45, 20, 173, 166, 154]. However, anyone measuring or analyzing network topology network must read network engineering contributions and rebuttals to many of the now standard scale-free network techniques and theories. This is usually poorly covered or not at all in the physics community. In particular, the author recommends [199, 48, 118, 119, 9, 202, 86] which tackle the power-law distribution and “robust yet fragile” nature of the Internet that physicists have theorized. A proposed alternative to general preferential attachment growth models for the Internet is given in [29, 119]. Here the authors present a growth model that optimizes growth based on business and location considerations that match real Internet growth processes.
Also in [103, 10, 121] the issues of data integrity in measuring the Internet topology are described including the errors introduced by several common methods such as traceroute and BGP router tables. Essential reading for anyone looking at this area. Finally, as a guide before claiming anything as a power law, the author urges these two excellent articles on tackling this determination in a rigorous fashion [37, 128, 130].
2.6 Packet Sizes
2.6.1 Distribution of packet sizes
Internet traffic, with its various protocols and traffic types, has many widely varying packet sizes. However, there is an upper limit to packet size and this is almost always determined at the data link layer. Various data link communications schemes, such as Ethernet or ATM, impose an upper bound on the size of transmitted packets through the hardware or operating system settings. This upper bound packet size is often designated the Maximum Transmission Unit (MTU) at the link layer.
In Ethernet, the current MTU on most systems is 1500 bytes. Packets at the data link layer are often termed frames but the idea is the same. This 1500 bytes includes the payloads and headers of all lower level protocols but does not include the Ethernet frame header and footer. Several studies on packet size distributions have shown that packet size is in general a bimodal or trimodal distribution with most packets being small (500 bytes or less) [99, 184, 46, 34, 104]. In addition, the distribution of packet sizes is not a smooth long-tailed distribution in that some packet sizes can predominate due to system defaults.
For example, [99, 184] describe that there are peaks in the frequency distribution for packet sizes. In a traces of data over a day or longer on a data link, they explain many reasons for the small packet size. First, for TCP systems there is a protocol option for “MTU discovery” that tries to find the MTU of the network in order to make packets as large as possible. If MTU discovery isn’t implemented, TCP often defaults to an MTU of 552 or 576 bytes. Also, nearly half of the packets are 40-44 bytes in length. These packets are used by TCP in control communications such as SYN or ACK traffic to maintain the connection between the source and destination systems. At 576 bytes [99] the packet size increases linearly to 1500 bytes showing that packet sizes in the intermediate region are relatively equally distributed. In general, according to [184, 34, 104] about 50% of the packets are 40-44 bytes, 20% are 552 or 576 bytes, and 15% are 1500 bytes. Table 3 shows the distributions of packet sizes from a traffic trace and fit well with the studies except the absence of a strong peak in the 552 or 576 byte range.
| Packet Size Range | ALL | TCP | UDP |
|---|---|---|---|
| 0-19 | 0% | 0% | 0% |
| 20-39 | 2% | 0% | 0% |
| 40-79 | 59% | 69% | 19% |
| 80-159 | 7% | 2% | 23% |
| 160-319 | 3% | 1% | 15% |
| 320-639 | 7% | 3% | 34% |
| 640-1279 | 3% | 3% | 6% |
| 1280-2559 | 18% | 22% | 4% |
Kushida [104], despite being one of the only papers that looks at packet size distribution among UDP separately, clarifies that since 98.2% of the traffic measured in the paper is TCP, the UDP contribution to overall IP and Internet traffic packet size distribution should be considered negligible. Using a different measurement for packet size distribution, that looks at the ratio of packet size*number of packets versus the total traffic measured, Kushida finds a series of peaks between 75 and 81 bytes and another large peak at 740 bytes. None of these peaks are substantial, however, and no size of packet reaches even 10% of the total. Since UDP has no connection based features such as TCP, the reason for these peaks is not inherent in the protocol itself. UDP is mainly used for Domain Name Server (DNS) and Simple Network Management Protocol (SNMP; a network monitoring protocol) and applications related to these functions drive the size of the UDP packets.
Finally, there is often an asymmetry in packet size for both directions in a flow. For example, if a web page is being served to a PC, the PC will be receiving large TCP packets with HTTP (WWW) data while it will only be sending comparatively smaller packets as data requests back. Packet size also has diurnal variations where it can be larger during daytime hours and in international links, [99] showed that the average packet size on both directions of the link oscillated out of phase by about 11 hours (2.9 radians).
Does packet size or MTU matter? Absolutely, in fact many network engineers realize that average packet size and MTU are critical factors in determining the overall maximum throughput in a network. Recalling equation 1, for a fixed throughput, decreasing the packet size increases the packet flow rate. Oftentimes, many believe that the key throttle in computer network throughput is its stated bandwidth. In fact, bandwidth bottlenecks are rarely the bottleneck on network performance. Computer network hardware typically has a maximum packet flow rate it can effectively handle, afterwards packets begin forming queues in the hardware buffer and congestion reduces throughput. Smith, in [170] showed how on a normal Ethernet link between two computers, the maximum throughput across varying packet sizes exhibited a transcritical bifurcation.
In fact, one problem currently plaguing next generation high speed networks is outdated, smaller MTUs on the systems of their users. Therefore, in order to take advantage of the increasing bandwidth capabilities of the Internet, there is a concerted push in some corners to raised the typical MTU above the normal Ethernet 1500 bytes, up to 9000 bytes where possible, to allow more rapid communication. There will need to be larger studies on network hardware such as routers to understand how the MTU completely affects throughput and whether the bifurcating behavior is present for saturated links in the Internet at large.
2.7 Flow Size Structure and Distribution
2.7.1 Definition and nature of flows
As mentioned in the definition of an Internet flow, a flow is defined as continuous communication between a source and destination system. Flows are typically described by one of two definitions: an identifiable clustering of packets arriving at a link or by identifying characteristics such as the source and destination addresses along with an identifying label such as a TCP session ID or an IPv6 flow label.
For the first definition, the most widely used definition was given by Jain and Routher in 1986 [92] while studying data on a token ring network at MIT. While also noting that the interpacket arrival rate is neither a Poisson or compound Poisson distribution, they defined individual flows as “packet trains” where a packet train is defined as a sequence of packets whose interarrival times are all less than a chosen maximum interarrival gap, usually determined by system software and hardware configurations. If a packet is received after a longer interval than the maximum gap, it is considered part of a new flow. This brings up one important characteristic of Internet flows: though they obviously have a time average, they are extremely bursty and inhomogeneous compared to most other types of flows studied in physics.
For the second method, the first and still likely most widely used method of identifying flows via address or label is using TCP packets. TCP flows start with a SYN packet and end with a FIN packet. Therefore matching SYN and FIN packets with source and destination IP addresses and session ID in the TCP headers are often used to define flows. Another elaborate definition was presented by Claffy et. al. [36] who represent a flow as active if there is interpacket time less than a maximum value and distinguish flows by a group of packets identified by aspects including source/destination pairs, unidirectional nature (flows in only one direction), protocols used, and other factors that may distinguish the packet destinations.
The new next generation Internet Protocol, IPv6, though not yet implemented widely beyond a now defunct test network called 6Bone, has been designed with a part of its header overhead reserved for a “flow label”. This flow label would allow the traffic source to provide a unique identifier that would clearly distinguish IP traffic flows. Besides improvements in routing and traffic management, this will allow more accurate research as IPv6 is implemented throughout the Internet.
2.7.2 Distributions of flow characteristics
Early in the paper, it was mentioned that long-tail behavior is present in Internet traffic to the same extent as it is in the topology. Flows are no exception and several quantities used to describe flows have long-tail distributions. In particular, the distributions of sizes in terms of data transferred, duration in terms of length of the flow, and data rate of flows have all been found to exhibit long-tail distributions.
These flows have been given certain names throughout the literature which are summarized by Lan and Heidemann [111]. Flow sizes are divided into two classes: “elephants” and “mice “where elephants are a small part of all flows measured over a certain time but account for a large number of the bytes transferred while many other flows account for proportionally smaller components of the overall traffic (the mice). Elephant flows have been described in detail in several papers [111, 56, 58, 110, 136, 147], in particular in a paper by Mori et. al. describes a traffic trace where elephant flows are only 4.7% of all flows measured but 41% of all traffic during the period. Barthélemy et. al., [18] give a related result studying routers on the French Renater scientific network. They conclusively find that a small number of routers (a so-called ’spanning network’) submit the vast majority of data on the network while the contribution of the other routers is exponentially smaller.
Elephant flows, though agreed upon in principle, have been defined differently in many papers. Estan [56] defined an elephant flow as a flow that accounts for at least 1% of total traffic in a time period. Papagiannaki [147] uses flow duration to classify elephant flows. Lan and Heidemann [111, 110] use a statistical definition where a flow is considered an elephant flow if the amount of data it transmits is at least equal to the mean plus three standard deviations of flow size during a period. This is 152kB in their paper. This final definition implicit assumes the scaling exponent among flow sizes, is at least 2, since the variance for the distribution is infinite if .
In figure 3, the author has used data from the WIDE MAWI [125] traffic trace archive which measured the daily traffic over a T-1 line between Japan and the Western US to show the relative proportion of all traffic the top 10 flows represented over time from 2001-2007. The upward tick in mid-2006 reflects the upgrading of the data link speed from 100Mbps to 1Gbps. The % of all traffic captured by the top 10 flows declines over time as the number of overall flows per day increases and the top 10 occupy a declining share of the number of flows.

Research from Mori et. al. [136] also gives evidence that elephant flows not only occupy disproportionate amounts of traffic but they are also more likely than mice to be responsible for congestion in links.
The duration of flows has been classified with similar zoological flair. Most flows have a relatively short duration while a small number of flows have a comparatively very long duration. Brownlee and Claffy [24] analyzed duration among Internet streams, which are individual IP sessions versus one way flows of packets typifying flows. About 45% of streams were of a very short duration, less than 2 seconds, and were termed “dragonflies”. Short streams were defined has having a duration from 2s to 15 minutes and consisted of another 53% of all flows. “Tortoises” were flows with a duration greater than 15 minutes and accounted for 1-2% of all streams but 50% of all bytes transferred. The dragonfly/tortoise definition is simplified and extended to flows in [111] where a dragonfly is a flow less than the mean flow duration plus three standard deviations which is 12 minutes in their paper. They find 70% of all Internet flows are less than 10 seconds.
Lan and Heidemann [111] also introduce a new measure of flow, “cheetahs” and “snails” to characterize the distribution of throughput in flows. Cheetahs are flows with an average throughput greater than the mean plus three standard deviations. Their dividing throughput is 101 kB/s in the paper. According to their measurements, about 80% of Internet flows have a throughput of less than 10 kB/s.
These different types of measurements on flows are obviously not independent and in fact are heavily correlated in several ways. Cheetahs tend to be high throughput but small in size and short in duration Zhang [18] previously showed a correlation between flow size and rate and Lan and Heidemann [111] confirm this showing 95% of cheetah flows are dragonflies with a duration of less than 1 second. 70% of cheetah flows are also smaller than 10 kB. Elephant flows tend to be large in size and duration but low in throughput. Only 30% of elephant flows in [111] are faster than 10 kB/s and 5% are faster than 100 kB/s. 50% of elephant flows lasted longer than 2 minutes and 20% of elephant flows lasted at least 15 minutes.
Different flow types are also dominated by different types of traffic. Elephants seem to be mostly web and P2P traffic while Tortoises are mostly DNS. Cheetahs have by far mostly web and DNS traffic. This leads to the question as to the causes of bursty flows (as differentiated from bursty overall traffic described in the section on self-similarity). TCP mechanisms, described in the next section, could cause the burstiness of some flows, however, it could also be driven by the bursty data requests from user applications such as interactive applications like MMORPGs.
The granularity and nuance in the characteristics of flows is an interesting theoretical and practical challenge for those studying Internet dynamics. But it still gets even better as our next section on the dynamics of TCP traffic demonstrates.
| Category | Large-size | Long-lived | Fast | Bursty |
|---|---|---|---|---|
| Elephant | Y | Y | N | N |
| Tortoise | N | Y | N | N |
| Cheetah | N | N | Y | Y |
3 Explanation and Mechanics of TCP
Now that we understand the basics of packet traffic, we can dig more deeply into one of the key functions of the Internet: connection based packet delivery through TCP. As stated earlier, TCP by far is the bulk of Internet traffic. Therefore, any discussion on Internet traffic is by and large a discussion of TCP/IP traffic. TCP is a connection based protocol and relies on several programmed algorithms to manage and guarantee the delivery of packet traffic. The fact is, however, TCP was developed when the Internet was relatively small. Though it is still useful and efficient, the large-scale macroscopic effects of its operation were not easily predictable and were only measured or derived later.
Volumes of articles have been written on TCP behavior, possible algorithmic improvements, and traffic management. TCP has several features including buffering and congestion control that allow it to be one of the only Internet protocols that uses feedback to adjust protocol performance. Nonlinear effects combined with feedback have been well-known to produce complex systems phenomena and TCP is no exception. In this section, TCP’s basic mechanisms will be defined and explained and then linked with the most common theories of network performance and congestion.
3.1 A short explanation of TCP
There are many good guides on TCP, but most information in this paper is taken from an IBM guide [152]. TCP relies on several key features which are necessary to ensure reliable and smooth delivery of packets between the source and receiver. The TCP connection starts out with a “three-way handshake” which consists of one SYN (synchronize) and two ACK (acknowledge) packets. TCP flows are based on the concepts of windows and flow control. When packets are transmitted they are given sequence numbers to determine the correct order of data transmission. The source then waits to receive and ACK packets before transmitting additional packets.
The number of packets a source can transmit before needing to receive at least one ACK packet is the window. When a TCP connection is initiated and as it continues, the receiver sends an ACK packet which lets the source know the highest sequence number it is able to accept given buffer memory and system constraints. The source then sends the number of packets to fit that window and waits for an ACK. For every packet confirmed, an additional one is sent and the window size is maintained. The window size can be changed by the receiver in every ACK packet by varying the highest sequence number it can receive so the window often varies over the course of a transmission. If an ACK for a packet is not received within a timeout period, TCP considers the unacknowledged packets lost and retransmits them.
Because of the possible need for retransmission, TCP must buffer all data that has been sent but has not received an ACK. The size of this buffer at the sender is usually calculated by the bandwidth delay product which is the product of the link bandwidth and the RTT. Therefore, for high bandwidth links or long RTT links, the buffer can become increasingly large and burdensome on the operating system.
3.2 Congestion control

Congestion control is one of the most prominent and differentiating aspects of TCP as compared to UDP and any other transport level protocol. Flow control uses ACK feedback to coordinate smooth transmission between the sender and receiver and congestion control uses feedback from the network throughput environment to adjust the sender rate in order to not cause network congestion. Thus Internet traffic, which is largely TCP/IP, behaves in part as a massive closed loop feedback system between the transmission throughputs of multiple senders which are modified by the measured traffic congestion environment. This has doubtlessly led to much research in self-organization in TCP traffic which will be discussed later.
The congestion control algorithm is not uniform across all TCP software implementations and has various flavors named after resort cities in Nevada including Vegas, Reno, and Tahoe. All implementations though essentially share four general features: slow start, congestion avoidance, fast recovery (not in Tahoe), and fast retransmit.
Slow start is used to address the inherent problem that regardless of what TCP window the receiver advertises in its ACK packets, the network still may be so slow or congested in points as to not be able to handle that many packets transmitted over such a short time. Slow start handles this by overlaying another window over the TCP window called the congestion window (cwnd). At first, this window starts at one packet and tests to see if an ACK is received. If so, the congestion window grows to two, waits for two ACKs, and then grows to 4, increasing by powers of two at each successful step. This occurs until the window is the maximum size advertised by the receiver. Afterwards, the receiver’s window size can increase by one segment per ACK successfully received. The sender will eventually use the smaller of the congestion window or the window advertised by the receiver as the TCP window. This insures that if the receiver’s window is too large for current network performance, the congestion window will compensate. Slow start has a threshold though which is the maximum size possible for any congestion window.
Congestion avoidance works in tandem with slow start. Congestion avoidance assumes that any packet loss (packet loss is normally assumed to be much less than 1%) signals network congestion. As stated earlier, this is not necessarily true as hardware or network issues which cause lost or dropped packets and aggressive “crowding out” by large flows of aggressive connectionless protocols like UDP can also generate this effect. The connection measures packet loss by a timeout or duplicate ACK packets. If congestion is detected, congestion avoidance slows down the TCP connection by setting the slow start threshold to one half of the current congestion window, the so-called exponential backoff. If a timeout caused the congestion, the congestion window is “reset” down to one packet and slow start repeats. Slow start increases the window size to the new slow start threshold and then congestion avoidance takes control of the congestion window size. Instead of increasing the window size in an exponential manner, congestion avoidance increases it in increments with every ACK received according to the following equation
| (2) |
where the segment size is the size in bytes of data TCP fits into each packet. Therefore the congestion window increases linearly controlled by the congestion window algorithm.
Fast retransmit is where TCP uses the number of duplicate ACKs received to determine whether a packet was received out of order at the receiver or likely dropped. If three or more duplicate ACKs are received it assumes the packet was lost and retransmits it. This prevents TCP from having to wait the entire timeout period before retransmitting. Since fast retransmit is based on the assumption of a lost packet, congestion avoidance comes into play. However, fast recovery takes over in the situation where fast retransmit is used and allows the TCP window to not decrease all the way to one and restart using slow start but by setting the threshold to one half of the congestion window size and starting the congestion window size at the threshold size + 3 x segment size. The congestion window then increases by one segment for each additional ACK.
3.3 TCP macroscopic behavior
The intricacies of the operation of TCP have lead to much research characterizing the protocol’s average or expected performance and its influence on the overall traffic patterns of the Internet. One of the best-known and widely reported results is a famous equation for the maximum possible throughput for a TCP connection developed in early versions by Floyd [65] and Lankshman & Madhow [109] and in a most widely known version by Mathis, Semke, and Madhavi [123]. They explore the expected performance of TCP against a background of random, but constant probability, packet loss given the window resizing by the congestion avoidance backoff mechanism. Their famous result (often called the SQRT model) is for the theoretical maximum throughput for a TCP connection and is given by
| (3) |
where is the maximum segment size, typically defined by the operating system for TCP and is usually 1460 bytes [160], is packet loss percentage, and is a constant which varies based on assumptions of periodic or random period loss and the handling of ACK by a congestion avoidance algorithm. Since C is usually less than 1 the equation can be simplified to
| (4) |
This equation assumes packet loss is handled by congestion avoidance and determined by receiving duplicate ACK packets, not packet loss via timeouts. Though this is the most famous and widely used equation, a more accurate one, especially when was introduced by Padhye, Firoiu, Towsley, and Kurose [146]. This equation, based on a version of TCP Reno, also incorporates packet loss due to timeouts which is more realistic for higher packet loss situations. Their equation yields an approximation for throughput where
| (5) |
This equation is also known as the PFTK equation. Here is once again packet loss, is the maximum window size advertised by the receiver, is the number of packets acknowledged by each ACK (usually 2), and is the initial timeout value.
In [146] the authors compared the fit to their equation versus the SQRT equation for real data and state PFTK fits better. A more complete analysis and comparison was conducted by El Khayat, Geurts, and Leduc [53]. They note both equations neglect slow start which makes them inappropriate for very short TCP flows and the equations also neglect fast recovery. To test the models they generated thousands of random networks with random graph topologies where the number of nodes (10 - 600) was chosen at random and the bandwidth (56 kbps - 100 Mbps) and the delay (0.1ms -500ms) were chosen randomly for each link. They then tested the TCP throughput on these virtual networks versus both equations and made comparisons using the mean squared error, , the over/under estimation ratio of average calculated throughput to actual throughput, and an absolute ratio which takes the larger of the first ratio or its inverse. For all metrics, the PFTK equation performed better but was still a poor predictor of actual TCP performance giving incorrect estimates roughly 70% of the time.
In addition to measuring the current macroscopic behavior of TCP, there are many studies attempting to model the behavior of TCP flows under alternate congestion management paradigms. The most prominent of these is TCP/RED (Random Early Detection), first proposed by Sally Floyd [66]. TCP/RED actively manages the router queue by increasing the probability of a router deliberately dropping a packet as the queue buffer becomes increasingly full in order to better manage congestion. There are several papers [159, 120, 127] that state large-scale traffic patterns such as chaos or oscillations could be induced but these are still mostly based on theory or simulation.
4 Packet Arrival Times - Self-Similarity, Long Range Dependence, and Multifractals
4.1 Self-similar traffic and long range dependence
One of the most widely researched and discussed characteristics of Internet data traffic among both the computer science and physics communities is the self-similar nature of Internet packet arrival times. Interestingly enough, the trajectory of research on this begins with a shattering of simplistic preconceptions about network traffic similar to that of Faloutsos and Barabási and Albert regarding Internet topology random graph models. Like pre-Barabási/Albert theory assumed all telecommunications networks, including the Internet, were random graphs, early research in Internet traffic regarded packet arrival times as based on a Poisson (Erlang-1) or Erlang-k distribution similar to that in telephone switching and call center traffic [201]. The first cracks in this were a paper by Leland and Wilson [115] which showed packet interarrival times that seemed to exhibit both diurnal fluctuations and did not seem to adhere to a Poisson distribution. The second paper by Leland, Wilson, Taqqu, and Willinger [116] thoroughly and convincingly debunked the theory of Poisson arrival of packets in Internet traffic and using rigorous statistics showed that Internet traffic had self-similar characteristics and correlations over long time scales (long-range dependence or LRD). Like degree distributions in scale-free topologies, the packet arrival per unit time exhibited long-tail distributions where large bursts of traffic were not isolated and extremely rare statistical coincidences but par for the course over all time scales. The studies were based on four captures of data over four years. The traffic traces, taken at the former AT&T Bellcore research facility, varied from 20 to 48 hours in length and recorded the timestamps of hundreds of millions of packets.
The authors are also the first to describe Internet traffic as having a fractal character. This research has since been confirmed in a torrent of papers which are too numerous to describe. Paxson and Floyd [157] confirmed the failure of Poisson modeling in long-tail traffic behavior in Wide Area Network (WAN) data in several protocols including TCP, FTP, and Telnet. Crovella and Bestavros [41] demonstrated long-tail distributions in WWW traffic including packet interarrival times, file download size distributions, file download transmission time distributions, and URL request interarrival times. Other papers have essentially confirmed in most cases that long-range dependence is a key feature of Internet packet traffic.
4.2 Measuring self-similarity and long range dependence
There are several good review articles detailing the mathematical techniques used to investigate self-similar processes in network traffic [149, 94, 199, 55, 162, 3, 198, 201]. Here we will cover the most prevalent and important ones.
The simplest definition for self-similarity assumes that for a continuous time process, , for scaling the time by a factor ,
| (6) |
where is the Hurst exponent and takes a value between 0 and 1 for self-similar processes. For a self-similar process that exhibits long-range dependence, is between 1/2 and 1. This definition, like most other for self-similarity, implicitly assumes a stationary process.
The most accepted and widely used definitions are termed the so-called first-order and second-order similarity. First order similarity is based on the autocorrelation of the traffic trace. Assuming a traffic trace is defined as a stationary stochastic process with a set of values at time steps t:
| (7) |
and the autocorrelation function, , is defined as
| (8) |
Where is the mean and is the variance of the traffic. The self-similar behavior is manifested in that the behavior of the autocorrelation function is not one which exponentially decays with time as with a short range dependent time series but rather exhibits a power law behavior
| (9) |
Where is a positive constant and the approximation symbol indicates this behavior is the asymptotic behavior of the system as . Fitting a linear regression to an autocorrelation or autocovariance plot should not be considered a rigorous or best practice method of determining self-similarity and the Hurst exponent. There are various other tools, with shortfalls as well, that are best used to make an accurate determination.
Second order similarity/aggregated variance analysis
Second order similarity is defined as taking the original time series and recreating it for different time “windows” where all time values in the series in windows of length are averaged. For example, the new time steps become . Second order similarity, also known as aggregated variance analysis, is formally defined as taking the new time series
| (10) |
for all . The time series is called exactly self-similar if the variance of and
| (11) |
For a normal independent and identically distributed time series the variance would behave as . With self-similarity it decays much more slowly given the range of . The time series is called asymptotically self-similar if the autocorrelation function of the new time series for large k behaves as
| (12) |
For both definitions of self-similarity, the Hurst exponent can be derived from the value of according to the equation . This confines the Hurst exponent to values of between 1/2 and 1 for a self-similar system. Note = 1/2 exponent is identical to that of random Brownian motion and = 1 reflects complete self-similarity. In most studies, is estimated to be around 0.8 in most types of Internet traffic. The results from the data trace analyzed by the author in figure 5 give a Hurst exponent of 0.81.
One must take care to differentiate two similar but not identical aspects of Internet traffic: self-similarity, just defined above, and long-range dependence. Long-range dependence is defined as a system where the autocorrelation function behaves as
| (13) |
when for self-similar traffic long-range dependence is implied but in other conditions you can have long-range dependence but not self-similarity as long as equation 13 is satisfied. Long-range dependence is also called persistence and is contrasted by short-range dependence (SRD) which manifests in processes where . LRD also depends on an assumption of stationarity in traffic which is reasonable on timescales of minutes to hours but is less useful over large timescales due to diurnal traffic variations and long-term trends.
R/S Statistic
Again, we separate the time series into equal blocks of length except all values in each block are aggregated by simple summation. Define as and define the range as the difference between the value of the largest block and the smallest block. Define as the standard deviation of the values of the blocks. The ratio should scale with such that
| (14) |
Note that one problem with both the R/S and other methods such as aggregated variance is choosing the right range for the sizes of the blocks [38]. Choosing values of that are too small makes short term correlations dominate, while a large has fewer blocks and gives a less accurate estimate of . One approach created to deal with this issue is wavelet analysis of the logscale diagram which is covered in the next section on wavelet methods.
Periodogram
An additional test for long-range dependence is the presence of noise in the spectral density of the time signal at low frequencies. The exponent of noise is related to as well where where is a constant (unrelated to previous ones), is the frequency and and .
Often, the spectral density, is estimated as
| (15) |
Whose log-log plot slope should be close to near the origin.
Scaling of Moments
In [183], the authors use the fact that the moments scale with the length of the time series to identify self-similarity. Define the absolute moment as
| (16) |
The absolute moment scales as
| (17) |
Where .
An excellent guide to measuring the Hurst parameter can be found in [38]. Though the Hurst exponent is well-defined mathematically, in practice all measurements of it are only estimations and different techniques, software, or noisy data sets can produce varying estimates. Even on artificially generated data with a known Hurst exponent, the different techniques had divergent measurements of the Hurst exponent and the R/S statistic performed poorly underestimating on both generated and real data.
Many may realize that in all of this discussion of self-similarity and fractals the fractal dimension has not been mentioned once. The omission is purposeful and due to the convention that almost without exception, the Hurst exponent is used as the measure of self-similarity in data traffic research. In any case, the conversion is not difficult since the fractal dimension of the time series is related to the Hurst exponent by
| (18) |
Given equation 18 we can see that the typical fractal dimension of data traffic is around 1.2.
Nonstationary data methods
As noted earlier, the previous techniques to measure self-similarity implicitly assume a stationary signal, however, this is definitely not the case in Internet traffic where on longer time scales, non-stationarity due to periodicities such as daily usage patterns and growth in traffic over time make the traffic data nonstationary.
A commonly used method of measuring long-range correlations and self-similarity in nonstationary time series traffic is the use of detrended fluctuation analysis (DFA), an approach adopted independently in several papers [114, 174, 217]. DFA was first used to measure the long-range correlations in non-coding regions of DNA and is often used to measure correlations among fluctuations in physiological or financial time series. In short, DFA is a modified RMS which calculated the deviation from a trend and long-range correlation in a time series. To use DFA for a time series of length , first calculate the profile given by
| (19) |
where
| (20) |
The next step involves separating the signal into equal sized non-overlapping segments. In each segment, use least squares regression to find the local linear trend in the segment and then calculate the detrended profile of the signal, where
| (21) |
and finally the detrended rms is calculated as
| (22) |
If the signal has long-range dependence from a spectrum, will scale with as
| (23) |
is related to the exponent of the signal by , which superficially makes it identical to the Hurst exponent. Give the RMS, the measured is a second order measurement of the power law scaling. The Hurst exponent is most simply extracted by taking the mean value of .
DFA is not the only method for analyzing nonstationary time series and as some recent studies conclude, is neither always accurate nor optimum for analyzing nonstationary trended processes. In [16] it is mathematically shown that for trended processes DFA estimates for the Hurst exponent do not converge to an accurate value and the wavelet method (next section) is recommended instead to measure the Hurst exponent. Therefore, estimates of from papers using the DFA method should be viewed with skepticism and tested against other methods.
4.3 Wavelet methods
The final methods usually used to measure self-similarity are wavelet methods and are often the preferred method for nonstationary data. In [62, 2, 61, 78, 185], the logscale diagram method of interpreting Internet traffic is described. A logscale diagram is created using discrete wavelet analysis of the signal, where the signal, , is represented as filtered through a wavelet defined given a timescale and time instant as
| (24) |
A typical wavelet used in the analyses of these discrete wavelets is the Haar wavelet. Applying the wavelet transform the signal can be represented as
| (25) |
Where are called the scaling coefficients, is called the scaling function, and are called the wavelet coefficients. Wavelet theory will not be covered in great detail here due to its complexity, however, there are several useful guides [158, 143, 93] to the subject. Each scale increment represents a scaling of the timescale of an order and is commonly termed the octave. In addition, in [2] it is shown for a stationary, self-similar process that the expectation of the energy that lies around a given bandwidth around the frequency where, is the sampling frequency is
| (26) |
Where are the wavelet coefficients of octave and is the number of wavelet coefficients in the octave . Graphing the log of versus the octave , gives a logscale diagram, an example of which is the bottom graph in figure 5. In addition, is also related to the sampling frequency and the Hurst exponent:
| (27) |
So the logarithm of the expected energy is directly proportional to the Hurst exponent. In fact, monofractal behavior is indicated by a linear dependence of over multiple octaves. The different scaling regimes can be seen in figure 5 by noting how the curve varies over the octaves 2 to 4 and 8 to 12. There are two important procedures when using logscale diagrams is to always represent the confidence intervals (usually 95%) for the wavelet coefficient values in each octave. Second, one must make sure to use a minimum variance unbiased estimator instead of least squares regression fitting when estimating from linear trends between at least three octaves. Appropriate methods for calculating this estimator as well as its variance can be found in [4, 5].
The second, and often considered more rigorous, method of looking at changing self-similarity using wavelets is looking at the scaling of the partition function for each moment of order over each octave where the partition function is defined as
| (28) |
The scaling behavior, besides being seen by graphing vs. is encapsulated using what is called the structure function
| (29) |
if the traffic is exactly self-similar with Hurst exponent, , then for each , . When more than one scaling behavior is in the signal, is no longer linear, but concave and each scaling exponent contributes to its value roughly according to its relative strength in the signal at the relative timescale. For details see [62, 185]
There have been some theories of self-similar behavior in Internet traffic by traffic engineers. This thesis was first broached and analyzed in [161]. In short, it is believed that self-similarity is generated on long timescales by user and application needs (see next section on the ON/OFF model) but on shorter timescales the picture is much less clear. It is possible that a different self-similarity affected by network or TCP congestion control considerations is active in this region. Early papers tried to explain multifractal properties of traffic by a process known as multiplicative cascades or conservative cascades [62, 78, 76]. The cascade is mathematically defined as a mass equally distributed over the interval where the mass is broken up into two new masses, one with mass and the other with mass , where is a fraction of mass defined for the process, and these two new pieces are broken up again according to the same process ad infinitum. The multiplicative cascade model was rationalized in the relation to Internet traffic by describing the encapsulating of flows into packets and the fragmentation of these packets at the link layer as a conservative cascade process where the total transmitted data is conserved but broken down into many different packets. Since this process occurs over relatively short time scales, it is given as additional evidence for the cause behind the different scaling at shorter time scales.
Many questions about the multifractal paradigm, however, were raised in [186] which openly criticized some of these claims and questioned whether multifractal models are necessary and as proven as they purport to be. In particular, Veitch, Hohn, & Abry, while analyzing some of the most common data traces used in Internet traffic studies, raise questions about the rigor of the statistical tests used such as logscale diagrams without confidence intervals and the large size of these confidence intervals for some values of the energy at higher octaves. They also raise the point that these tests rely on an assumption of stationarity in Internet traffic which may not always be a valid assumption, especially over longer timescales. In the end, they do not completely rule out multifractals, however, they raise the point that current statistical tools are not yet fully developed enough to give a definite answer to existence of multifractals. Similar comments are made in [200] declaring that multifractal patterns may exists but are not to be seen as an end in themselves and any new model of multifractality must be matched with a feasible mechanism.
Self-similarity and long-range dependence account for the “bursty” behavior of Internet traffic at all time scales. Unlike telephone traffic, which is Poisson and large spikes are rare deviations from a mean traffic level and have an exponentially decreasing probability, burstiness in Internet traffic at almost all-scales has a non-vanishing probability. This makes traffic management schemes and infrastructure planning much more difficult from a statistical standpoint. Sometimes, a scheme known as “small buffers, high bandwidth” [149] is advanced to deal with bursty traffic to avoid trying to create massive buffers to handle bursts of traffic. However, there is not yet an easy answer to managing Internet traffic, especially one with practical use.
 |
 |
 |
 |
 |
5 Theories on the causes of self-similar traffic
Once self-similarity was demonstrated in Internet traffic, the next logical step was to look for the cause. Besides Internet topology models, this is where most of the tension between the different fields has developed and caused clashes of theories and methodology. Though some consider the question controversial and unresolved, there are some models which currently have a greater weight of evidence behind them as checked against real-world traffic. There are three main theories which will be discussed at length throughout the rest of the paper.
5.1 Application Layer Cause: Long-tail ON/OFF sources
First, there is the most widely known, and only empirically validated, application layer theory which states that self-similar traffic is the cause of the behavior or users. This was first elaborated in [196, 197]. This theory models the traffic on the Internet as large number of ON/OFF sources with identical duration distributions, an idea earlier broached by Mandelbrot [122]. The ON/OFF sources, which reflect flows, are superimposed traffic sources that alternate in ON and OFF periods according to a power-law distribution. Though this is not usually explicitly mentioned, this model is extremely close to modeling a large number of flows with long-tails dominated by a few elephant flows found in actual traffic measurements. In [196, 197] they give evidence both from theory and observation that many superimposed ON/OFF sources behave to a limit as fractional Brownian motion and can account for the self-similarity seen in overall Internet traffic. Specifically, the Hurst exponent of the traffic of the superimposed is calculated by
| (30) |
where and are the power law exponents of the ON and OFF distribution times respectively. ON/OFF flows with long-tail duration are not merely a theoretical abstraction but have a basis in the access of files over the Internet. Internet file sizes have been shown by several studies [14, 47, 79, 129] to be at least long-tailed though there is dispute over whether the distribution more closely fits a power law, lognormal, or double Pareto.
Crovella & Bestavros and Crovella, Park & Kim [151, 41, 150] extend the model to explain the self-similar nature of TCP and web traffic. They base their studies on long-tailed file sizes with a power-law exponent of about 1.2 (implying a Hurst exponent of about 0.9 from equation 30). They also found that in general, reducing the tail of the file length distribution by increasing the power-law exponent, lowers the Hurst exponent as expected in [196, 197]. This theory of ON/OFF sources, and its variants, has become the most dominant explanation for self-similar network traffic in most network engineering papers and has the largest theoretical and empirical backing. It also is a frequently used model for simulating data traffic in Internet simulations.
The second theory, discussed more in detail in the next section, considers origins of the self-similar traffic at the transport layer. In particular, it looks at possible effects the TCP congestion control algorithms may have on network traffic given the feedback and collective behavior it can engender among multiple traffic sources over the same path. The third main theory, discussed in the section on phase transition models of traffic congestion is that which connects self-similarity to critical phenomena in data traffic near the transition point from free flow to congested traffic. This is the model currently most favored amongst physicists and underlines many of the models of data traffic that will be described later. In addition to describing these models, the insights and flaws of each will be described in detail.
5.2 Transport Layer Cause: TCP Congestion Control
As discussed earlier, there has been interest in whether self-similar traffic can find its causes in the congestion control of TCP rather than at the application level. This has not been a generally accepted or verified cause or contributor to self-similarity, at least on long time-scales. Veres and Boda [187] first brought up the conjecture that since the assumption TCP stochasticity or predictable periodicity itself in these equations is highly flawed, TCP throughput then cannot be reduced to a closed form equation, and that TCP instead exhibits deterministic and chaotic behavior. In addition, most analyses look at TCP only at the single link level instead of treating it as a network dependent entity given congestion control. They based their papers on simulations that showed self-similarity, sensitivity to initial conditions, strange attractors, and stable periodic orbits appeared. Fekete and Vatay [60] also used simulations to show that the interaction of TCP with buffers in routers can also cause chaotic behavior in the TCP flows. They simulated the interaction of different TCP flows with a buffer that had the capacity to hold a fixed number of packets. They show that the backoff algorithm of TCP caused by lost packets can cause power-law behavior in packet interarrival times and chaotic dynamics given the (buffer length)/( of TCP packets) ratio is below a critical value of 3.
Similarly, Hagà et. al. [82] used simulations to recreate self-similar traffic and long-range dependence by the interactions of multiple TCP flows at a buffer on a central router connecting three different hosts. They assume an effective loss packet loss rate (real packet losses and RTT exceeding the allowable timeout period) but have an infinite sized router buffer so there is no real packet loss but a large effective packet loss due to timeouts. This model can produce self-similar traffic with = 0.89 without any assumptions of ON/OFF distributions or file sizes beyond a constant TCP flow size of 1000 packets. The only extra assumption is stochastic source and destination of TCP flows among the three hosts.
These methods, particularly relying on simulations or analytical reasoning and not actual Internet traffic trace methods, have been heavily criticized, especially by those favoring an application layer explanation for self-similarity. In [63, 64], a more comprehensive TCP model is developed accounting for both the backoff phase and congestion avoidance phase after slow start. Their argument is that TCP can possibly generate correlation structure and possibly self-similarity but only short timescales (up to 1024xRTT for high packet loss) and not arbitrarily long time scales which characterize most self-similar traffic. Their models shows that at low packet loss rates the correlation structure is dominated by congestion avoidance after slow start while the exponential backoff governs the correlation structure at high loss rates. In [81], the authors focus on short TCP flows and thus only model slow start and backoff. They again show self-similarity at large enough packet loss rates but though the long-range dependence that is also present would connote infinite variance, the TCP based self-similarity only extends over certain short timescales. Thus the authors dub this self-similarity pseudo self-similarity since its timescale is relatively limited. Veres et. al. answer these criticisms in [188]. Here they concede that though TCP’s congestion control may not by itself be the cause of LRD in Internet traffic, they show through data, simulation, and mathematical arguments that TCP’s congestion control suite may propagate self-similar traffic along its path if it encounters a bottleneck that limits its send rate and has self-similar traffic. Therefore even if TCP can’t create the full self-similar effect, it may be responsible for propagating the self-similarity far beyond the traffic it originated at.
In a variation of the above research, Sikdar and Vastola [169, 168] give a model where self-similarity and long-range dependence emerge from the dynamics of a single TCP flow instead of multiple flows. They model a single TCP flow as the superposition of ON/OFF processes where is the maximum window size advertised by the receiver. This is similar to the earlier ON/OFF model but they show that for higher packet loss rates, a higher Hurst exponent and more self-similar traffic is generated. In addition, there are other papers detailing possible mechanisms by which TCP congestion control can give rise to self-similarity in Internet traffic.
In the end, TCP congestion control has not emerged as a favored cause of self-similar traffic. Perhaps it is a strong or even dominant factor of self-similarity at relatively short timescales but is likely not the cause of the pervasive self-similar traffic described in most papers. One final note not connected to the idea of self-similarity is that TCP is one of the few ways that traffic actively couples to the network topology via the dependence of throughput on RTT. Though most latency in networks is likely caused by congestion and other network conditions, given similar bandwidths and delays, the average shortest path (number of hops) in topology can affect average RTT as shown in [59]. In summary, TCP being the dominant protocol on the Internet is one the main determinants of the traffic dynamics. However, TCP is a complicated and feedback driven protocol whose actions can only be partially estimated using analytical or stochastic models. The TCP protocol will definitely hold promise in the future for those looking for more intricate complex phenomena or pattern formation in Internet traffic dynamics.
6 Network Layer Cause: Theories of Phase Transitions and Critical Phenomena in Networks
The most active area of work by physicists in the research of network dynamics is a group of research which merges the new insights of Internet traffic behavior with the mature and well-tested tools of statistical mechanics and critical phenomena. Similar to papers written on vehicle traffic [98, 44, 33] these papers have analyzed the onset of congestion in networks as a phase transition from a free-flow to congested state determined by a critical parameter. In fact, an explicit comparison was given in [74]. The papers, in general, deal with three broad, though sometimes overlapping, themes regarding the onset of congestion. First, are the papers that analyze the onset of congestion as a function of the packet creation rate for various topologies and also whether the self-similar structure of traffic can be reproduced in these models. Second, are models primarily concerned with investigating the rise of self-organized, emergent phenomena in networks in the critical state and linking the studies of congestion with the study of self-organization in general. Finally, are many papers who investigate how different routing strategies can delay or affect the onset of congestion. The papers of the last category often overlap with the first. Below I will describe some of the most often quoted papers. A more comprehensive list and reference of papers is given in table 6 for those wanting to delve into the topic in more detail. In the papers described, the critical parameter is typically the packet creation rate. This has different symbols depending on the paper but here we will describe it as . Finally, in the next section I will note many common, and unfortunately many times accurate, criticisms and problems with these models.
Papers by physicists investigating congestion first concentrated on the onset of congestion as a critical phenomenon and possible links between this and the self-similar nature of Internet traffic. With few exceptions, these papers focus on the link or network layer dynamics (IP) as the source of critical phenomena in Internet traffic. One of the first papers to deal with a phase transition model of Internet traffic was by Csabai in 1994 [43]. In this paper, Csabai noted the presence of a power spectrum for the RTT times for pings between two computers where the fitted slope is -1.15 (about an of 1.08). He also is among the first to compare Internet data traffic with vehicle traffic [74]. It must be noted that the RTT from ICMP echoes is not always equivalent to the RTT in TCP since many gateways give preferential forwarding to TCP packets. Also, this power law spectrum based off of ICMP echoes is different from the overall traffic whose self-similarity was discussed earlier.
Takayasu, Takayasu, and Sato [181] followed up with a similar study where they also note the distribution of RTT for ICMP pings between two computers if there are many gateways on the route between them, likely because of consecutive jamming due to filled buffers. For a short route, their echo replies are distributed at low frequencies and as white noise at higher frequencies (). They extend the analysis though to include a theoretical derivation of the behavior of network traffic taking into account a simple topology. They disregard loops and use the theoretical topology of a Cayley tree where gateways are sites and cables are links. A contact process (CP) is modeled where empty sites are considered jammed gateways and filled sites (particles) are considered un-jammed gateways. A jammed gateway has a probability of becoming un-jammed if it is adjacent to an un-jammed gateway (particle reproduction) and an un-jammed will become jammed with an independent probability (particle annihilation). An un-jammed gateway will do neither with probability . In analyzing the simulation, they assume that the number of un-jammed gateways over time is equivalent to the distribution of RTT. They derive a power-law result from the CP process which shows the distribution of jammed sites over time follows a power law distribution with time when a parameter equals 0 and that this power law yields noise for the conditions . A comparison of ICMP echo RTTs to earthquake aftershocks is made by Abe and Suzuki [1] who fit the RTT from pings in Internet traffic to a statistical distribution that is similar to Omori’s Law which models the arrival of aftershocks from an earthquake.
A similar hierarchical tree topology is used to investigate critical behavior for data flow by Arenas, Diàz-Guilera, and Guimerá [11]. They derive a mean-field theory solution for the critical packet creation density and also show that most congestion occurs at the root of the tree and the first level of branching. Power-law scaling of the total number of the packets in the system is observed near the critical point .
Takayasu & Takayasu later expand on a theory of self-similarity in Internet traffic as a critical phenomenon in [182, 180, 179] In [180] Takayasu, Takayasu, and Fukuda describe what they believe is a phase transition in the flow of overall Internet traffic. They separate data traffic into 500 s bins and take autocorrelations of each bin comparing the correlation length in seconds with the mean traffic density. The correlation length increases with traffic flow density until a critical density = 500 kbytes/sec where the correlation length begins decreasing again. They associate this with a second order phase transition in the flow where there is a transition from free to congested flow. When they consider any flow above 300 kbytes/sec as “congested” around the critical point they can show power law scaling of lengths of congestion times confirming the critical nature of the phenomenon. In [179], the same authors theorize that the critical nature of traffic measured in Ethernet networks is due to the Ethernet collision detection management algorithm (CSMA/CD) which employs an exponential backoff algorithm on detection of an Ethernet frame collision that is qualitatively similar to the congestion backoff mechanism described in TCP. They show that a binary backoff algorithm can generate traffic distributions at the critical point.
Most of the other prominent papers in the first category follow in the tradition of the first Takayasu paper describing phase transitions using modeled networks in simulations to infer a shift in dynamics above a certain packet creation/flow threshold [28, 140, 213, 144, 72, 172, 203, 215, 80]. The threshold can be changed either by topologies, which are more efficient with small world networks such as random graphs or scale-free graphs than lattices or Cayley trees, by changing the proportion of nodes that can generate (versus only route) traffic, or by routing strategies such as in [144, 215]. In [72, 172, 203], mean field methods are used to calculate the onset of congestion for a 2D lattice at
| (31) |
where is the proportion of nodes that can generate packets and is the length in nodes of a side of the lattice. All of these papers purport to show distributions of packet travel times which they link to self-similar traffic. A paper looking at the problem from a different angle by Moreno, Pastor-Satorras, Váquez, and Vespignani [135] approached the problem by looking at what average traffic density in the overall network could lead to a spread of congestion across all nodes and the collapse of the network. This is a related viewpoint on the cascading router failures and percolation models that have been studied on scale-free topologies [138, 134, 42] which links cascading failures not just to topological sensitivity of certain hubs but also the traffic levels in the network.
In the second category, are papers largely concerned not with the value of the critical parameter but with emergent phenomena themselves. One of the earliest papers hinting at this was a study by Barthélemy, Gondran, and Guichard [17]. Borrowing techniques from nuclear physics, they studied the eigenvalue distribution and eigenvectors of the traffic correlation matrix of 26 routers and 650 connections in the Renater computer network for two weeks of traffic data. Their technique used random matrix theory to compare the eigenvalue distribution of the correlation matrix of Renater traffic fluctuations to that of a control random matrix. The traffic fluctuations in an interval in the traffic between source and destination were defined as
| (32) |
and the correlation between connections and is defined as
| (33) |
They found that the largest eigenvalues were much larger than the largest eigenvalues of a similar rank random traffic matrix whose flows have a mean of 0 and unit variance. Also, the largest values of the eigenvector for the largest eigenvalue correspond to the most highly correlated routers. These results all indicated spatiotemporal correlations among the routers in the network that deviated from traffic defined purely by a stochastic process.
Among the most consistent researchers to address the emergent phenomena question directly are Yuan and Mills [207, 208, 209, 211] who make a persuasive case that emergent phenomena in networks could go beyond the simple onset of congestion in simple network topologies and only treating packets at the network (IP) layer. The main themes of their papers are measuring spatiotemporal patterns that emerge in larger networks. The main features they add lacking in many other models are size (more nodes), more realistic topologies, as in [209], where their network includes four levels of hierarchy in tree structure, and modeling of transport (TCP) level effects such as congestion control [209]. In their first paper [207], they use a simplified topology of a 2D cellular automata (CA) with all nodes as hosts and routers. The state of a router on the CA is defined by the number of packets in its queue and it “transitions” by passing off packets given the state of the queues of the surrounding cells. The traffic sources can originate in any node and are modeled as ON/OFF sources as in [196, 197]. Packets are routed via a full routing table. In addition, they model the systems with three types of congestion control algorithms: no congestion control, a congestion control that stops transmitting above a threshold RTT per hop to the destination, and a TCP-imitating congestion control that includes slow start and congestion avoidance. Their main results use the TCP-imitating congestion and produce power spectrums of the time series of the number of received packets at a given node for various sample time lengths and network sizes. In general, they find that increasingly longer sample times diminish the correlations and long-range dependence measured in the power spectrums but increasing the network size increases the correlations over both time and space. Comparing smaller networks to similar sized subgraphs in larger networks shows that the subgraphs exhibit stronger correlations and they deduce that large network sizes can allow for wider coupling and self-organization. They also surmise larger networks may be more predictable because congestion is stable over longer time scales.
In subsequent papers, this idea is developed further. In [208], the authors do an analysis by creating a weight vector for each node that is constructed from the components of eigenvectors derived from the correlation matrix as in [17]. Yuan and Mills create a technique to analyze simulated networks of a larger size. They define flow vectors, , where ranges from 1 to N where N is the number of nodes with N components each component representing the flow from node to node during a sample interval. They then create a normalized flow vector by normalizing each element of each vector for the entire sample time including all intervals where the normalized vector is
| (34) |
They analyze the eigenvector of the largest eigenvalue of the correlation matrix among all normalized flow pairs over time and use the elements of the subvectors of this eigenvector to create N vectors where is the relative contribution of node to node in terms of traffic correlations. Performing simulated traffic on a 2D topology with ON/OFF sources with Pareto distributed ON times and TCP congestion control they observe complex fluctuation of the largest eigenvalue over times as well as correlated traffic between certain nodes over time though they note their largest eigenvalues tend to be smaller than those in [17]. They also raise the point that during congested critical states, taking a sample of a few nodes (or routers) may give a better and more overall cohesive picture of the entire network if sampling all nodes is infeasible. This is mainly due to the increased spatiotemporal correlations in congestion. Also, longer sampling time windows tend to reduce the visibility of correlations in traffic.
In [209], they continue the same research based on the eigenvalue method but using a four-tier (backbone router, subnet router, leaf router, and source hosts) hierarchical network to model the actual AS-level and below topology of the Internet. They also use the measures of spatiotemporal correlation to find both hotspots and show that distributed denial of service (DDoS) attacks can cause large-scale effects beyond the target router by disturbing traffic flows in other correlated routers in the network. They suggest methods of analyzing network-wide phenomena using small samples of nodes and possibly detecting DDoS attacks by the signatures of large-scale perturbations in correlated network traffic. In [211], they return to the 2D CA formalism but investigate spatiotemporal dynamics using wavelets and logscale diagrams over varying average packet creation rates, congestion control protocols, and average flow durations. They looked for causes of LRD at the application level (file size distribution), transport level (congestion control type) and network level (varying the rate of ON/OFF sources and network size). They found that LRD emerged on wide times scales with long-tail distributions of file sizes, an increasingly large network size, or Pareto distributed ON/OFF source times but only emerged on limited time scales when only the type of congestion control was varied. Though they acknowledge the limits of their model they suggest that most LRD emerges due to interactions in the network layer or possibly file-sizes in the application layer. Like [63, 64, 81] they suggest TCP congestion control plays only a limited part in the emergence of LRD. Yuan et. al. [214] closely replicate the results of [208] except they compare visualization of the largest eigenvalue over time with the information entropy of the weight vectors. They find the eigenvalue more clearly shows the change in correlation structure over time. There are also some very interesting spatiotemporal plots of router congestion over time in [212] showing pattern formation in the temporal congestion among routers in a 1D cellular automaton model.
Other researchers, still following the theory that the onset of congestion could be considered a critical phenomenon, began investigations on possible new routing strategies that could help extend the tolerance of a network to congestion. In short, all of the proposed routing strategies aim to be an improvement over current state Internet routing where routers use a global router table and shortest path metrics to route packets. In particular, these papers show that the geodesic on the networks between two points defined solely according to a graph shortest path are not always the best routing paths in real traffic conditions. The newly proposed routing strategies tend to explicitly take into account traffic and/or queue conditions at neighboring routers or use different topological measures such as betweenness [51, 50] in order to redefine the shortest path metrics and packet routing strategies. Besides random walk routing, the most common routing heuristics are next nearest neighbor (NNN) [6, 177, 178, 175, 176] based on delivery to the destination if it is an adjacent node or either random walking or bias to higher degree nodes otherwise (except a packet cannot travel to a node it has just left). Typically it is shown that NNN is superior to random routing. Preferential next nearest neighbor (PNNN) [206, 192, 87, 88] slightly alters NNN by explicitly taking into account node degree in routing according to a parameter which creates a preference distribution for nodes of a degree according to the relation , or a similar relation. In [31] traffic congestion at nodes is also taken explicitly into account. Typically, there is a purported value of which minimizes average packet travel time and tolerates a higher packet creation rate for the onset of congestion.
Many of these papers, with some exceptions such as [72], do not show how these new routing methodologies should compare against the current shortest-path full routing table the Internet uses for routing. What would the value of a random walk or walk based on the degree of an adjacent router add to network routing infrastructure and performance? Or is it worse than the current system (which most comparisons suggest)? The basic idea of the geodesic between source and destination depending on traffic conditions is a very interesting proposal but how could it be implemented in practice? These questions should provide fertile ground for future research and cross-disciplinary collaboration.
There have been some papers proposing feedback based routing in the network engineering literature (for example [216]), however, they are not related to similar research in physics and this line of research by physicists is often not looked upon highly by the network engineering community as will be discussed in the next section. One final note from equation 1 is that since all of these models use the packet as the basic unit, the concept of the relationship between data throughput and packet size shows that apart from topology changes or new routing, as stated earlier, one easy way to reduce the packet creation rate on a network is to increase the average packet size. Since throughput is an important measure in the function of the Internet, future measurements and experiments on packet creation and congestion should thoroughly account for this.
| Citation | Topology | Host/Router Distribution | Packet Creation Distribution | Routing Strategy |
| [11] | Cayley Tree | All nodes are both | uniform distribution; fixed probability | full routing table - shortest path |
| [182] | Cayley Tree | Hosts on perimeter | uniform distribution; fixed probability | full routing table - shortest path |
| [144] | 2D square lattice | Hosts on perimeter | Poisson process of rate | 1) deterministic method where packets are routed to nodes who have received least packets, 2) probabilistic method where particles choose node biased against nodes having handled more packets |
| [28] | 2D square lattice | All nodes are both | uniform distribution; fixed probability | proximity of neighbors to destination, inverse “temperature” thermal agitation, and repulsion with sites with filled buffers |
| [140] | 2D square lattice | Top row nodes are hosts; bottom row destinations | uniform distribution; fixed probability | random walk |
| [213] | 2D square lattice | All nodes are both | uniform distribution; fixed probability | full routing table - shortest path |
| [72] | 2D square lattice + extra links | All nodes are both | Poisson process of rate | using a routing table and lowest queue consideration in neighbors; use two types of routing tables: a full routing table with all paths and a partial table with paths only up to a distance m from each node |
| [171] | 2D square lattice | random nodes of probability are hosts | uniform distribution; fixed probability | full routing table - shortest path & congested node avoidance |
| [172] | 2D square lattice | random nodes of probability are hosts | uniform distribution; fixed probability | full routing table - shortest path; moderated by congestion & congested node avoidance |
| [203] | 2D square lattice | All nodes are both | Poisson process and long range dependent distribution | full routing table - shortest path & congested node avoidance |
| [215] | random, regular, Cayley tree, scale-free | All nodes are both | uniform distribution; fixed probability | full routing table - shortest path, and biased against high degree or betweeness nodes |
| [80] | 1D chain, 2D lattice, Cayley tree | All nodes are both | uniform distribution; fixed probability | full routing table - shortest path |
| [135] | scale-free | All nodes are both | initial load created on edges by uniform distribution | N/A |
| [207] | 2D cellular automata | All nodes are both | Poisson duration ON/OFF sources | full routing table - shortest path |
| [208] | 2D square lattice | two tiers: one hosts, one routers | Pareto duration ON/OFF sources | full routing table - shortest path |
| [209] | four tier hierarchical network | tier four (lowest level) sources and receivers | Pareto duration ON/OFF sources | full routing table - shortest path; different forwarding capacities on each tier |
| [211] | 2D cellular automata | two tiers: one hosts, one routers | both Poisson and Pareto duration ON/OFF sources | full routing table - shortest path; different forwarding capacities on each tier |
| [214] | 2D square lattice | two tiers: one hosts, one routers | Pareto duration ON/OFF sources | full routing table - shortest path; different forwarding capacities on each tier |
| [212] | 1D chain | Fixed number of hosts at random positions on chain; inter-host spacing is buffer length | uniform distribution; fixed probability | right to left diffusion based off of max routing speeds and buffer sizes |
| [50] | scale-free | All nodes are both | uniform distribution; fixed probability; one time packet creation t=0 | global routing table; shortest path and congestion in neighbor nodes |
| [51] | scale-free based on Internet AS map | All nodes are both | uniform distribution; fixed probability | global routing table |
| [205] | 2D lattice, scale-free | All nodes are both | fixed number of packets per time step | global routing table; shortest path biased against high betweeness nodes |
| [177, 178] | scale-free, web like | All nodes are both | uniform distribution; fixed probability | NNN |
| [175, 176] | scale-free, web like, random grown tree | All nodes are both | fixed number of packets per time step | NNN, random walk, 1-2 distance awareness |
| [206] | scale-free | All nodes are both | fixed number of packets per time step | PNNN |
| [192] | scale-free | All nodes are both | fixed number of packets per time step | 1) routes to neighbors biased towards higher degree nodes; 2) also adjusted for congestion in neighbors |
| [87] | scale-free | All nodes are both | fixed number of packets per time step | PNNN |
| [88] | scale-free | All nodes are both | fixed number of packets per time step | PNNN |
| [31] | random, static scale-free, BA scale-free | All nodes are both | uniform distribution; fixed probability | full routing table - shortest path & congested node avoidance |
| [112, 113] | 2D square lattice + extra links | All nodes are both | Poisson process of rate | full routing table - shortest path & congested node avoidance |
7 Criticisms of Various Approaches to Self-Similarity
Though the physics literature on congestion and critical phenomena in networks is becoming increasingly sophisticated and adept at “reproducing” self-similar patterns seen in Internet traffic, there have been several valid criticisms, particularly from the network engineering community, that the methodologies may reproduce observations but do not take into account the actual workings of the Internet in detail [67, 199, 48, 114, 103, 156, 10, 121, 8, 202]. In [67] Floyd and Paxson, though not addressing physics approaches directly, note that the while simulations are crucial to Internet research, the Internet is extraordinarily complicated and difficult to accurately simulate, especially on large scales. In particular, they point out three problems: the increasingly unpredictable behavior of IP over increasingly diverse networks and applications, the massive and continuously increasing size of the Internet, and its penchant for changing in many drastic ways over time. Heterogeneity is the rule not the exception and many activities such as periodicities are often left out of simulations. The papers [199, 8, 48] address the physics community more directly pointing out defects in the theories of critical phenomena and the hub vulnerability of scale-free networks respectively. In [199], Willinger et. al. describe evocative models, which reproduce the observations using generic models, and explanatory models, whose applicability are tested by experiment and measurement (what they term “closing the loop”). They complain many models, from physicists and some engineers, are evocative and ignore the research on the particulars of Internet protocols, function, and traffic that could verify or refute their model. These models instead act as a “black box” which try to come up with an appealing model or theory to match self-similarity but do not provide any prediction or verification using real world traffic trace data. For example, the largest problem in many of the phase transition models is that they demonstrate self-similar traffic only at critical loads while Internet traffic measurements show self-similar traffic in both free-flow and congested regimes and at all levels of flow. In [8], Alderson and Willinger further elaborate that they believe models from statistical mechanics are not applicable to the Internet which is designed by multiple economic and performance considerations and not by simple rules of self-organization often present in models such as preferential attachment.
Barabási-Albert preferential attachment model for the growth of scale-free networks is criticized since many of the highly connected nodes in the Internet are at the edges near final consumers rather than in the central parts of the high speed AS network. This valid criticism though is partially answered by disassortative mixing, which shows that in non-social networks like the Internet, high degree nodes are more likely to connect with low-degree nodes and rules out a core of highly connected, highly vulnerable hubs. Many subsequent models of scale-free networks have taken this into account. Finally, [48, 202] criticize the research in topology that says scale-free networks are vulnerable to attack due to highly connected hubs, which they once again say is fallacious because despite power-law degree distributions the most highly connected hubs are often on the periphery of the Internet and not along its crucial backbone. They blame much of the confusion on the methodology in the widely cited paper by Faloutsos et. al [57]. He et. al [86] partially rebut criticisms by studying relationships between customer-providers and peers at Internet exchange points (IXPs). They find the customer provider relationship closely fits a power law though the peer-peer relationships show a Weibull distribution.
Lee in [114] points out both the aforementioned problems with the critical phenomena models but also points out the ON/OFF model also has problems because since an ON/OFF source has a long-tail duration time distribution, you will have a finite probability of an ON/OFF source as long in duration as any observation period you make. Lee also criticizes TCP models for not accounting for similar self-similarity effects in UDP and other stateless protocols. In [81, 63, 64, 188], the possibility is also raised that that TCP can effect the traffic dynamics in a more market dynamic on shorter time scales (near the order of multiple RTT) and this is an area of future investigation and debate.
In the author’s opinion, these criticisms of critical phenomena models are extremely valid and that self-similarity only at critical loads and lack of real world validation show many of the models in the previous section are unrealistic or misleading. Given the current facts and validation against real data, it seems that the current weight of the evidence for long timescale self-similarity lies with the application layer explanation based on ON/OFF sources. However, this does not mean the physics models based on statistical mechanics are completely useless. Wide scale Internet traffic measurements are nearly impossible currently and also large-scale theories of traffic are still relatively undeveloped. Currently almost all real data is traffic traces over one given link during a given time period which makes large scale Internet studies very difficult. Large-scale congestion, traffic correlations, and other complicated phenomena will probably draw useful lessons from physics models of self-organization and long-range correlations though more realistic models are absolutely necessary. The omission of TCP-like congestion control, except in a few models, must be rectified. If these criticisms sound a bit harsh, try to put yourself in the shoes of most network engineers who understand the intricate processes in detail of how the Internet operates. When shown a model of a 2D grid, no mention of congestion control, infinite router buffers, and self-similar traffic only in congested conditions, their incredulity is understandable. It is aggravated by the fact that almost none of these papers try to match results with or analyze real traffic traces.
In defense of the efforts of physicists, however, I believe that physics started out correctly choosing simplistic topologies and dynamics scenarios that are both analytically tractable and amenable to rapid simulation. However, though the earlier work of those like Takayasu began by looking at traffic traces, this soon disappeared almost completely in favor of computer simulation. Despite the obvious shortcomings of explaining self-similar traffic, the demonstration that large-scale congestion, though on which timescale is unknown, may be a theory the physics and engineering communities should take note of for validation or refutation.
With the work in [17, 208, 209] showing large-scale correlations among router traffic in both real and simulated data, can we really look at the Internet dynamics from solely the viewpoint of a collection of single traffic traces? The question is not if the Internet displays large-scale correlations and self-organization well-known to complexity theory, but how these large-scale effects play out and if realistic simulations with both realistic dynamics and topology can predict effects that we have not yet observed or known how to look for. Much more cross-disciplinary work is needed in this direction.
Though the analysis of the criticisms above seems like it tries to be even handed and please everyone while solving nothing, the nature of the problem is such that the issues regarding the core nature of Internet traffic cannot be easily resolved. Willinger et. al. are right in that the loop must be closed and just creating a simulation that outputs traffic with a Hurst exponent near 0.8 cannot be considered the final word in the “cause” of self-similarity in Internet traffic. In addition, though it is difficult and near impossible, large-scale and coordinated traces and models of a topologically and dynamically correct Internet is the next logical step in modeling and studying these phenomena.
8 Other Interesting Phenomena
8.1 Flows and fluctuations
Barabási and Argollo de Menezes from the physics community [12] proposed an interesting result when they announced a relationship between the average volume of the flow and its dispersion (standard deviation of traffic volume) among nodes in a network. In particular, they found that accounting for all nodes in a network, you find the average flux and standard deviation per node are related by the scaling relationship
| (35) |
Where is near either 1 or 1/2 for two types of systems. The traffic on nodes of a network of Internet routers and on/off state occurrence of junctions in a microprocessor electronic network had scaling exponents of 1/2 while visitor traffic to a group of WWW pages, traffic at a group of highway junctions, and water flow in different locations in a river network demonstrated scaling exponents of 1. In two simulations, one based on random walks on a scale-free network and the other by simulating shortest-path traffic on a scale-free network, they were able to explain the scaling exponent of 1/2 as being based on the channeling of traffic through select nodes and arises from internal or endogenous network dynamics. The power scaling exponent of 1 on the other hand is shown to be universal when the amount of traffic is driven by external forces as well as endogenous dynamics similar to an open system. They believe the power exponent of 1 is more universal than ½ since it results from the interplay of endogenous and exogenous pressures. In a subsequent paper [13], they give a method of extracting the endogenous and exogenous traffic and propose a metric, , that defines the predominance of external or internal influences on traffic dynamics by the equation
| (36) |
Where indicates an externally driven system while indicates a systems dominated by internal dynamics. can vary on different time scales as [52] showed using trading records from the New York Stock Exchange where internal dynamics were dominant on the scale of minutes while external ones were dominant on the hours and days time scales. In [178], a power law-scaling relationship was also found via an NNN routing simulation on a scale-free network and scaling was demonstrated also exhibiting either an exponent of 1/2 or 1.
The generality of the results and the universality of the classes proposed in these papers has recently been disputed though. Duch and Arenas [49] perform several measurements relating flow and fluctuations on data from the Abilene Internet backbone and claim that varies between 0.71 and 0.86 and not 1/2 as represented in the first papers. They also propose that this derivation is due to the original papers disregarding congestion in networks and show analytically that for short timescales of measurement, an of 1/2 is a trivial result but a false generality once the timescales are extended and other parameters come into play. They conclude that there is a scaling relationship but no universality classes as claimed. Meloni et. al. [126] go even further and say that under certain conditions, power-law scaling between flows and fluctuations should be abandoned. They conduct a simulation of a random diffusion process on a network of packets measuring scaling as influenced by the time window of measurements, the degrees of the nodes flows and fluctuations are measured on, and the volume of packets in the network. They produce an analytical result that explains power scaling behavior between the two quantities only under the conditions where the noise fluctuations in the system and/or the time window size are relatively small. Otherwise tends towards 1 and does not display power-law scaling. Also, they show even in networks with power-law scaling, can scale differently at 1/2 for low-degree nodes or 1 for high degree nodes showing that within networks there may be varying scaling depending on the degrees of the nodes.
Finally, Han et. al. in [83] measure for the download rates of an Econophysics web database and find an varying from 0.6 to 0.89 depending on the length of the sample time window. They confirm the power law scaling between flux and fluctuations but do not find any universal exponents. From these results the research between flows and fluctuations in networks is still in its earliest stages but holds out much promise for future progress.
8.2 Internet worm traffic & BGP storms
In [209], a simulation by Yuan and Mills was touched on that aimed to try to predict part of the large-scale impact of a rapidly spreading Internet worm. Recent increases in the amount and sophistication of malicious code released on the Internet including the use of “zombie” computers for large-scale DDoS attacks has demonstrated this is far from just a theoretical exercise. An increasingly large literature base on the Internet traffic effects of epidemics has arisen, particularly after the Code Red outbreak in 2001 (which the author had the dubious honor of handling as a network security administrator at the time). Again, to stay with the scope of the paper the aspects of Internet worms discussed here will be tightly limited to effects on traffic, both measured and predicted, and will not delve into the voluminous theoretical work of epidemiology on scale-free networks or other topologies [153] or much of the new literature with specialized epidemic models for computer worms and the effect of topology on their spread [75, 204, 101, 133, 193]. Suffice to say, mathematical results indicate for an ideal epidemic spreading on a scale-free topology, there is no minimum epidemic threshold and that an infection of any size can theoretically spread through the entire network.
The two most studied Internet worms have been the Code Red (start: July 19, 2001), Nimda (start: September 19, 2001), and SQL Slammer (start: January 25, 2003). The Slammer, though not holding a malicious payload, was the fastest spreading worm in history [132]. What has often been found is that the worms not only cause trouble for the computers they affect, they create large-scale traffic patterns that can disrupt the normal behavior of entire networks. Often, a worm spreads by exploiting a vulnerability in computers and will try to infect random computers by testing an IP address at random or due to certain rules. With potentially millions of computers sending out such probes at once it is easy to see how normal traffic patterns can be seriously disrupted.
In particular, worms have often been the culprit of what could be termed a large-scale instability in the BGP routing system called a BGP update storm or BGP storm. In a BGP storm, the normal level of BGP updates sent to update the router table can rise by several orders of magnitude and sometimes disrupt traffic [40, 164]. For example, in [40] they describe how during the Nimda worm normal BGP update traffic of 400 advertisements per minute jumped to 10,000 advertisements per minute. This is not because the worms infected the routers themselves but because the worms caused large packet flows which overwhelmed the router memory and CPU limits and caused them to crash. These router crashes caused frenzied reorienting of the Internet router topology. BGP storms are interesting in that both traffic and topology is rapidly changing. BGP storms may be an avenue for both physicists and engineers to investigate the relationship between topology and traffic in a situation when both are largely in flux.
Yuan and Mills expanded their work from [209] to a full paper [210] that looks at spatiotemporal correlations between routers and hosts in several types of large scale DDoS attacks. They find that DDoS attacks may cause traffic variations at correlated routers and hosts besides just the target. Because of these large traffic altering phenomena, certain spectral techniques have been researched to identify DDoS attacks. Some of these are summarized in the next section.

8.3 Traffic oscillations/periodicities
Earlier periodic behavior in Internet traffic was casually mentioned as theoretical assumptions of TCP traffic. Also, one of the consequences the self-similar nature of traffic is the spectral behavior of the traffic. Beyond these, however, there are a plethora of traffic periodicities that represent oscillations in traffic over periods of several scales of magnitude from milliseconds to weeks. Many of these are well-defined and classified. Their origin has two possible sources: first, software or transmission driven periodicities which range on the time scale of milliseconds, seconds, or in rare cases, hours. Second are user driven periodicities which range on the time scale of days, weeks, and possibly longer. This new area of research has been dubbed network spectroscopy[22] or Internet spectroscopy and is finding uses in applications such as identifying traffic sources via traffic periodicity “fingerprints” to early detection of denial of service or other hacker attacks by detecting anomalous oscillations in the traffic spectrum similar to vibration analysis of faulty machinery.
The causes and periods of various known periodicities are summarized in figure 7. The values can have a general range of deviation so the periods are not always exact, but are a good guide to the major periodicities. User traffic driven periodicities were the first known and most easily recognized. The first discovered and most well-known periodicity is the 24 hour diurnal cycle and its harmonic of 12 hours. These cycles have been known for decades and reported as early as 1980 and again in 1991 as well as in many subsequent studies[165, 108, 148, 163, 139, 145, 69]. This obviously refers to the 24 hour work-day and its 12-hour second harmonic as well as activity from around the globe. The other major periodicity from human behavior is the week with a period of 7 days [148, 163, 25] and a second harmonic at 3.5 days and barely perceptible third harmonic at 2.3 days. There are reports as well of seasonal variations in traffic over months [84], but mostly these have not been firmly characterized. Long period oscillations have been linked to possible causes of congestion and other network behavior related to network monitoring [139, 145]. One note is that user traffic driven periodicities tend to appear in protocols that are directly used by most end users. The periodicities appear TCP/IP not UDP/IP and are mainly attributable to activity with the HTTP and SMTP protocols. They also often do not appear in networks with low traffic or research aims such as the now defunct 6Bone IPv6 test network.
The autonomous, non-user driven, periodicities operate mostly at timescales many orders of magnitude smaller than user behavior. At the lowest period, and correspondingly highest frequency, are the periodicities due to the throughput of packet transmission at the link level. This has been termed the “fundamental frequency” [84] of a link and can be deduced from the equation:
| (37) |
where is the average throughput of the link and is the average packet size at the link level. A quick inspection reveals this equation is identical to that for the flow rate given by equation 1. Indeed, the fundamental frequency is the rate of packet emission across the link and is the highest frequency periodicity possible. The theoretical maximum fundamental frequency is given by
| (38) |
where B is the bandwidth of the link and the packet size is the MTU packet size. Therefore for 1 Gigabit, 100 Mbps, and 10 Mbps Ethernet links with MTU sizes of 1500 bytes, the theoretical maximum fundamental frequencies are 83.3 kHz, 8.3 kHz, and 833 Hz respectively.
The usual measured fundamental frequencies via power spectrum diagrams are lower than the theoretical fundamental frequencies due to lower throughput. The fundamental frequency also generally displays harmonics as well [84].
Broido, et. al. [23] believe there are thousands of periodic processes in the Internet. Among other prominent recognized periodicities are BGP router table updates sent every 30 seconds, SONET frames transmitted every 125s, DNS updates transmitted with periods of 75 minutes, 1 hour, and 24 hours due to default settings in Windows 2000 and XP DNS software[22], and in TCP flows ACK packets at a frequency of 1/RTT [23, 21, 32] with RTTs usually ranging from 10ms to 1s.
The main practical applications being researched for network spectroscopy are inferring network path characteristics such as bandwidth, digital fingerprinting of link transmissions, and detecting malicious attack traffic by changes in the frequency domain of the transmission signal. In [97, 85], the authors use analysis of the distribution of packet interarrival times to infer congestion and bottlenecks on network paths upstream. In [32, 30, 90, 89, 117] various measures of packet arrival distributions, particularly in the frequency domain, are being tested to recognize and analyze distributed denial of service or other malicious attacks against computer networks. Inspecting the frequency domain of a signal can also reveal the fingerprints of the various link level technologies used along the route of the signal as is done in [23, 39].

8.4 Biological/ecological models and Internet traffic
Comparisons of the Internet to biological or ecological systems are legion and range from the theoretically precise to philosophical speculations in both popular fiction such as William Gibson’s Neuromancer and Masamune Shirow’s Ghost in the Shell [77, 167] as well as in the opinions of some researchers such as Vernor Vinge’s “Singularity”[189].
The focus here is on scientific papers which have used mathematical models, biological or ecological, to describe functions of the Internet or compare certain functions to physical systems. The growth of the Internet’s nodes in terms of a birth/death process is covered in [154]. In [73] Fukuda, Nunes-Amaral, and Stanley use several statistical analyses to show a striking similarity between variations in daily Internet active connections in a data trace and statistics on heartbeat intervals. By both separating both non-stationary time series into stationary segments and using DFA, they show that the magnitudes of activity for night time (non-congested) Internet connections and healthy heartbeats are statistically very similar. Likewise day time (congested) Internet connections and diseased heartbeat intervals are also similar in their fluctuations. They propose that a general nonlinear systems explanation underlies both systems and given that the heart rate is controlled by the autonomic nervous system, understandings of Internet functions and properties could be used to study the autonomic nervous system as well.
Several authors have also used ecological interaction models such as mathematical models of competition and mutualism to study interaction between web sites and search engines. In [124, 106, 107], competition and cooperation between web sites are analyzed using the n-competitor Lotka-Volterra differential equations from ecology. The steady state of “winner takes all” or multiple participants is extracted from stability criterion and compared to actual market competition. In [190], another model which includes a cooperation effect is introduced to study the same dynamics. The interesting analogy between search engines and websites as a mutualistic relationship is introduced in [191]. The postulated mutualism is obligate for the search engine and facultative for the websites. This is similar to the sea anemone and hermit crab or mycorrhiza and plant mutualisms in nature. They show that strong mutual support for web sites by search engines and vice versa offers the best opportunity for long-term sustainability and growth.
The last paper covered in this section is a recent publication which draws similarities between the energy use and scaling of information networks and metabolic scaling phenomena such as Kleiber’s Law, the 3/4 power law scaling of organism mass and metabolism [137]. Though the bulk of the paper is comparing the circuitry density and area for electronic circuits microprocessors, they derive, with a limited set of data points, a scaling relationship between the total processing power of hosts on the Internet and Internet backbone bandwidth with a scaling exponent of about 2/3. Future research in this direction, especially if a valid scaling law relating topology and dynamics is discovered, will surely be very fruitful.
| Name | Data |
|---|---|
| CAIDA | Probably largest and most comprehensive repository of all types of Internet data and research. Hosted by UC San Diego |
| Crawdad | Collection of wireless data traces made at Dartmouth |
| Datapository | Collection of topology data, mostly based on BGP |
| Dimes | A project that seeks to more accurately measure Internet topology by applying traceroute and ping from a collection of different users with downloaded software around the world in a model similar to SETI@Home |
| MOME | Large collection of traffic traces conducted by European based researchers and collaborations |
| NLANR | Older traffic trace project; now mostly housed at CAIDA |
| ns-2 | Commonly used network traffic simulator in the network engineering community |
| PingER | Stanford project to monitor Ping response in IPv4 and IPv6 across the Internet |
| PREDICT | A collection of datasets of Internet topology and traffic tailored towards predicting and defending against cyberattacks. Must apply for data access |
| RouteViews | U of Oregon’s database on Internet routing tables and BGP data |
| tcpdump | Main program used to collect traffic for analysis; used in many packet sniffing programs |
| UMass Trace Repository | Collection of publicly available traffic traces conducted at the University of Massachusetts Amherst |
| WAND | Collection of traces done by the University of Waikato, New Zealand |
| WIDE MAWI | Japan’s WIDE Project traffic trace archive; data source of many graphs in this paper |
9 Conclusion
With every passing year, research is making us more and more aware of the complex dynamics and interplay of factors on the Internet. Though many may haphazardly use the terms self-organization, emergence, or power law this review has hopefully laid out the concrete facts about what is known clearly about Internet traffic, what is less clear, and where many new paths can be beaten. Unlike most systems which are amenable to constant analysis over long time periods, the Internet is ever changing. What we understand today may not completely apply several years from now. In addition, our knowledge of long range correlations and dynamics among multiple sites and links is still in its infancy. Large-scale congestion is the only possible large-scale property which has been studied in any detail and it remains to be seen if it is the only one that exists. There is much room for speculation on these matters without being irresponsibly fanciful.
At the core, these issues are more than academic since the long-term efficiency and stability will require us to understand the Internet and its traffic well enough to optimize it for the ends of users. Advances in understanding the Internet are also enabled and constrained about our knowledge of nonlinear dynamics and complex systems in general. As more themes and discoveries about these systems emerge, they will doubtlessly provide us with more tools with which to investigate the Internet and uncover more of the story behind its dynamics. Finally, as mentioned earlier, it is essential for more cross-disciplinary cooperation to take place in order to accelerate our understanding of Internet phenomena. The two groups have cooperated in some areas and are hardly irreconcilable. Combining both toolkits can definitely bring forth some more surprising and rewarding results.
Finally, though this paper has been heavy on esoteric technical aspects of the Internet, we must not lose sight of the whole, as the poet Walt Whitman once wonderfully wrote [195],
When I heard the learn’d astronomer;
When the proofs, the figures, were ranged in columns before me;
When I was shown the charts and the diagrams, to add, divide, and measure them;
When I, sitting, heard the astronomer, where he lectured with much applause in the
lecture-room,
How soon, unaccountable, I became tired and sick;
Till rising and gliding out, I wander’d off by myself,
In the mystical moist night-air, and from time to time,
Look’d up in perfect silence at the stars.
For everything said about self-similarity, phase transitions, and related matter we must never lose sight of the Internet as the wonderful invention it has been in its cultural, economic, and technological aspects uniting those from around the world. Even if in only a small part, this should animate and encourage our research into the future.
References
- [1] Abe, S. & Suzuki, N., Omori’s law in the Internet traffic, Europhys. Lett. 61 (2003), 852-855.
- [2] Abry, P. & Veitch, D., Wavelet Analysis of Long-Range Dependence Traffic, IEEE Transactions on Information Theory, 44:1 (1998), pp.2-15.
- [3] Abry, P., Baraniuk, R., Flandrin, P., Riedi, R., & Veitch, D., Multiscale Network Traffic Analysis, Modeling, and Inference Using Wavelets, Multifractals, and Cascades, IEEE Signal Processing Magazine, 19:3 (2002), 28-46.
- [4] Abry, P., Flandrin, P., Taqqu, M.S. & Veitch, D., Wavelets for the analysis, estimation, and synthesis of scaling data, In Self-similar network traffic and performance evaluation edited by Park, K. & Willinger, W. (John Wiley & Sons, New York, 2000) pp. 39-88.
- [5] Abry, P., Flandrin, P., Taqqu, M.S. & Veitch, D. Self-similarity and long-range dependence through the wavelet lens, In Theory and Applications of Long-Range Dependence edited by Doukan, P., Taqqu, M.S., Oppenheim, G. (Birkh¨auser, Boston, 2003) pp. 527-556.
- [6] Adamic, L., Lukose, R., Puniyani, A., & Huberman, B. Search in power-law networks, Phys. Rev. E, 64 (2001), 046135.
- [7] Albert, R. & Barabási, A.L., Statistical mechanics of complex networks, Rev. Mod. Phys., 74 (2002), 47-97.
- [8] Alderson, D.L. & Willinger, W., A contrasting look at self-organization in the Internet and next-generation communication networks, IEEE Communications Magazine, 43:7, (2005) 94-100 .
- [9] Alderson, D.L., Li, L., Willinger, W., & Doyle, J. Understanding Internet topology: Principles, models, and validation, IEEE/ACM Transactions on Networking, 13:6, (2005) 1205-1218.
- [10] Alderson, D.L., Chang, H., Roughan, M., Uhlig, S. & Willinger, W., The many facets of Internet topology and traffic, Networks and Heterogenous Media, 1:4, (2006) 569-600.
- [11] Arenas, A., Diàz-Guilera, A. & Guimerá, R., Communication in Networks with Hierarchical Branching, Phys. Rev. Lett., 86 (2001), 3196-3199.
- [12] Argollo de Menezes, M, & Barabási, A.L., Fluctuations in Network Dynamics, Phys. Rev. Lett., 92 (2004), 028701.
- [13] Argollo de Menezes, M. & Barabási, A.L., Separating Internal and External Dynamics of Complex Systems, Phys. Rev. Lett., 93 (2004), 068701.
- [14] Baker, M.G., Hartman, J.H., Kupfer, M.D., Shirriff, K.W., & Ousterhout, J.K., Measurements of a distributed file system , in Proceedings of the 13th ACM Symposium on Operating System Principles, (Pacific Grove, CA ,1991), pp. 198-212.
- [15] Albert, R., Jeong, H., & Barabási, A.L., Internet diameter of the World-Wide Web, Nature, 401 (1999), 130131 .
- [16] Bardet, J.M. & Kammoun, I., Asymptotic properties of the detrended fluctuation analysis of long-range-dependent processes, IEEE Transactions on Information Theory, 54:5, (2008) 2041-2052.
- [17] Barthélemy, M., Gondran, B., Guichard, E., Large scale cross-correlations in Internet traffic, Phys. Rev. E, 66 (2002), 056110.
- [18] Barthélemy, M., Gondran, B., & Guichard, E., Spatial structure of the internet traffic, Physica A, 319:1 (2003), 633-642.
- [19] Basher, N., Mahanti, A., Williamson, C. & Arlitt, M., A comparative analysis of web and peer-to-peer traffic, Proceedings of the 17th International Conference on the World Wide Web (Beijing, China, 2008), pp. 287-296.
- [20] Boccaletti, S., Latora, V., Moreno, Y., Chavez, M., & Hwang, D.U., Complex networks: Structure and dynamics, Phys. Repp., 424:4-5 (2006), 175-308.
- [21] Broido, A., Invariance of Internet RTT spectrum, in Proceedings of ISMA Conference, (San Diego, CA, 2002).
- [22] Broido, A., Nemeth, E., & Claffy, K.C., Spectroscopy of DNS Update Traffic, ACM SIGMETRICS 2003, 31:1 (2003) 320-321.
- [23] Broido, A., R King, Nemeth, E., Claffy, K.C., Radon Spectroscopy of Packet Delay, in Proceedings of the IEEE High-Speed Networking Workshop 2003, (San Diego, CA 2003).
- [24] Brownlee, N. & Claffy, K.C., Understanding Internet traffic streams: dragonflies and tortoises, IEEE Communications Magazine, 40:10 (2002) 110-117.
- [25] Burgess, M., Haugerud, H., Straumsnes, S., & Reitan, T., Measuring system normality, ACM Trans. on ComSys., 20:2 (2002) 125-160.
- [26] Cáceres, R., Measurements of wide-area Internet traffic University of California Berkeley Technical Report, CSD-89-550 (1989).
- [27] Cáceres, R., Danzig, P., Jamin, S., & Mitzel, D., Characteristics of wide-area TCP/IP conversations, Proceedings of SIGCOMM ’91, 21:4 (Zurich, Switzerland, 1991), pp. 101-112.
- [28] Campos, I., Tarancón, A., Clérot, F., & Fernández, L.A., Thermal and repulsive traffic flow, Phys. Rev. E, 52 (1995) 5946-5954.
- [29] Chang, H.S., Jamin, S., & Willinger, W., Internet connectivity at the AS-level: an optimization-driven modeling approach, Proceedings of the ACM SIGCOMM workshop on Models, methods and tools for reproducible network research, (Karlsruhe, 2003) pp. 33-46.
- [30] Chen, Y. & Hwang, K., Collaborative detection and filtering of shrew DDoS attacks using spectral analysis, Journal of Parallel and Distributed Computing, 66:9 (2006) 1137-1151.
- [31] Chen, Z.Y. & Wang, X.F., Effects of network structure and routing strategy on network capacity, Phys. Rev. E, 73 (2006) 036107.
- [32] Cheng, C.M., Kung, H.T., & Tan, K.S., Use of spectral analysis in defense against DoS attacks, in Proceedings of IEEE GLOBECOM ’02, 3 (Taipei, Taiwan, 2002) pp. 2143-2148.
- [33] Chowdhury, D., Santen, L., & Schadschneider, A., Statistical physics of vehicular traffic and some related systems, Phys. Repp., 329:4-6 (2000) 199-329.
- [34] Claffy, K.C. & McCreary, S., Trends in Wide Area IP Traffic Patterns: A View from Ames Internet Exchange, Proceedings of the 13th ITC Specialist Seminar on Internet Traffic Measurement and Modeling (Monterey, CA, 2000).
- [35] Claffy, K.C. & Polyzos, G.C., Traffic characteristics of the T1 NSFNET backbone, Proceedings of INFOCOM ’93 (San Francisco, CA, 1993) pp. 885-892.
- [36] Claffy, K.C., Braun, H.W., & Polyzos, G.C., A parameterizable methodology for Internet traffic flow profiling,, IEEE Journal on Selected Areas in Communication, 13 (1995) 1481-1494.
- [37] Clauset, A., Shalizi, C.R., & Newman, M.E.J., Power-law distributions in empirical data, to appear SIAM Review, preprint arXiv:0706.1062 (2009).
- [38] Clegg, R.G., A practical guide to measuring the Hurst parameter, International Journal of Simulation: Systems, Science & Technology, 7:2 (2006) 3-14.
- [39] Coates, M., Hero, A., Nowak, R. & Yu, B., Internet tomography, IEEE Signal Processing Magazine, 19:3 (2002) 47-65.
- [40] Cowie, J., Ogielski, A.T., Premore, B.J., & Yuan, Y.G., Internet worms and global routing instabilities, in Proceedings of SPIE, 4868 (San Jose, CA, 2002) pp. 195-199.
- [41] Crovella, M.E. & Bestavros, A., Self-similarity in World Wide Web traffic: evidence and possible causes , IEEE ACM Transactions on Networking, 5:6 (1997) 835-846.
- [42] Crucitti, P., Latora, V., & Marchiori, M., Model for cascading failures in complex networks, Phys. Rev. E, 69 (2004) 045104.
- [43] Csabai, I.J., 1/f noise in computer network traffic, Phys. A: Math. Gen., 27 (1994) 417-421.
- [44] Daganzo, C.F., Cassidy, M.J. & Bertini, R.L. Causes and Effects of Phase Transitions in Highway Traffic University of California, Berkeley Institute of Transportation Studies Research Report UCB-ITS-RR-97-8, (1997).
- [45] Dorogovtsev, S.N. & Mendes, J.F.F., Evolution of networks, Adv. in Phys., 51:4 (2002) 1079-1187.
- [46] Dovrolis, C., Ramanathan, P., & Moore, D., What do packet dispersion techniques measure?, Proceedings of INFOCOM 2001, 2 (Anchorage, AL, 2001) 905-914.
- [47] Downey, A.B., The structural cause of file size distributions, in Proceedings of the 9th IEEE/MASCOTS (Modeling, Analysis and Simulation of Computer and Telecommunication Systems)(Cincinnati, OH, 2001) pp. 361-370.
- [48] Doyle, J.C., Alderson, D.L., Li, L., Low, S., Roughan, M., Shalunov, S., Tanaka, R., & Willinger, W., The ‘robust yet fragile’ nature of the Internet, Proc. Natl. Acad. of Sci., 102:41 (2005) 14497-14502.
- [49] Duch, J. & Arenas, A., Scaling of Fluctuations in Traffic on Complex Networks, Phys. Rev. Lett., 96 (2006) 218702.
- [50] Echenique, P., Gómez-Gardeñas, J., & Moreno, Y., Improved routing strategies for Internet traffic delivery, Phys. Rev. E, 70 (2004) 056105.
- [51] Echenique, P., Gómez-Gardeñas, J., & Moreno, Y., Dynamics of jamming transitions in complex networks, Europhys. Lett., 71 (2005) 325.
- [52] Eisler, Z., Kertész, J., Yook, S.H., & Barabási, A.L., Multiscaling and non-universality in fluctuations of driven complex systems, Europhys. Lett., 69 (2005) 664-670.
- [53] El Khayat, I., Geurts, P., & Leduc, G., On the Accuracy of Analytical Models of TCP Throughput in Networking Technologies, Services, and Protocols; Performance of Computer and Communication Networks; Mobile and Wireless Communications Systems, (Springer, Berlin, 2006) pp. 488.
- [54] Erman, J., Mahanti, A., Arlitt, M., & Williamson, C., Identifying and discriminating between web and peer-to-peer traffic in the network core, Proceedings of the 16th International Conference on World Wide Web (Banff, Alberta, 2007) pp. 883-892.
- [55] Erramilli, A., Roughan, M., Veitch, D., & Willinger, W., Self-similar traffic and network dynamics, Proc. of the IEEE, 90 (2002) 800-819.
- [56] Estan, C. & Varghese, G., New directions in traffic measurement and accounting: Focusing on the elephants, ignoring the mice, ACM Trans. on ComSys., 21:3 (2003) 270-313.
- [57] Faloutsos, M., Faloutsos, P., & Faloutsos, C., On power-law relationships of the Internet topology ACM SIGCOMM ComComm. Rev., 29 (1999) 251-262.
- [58] Fang, W. & Peterson, L., Inter-AS traffic patterns and their implications, Proceedings of IEEE GLOBECOM ’99 3 (Rio de Janeiro, Brazil, 1999) pp. 1859-1868.
- [59] Fei, A.G., Pei, G.Y., Liu, R., & Zhang, L.X., Measurements on Delay and Hop-Count of the Internet, in Proceedings of IEEE GLOBECOM ’98-Internet Mini-Conf., (Sydney, Australia, 1998).
- [60] Fekete, A. & Vattay, G., Self-similarity in bottleneck buffers, in the Proceedings of IEEE GLOBECOM ’01, 3 (San Antonio, TX, 2001) pp.1867-1871.
- [61] Feldmann, A., Gilbert, A.C., Willinger, W., & TG Kurtz, The changing nature of network traffic: scaling phenomena, ACM SIGCOMM ComComm. Rev., 28:2 (1998) 5-29.
- [62] Feldmann, A., Gilbert, A.C., & Willinger, W., Data networks as cascades: investigating the multifractal nature of Internet WAN traffic, ACM SIGCOMM ComComm. Rev., 28:4 (1998) 42-55.
- [63] Figueiredo, D., Liu, B., Misra, V., & Towsley, D., On the autocorrelation structure of TCP traffic, Computer Networks, 40:3 (2002) 339-361.
- [64] Figueiredo, D., Liu, B., Feldmann, A., Misra, V., Towsley, D., & Willinger, W., On TCP and self-similar traffic, Performance Evaluation, 61:2-3 (2005) 129-141.
- [65] Floyd, S., Connections with multiple congested gateways in packet-switched networks part 1: one-way traffic, ACM SIGCOMM ComComm. Rev., 21:5 (1991) 30-47.
- [66] Floyd, S. & Jacobson, V., Random Early Detection gateways for Congestion Avoidance, IEEE/ACM Transactions on Networking, 1: 4 (1993) 397-413.
- [67] Floyd, S., & Paxson, V., Difficulties in simulating the internet, IEEE/ACM Transactions on Networking, 9:4 (2001) 392-403.
- [68] Fomenkov, M., Keys, K., Moore, D., & Claffy, K.C., Longitudinal study of Internet traffic in 1998-2003, Proceedings of the Winter International Symposium on Information and Communication Technologies (Dublin, Ireland, 2004) pp. 1-6.
- [69] Fowler, H.J. & Leland, W.E., Local area network characteristics, with implications for broadband network congestion management, IEEE Journal on Selected Areas in Communications, 9:7 (1991) 1139-1149.
- [70] Fraleigh, C., Moon, S., Lyles, B., Cotton, C., Khan, M., Moll, D., Rockell, R., Seely, T., & Diot, C., Packet-level traffic measurements from the Sprint IP backbone, IEEE Network, 17:6 (2003) 6-16.
- [71] Frazer, K.D., NSFNET: A Partnership for High-Speed Networking, Final Report 1987-1995, Merit Network, Inc. (1995).
- [72] Fukś, H. & Lawniczak, A., Performance of data networks with random links, Mathematics and Computers in Simulation, 51:1 (1999) 101-117.
- [73] Fukuda, K., Numes Amaral, L.A., & Stanley, H.E., Similarities between communication dynamics in the Internet and the autonomic nervous system, Europhys. Lett., 62 (2003) 189-195.
- [74] Gábor, S. & Csabai, I.J., The analogies of highway and computer network traffic, Physica A, 307:3-4 (2002) 516-526.
- [75] Ganesh, A., Massoulie, L., Towsley, D., The effect of network topology on the spread of epidemics, in Proceedings of INFOCOM 2005. 24th Annual Joint Conference of the IEEE Computer and Communications Societies, 2 (Miami, 2005) 1455-1466.
- [76] Gao, J.B. & Rubin, I., Multiplicative multifractal modeling of long-range-dependent network traffic, Intl. J. of Comm. Sys., 14:8 (2001) 783-801.
- [77] Gibson, W., Neuromancer (Ace Books, New York, 1984).
- [78] Gilbert, A.C., Willinger, W., & Feldmann, A. Scaling analysis of conservative cascades, with applications to network traffic, IEEE Transactions on Information Theory, 45:3 (1999) 971-991.
- [79] Gong, W.B., Liu, Y., Misra, V., & Towsley, D., On the tails of Web file size distributions, in Proceedings of the 39th Allerton Conference on Communication, Control, and Computing, (Monticello, Illinois, 2001).
- [80] Guimerà, R., Arenas, A., Díaz-Guilera, A., & Giralt, F., Dynamical properties of model communication networks, Phys. Rev. E, 66 (2002) 026704.
- [81] Guo, L., Crovella, M., & Matta, I., How does TCP generate pseudo self-similarity, in Proceedings of the 9th IEEE/MASCOTS (Modeling, Analysis and Simulation of Computer and Telecommunication Systems) (Cincinnati, OH, 2001) pp. 215-223.
- [82] Hága, P., Pollner, P., Simon, G., Csabai, I.J., & Vattay, G., Self-generated self-similar traffic, Nonlinear Phenomena in Complex Systems, 6:4 (2003) 814-823.
- [83] Han, D.D., Liu, J.G., & Ma, Y.G., Fluctuation of the Download Network, Chin. Phys. Lett., 25 (2008) 765-768.
- [84] He, X., Papadopoulos, C., Heidemann, J., & Hussain, A., Spectral Characteristics of Saturated Links, University of Southern California Technical Report, USC-CSD-TR-827 (2004).
- [85] He, X., Papadopoulos, C., Heidemann, J., Mitra, U., Riaz, U., & Hussain, A., Spectral Analysis of Bottleneck Traffic, University of Southern California Technical Report, USC/CS Technical Report 05-853 (2005).
- [86] He,Y., Siganos, G., Faloutsos, M., & Krishnamurthy, S., “A Systematic Framework for Unearthing the Missing Links: Measurements and Impact” in 4th USENIX Symposium on Networked Systems Design & Implementation, (Cambridge, MA, 2007), pp. 187-200.
- [87] Hu, M.B., Wang, W.X., Jiang, R., Wu, Q.S., & Wu, Y.H., Phase transition and hysteresis in scale-free network traffic, Phys. Rev. E, 75 (2007) 036102.
- [88] Hu, M.B.,, Wang, W.X., Jiang, R., Wu, Q.S., & Wu, Y.H., The effect of bandwidth in scale-free network traffic, Europhys. Lett., 79 (2007) 14003.
- [89] Hussain, A., Heidemann, J., & Papadopolous, C., A framework for classifying denial of service attacks, in Proceedings of the 2003 Conference on Applications, Technologies, Architectures, and Protocols for Computer Communications (Karlsruhe, Germany, 2003) pp. 99-110.
- [90] Hussain, A., Heidemann, J., & Papadopolous, C., Identification of Repeated Attacks Using Network Traffic Forensics, USC/ISI Technical Report ISI-TR-2003-577b (2004).
- [91] Iliofotou, M. et. al., Graph-based P2P traffic classification at the Internet backbone, Proceedings of the 28th IEEE international conference on Computer Communications Workshops (Rio de Janeiro, 2009) pp. 37-42.
- [92] Jain, R. & Routhier, S., Packet trains: measurements and a new model for computer network traffic, IEEE Journal on Selected Areas in Communication, 4:6 (1986) 986-995.
- [93] Kaiser, G., A Friendly Guide to Wavelets, (Springer, Berlin, 1994).
- [94] Karagiannis, T., Molle, M., & Faloutsos, M., Long-Range Dependence: Ten Years of Internet Traffic Modeling, IEEE Internet Computing, 8:5 (2004) 57-64.
- [95] Karagiannis, T., Papagiannaki, K., & Faloutsos, M., BLINC: multilevel traffic classification in the dark,ACM/ SIGCOMM ComComm Review, 35:4 (2004) 229-240
- [96] Karagiannis, T., Broido, A., Faloutsos, M. & Claffy, K.C., Transport layer identification of P2P traffic, Proceedings of the 4th ACM SIGCOMM conference on Internet measurement (Taromina, 2004) pp. 121-134.
- [97] Katabi, D. & Blake, C., Inferring Congestion Sharing and Path Characteristics from Packet Interarrival Times, MIT Technical Report, MIT-LCSTR-828 (2001).
- [98] Kerner, B.S., & Rehborn, H., Experimental Properties of Phase Transitions in Traffic Flow, Phys. Rev. Lett., 79 (1997) 4030-4033.
- [99] Khalil, K.M., Luc, K.Q., & Wilson, D.V., LAN traffic analysis and workload characterization, Proceedings of the 15th Conference on Local Computer Networks (Minneapolis, MN, 1990) pp. 112-122.
- [100] Kim, H. et. al., Internet traffic classification demystified: myths, caveats, and the best practices, Proceedings of the 2008 ACM CoNEXT Conference, (Madrid, 2008) Article 11.
- [101] Kim, J.H., Radhakrishnan, S., Dhall, S.K., Measurement and analysis of worm propagation on Internet network topology, in Proceedings of the 13th International Conference on Computer Communications and Networks (Chicago, 2004) pp. 495-500.
- [102] Krioukov, D., Chung, F., Claffy, K.C., Fomenkov, M., Vespignani, A., & Willinger, W., The Workshop on Internet Topology (WIT) Report, ACM SIGCOMM ComComm. Rev, 37:1 69-73 (2007).
- [103] Krishnamurthy, B. & Willinger, W., What are our standards for validation of measurement-based networking research?, Performance Evaluation Review, 36:2, 64-69 (2008).
- [104] Kushida, T., An empirical study of the characteristics of Internet traffic, ComComm., 22:17 (1999) 1607-1618.
- [105] Lévy-Véhel, J. & Riedi, R., Fractional Brownian motion and data traffic modelling, in Fractals in Engineering: New Trends in Theory and Applications, edited by J Lévy-Véhel & E Lutton, (Springer-Verlag, Berlin, 1997) pp. 185-202.
- [106] López, L. & Sanjuán, M., Defining strategies to win in the Internet market, Physica A, 301:4 (2001) 512-534.
- [107] López, L., Almendral, J.A., & Sanjuán, M., Complex networks and the WWW market, Physica A, 324:4 (2003) 754-758.
- [108] Lakhina, A., Papagiannaki, K., Crovella, M.E., Diot, C., Kolaczyk, E., & Taft, N., Structural analysis of network traffic flows, Performance Evaluation Review, 32:1 (2004) 61-72.
- [109] Lakshman, T.V. & Madhow, U., The performance of TCP/IP for networks with high bandwidth-delay products and random loss, IEEE/ACM Transactions on Networks, 5:3 (1997) 336-350.
- [110] Lan, K. & Heidemann, J., On the correlation of Internet flow characteristic, University of Southern California Information Sciences Institute Technical Report, ISI-TR-574, USC/ISI, (2003).
- [111] Lan, K. & Heidemann, J., A measurement study of correlations of Internet flow characteristics, Computer Networks, 50:1 (2006) 46-62.
- [112] Lawniczak, A.T. & Tang, X.W., Network traffic behaviour near phase transition point, Eur. Phys. J. B, 50:2 (2006) 231-236.
- [113] Lawniczak, A.T. & Tang, X.W., Packet Traffic Dynamics Near Onset of Congestion in Data Communication Network Model, Acta Physica Polonica B, 37:5 (2006) 1579:1604.
- [114] Lee, C.Y., Higher-order correlations in data network traffic, J. Korean Phys. Soc., 45:6 (2004) 1664-1670.
- [115] Leland, W.E., & Wilson, D.V., High time-resolution measurement and analysis of LAN traffic: Implications for LAN interconnection, Proceedings IEEE lNFOCOM ’91 (Bal Harbour, Florida, 1991) pp. 1360-66.
- [116] Leland, W.E., Taqqu, M.S., Willinger, W., & Wilson, D.V., On the self-similar nature of Ethernet traffic (extended version) IEEE/ACM Transactions on Networking, 2:1 (1994) 1-15.
- [117] Li, L. & Lee, G., DDoS Attack Detection and Wavelets, Telecom. Sys., 28:4 (2005) 435-451.
- [118] Li, L., Alderson, D.L., Willinger, W., & Doyle, J., A first principles approach to understanding the Internet’s router-level topology, ACM SIGCOMM ComComm. Rev, 34:4, 3-14 (2004).
- [119] Li, L., DL Alderson, Willinger, W., & Doyle, J., Towards a theory of scale-free graphs: Definition, properties, and implications, Internet Mathematics, 2:4, 431-523 (2006).
- [120] Low, S.H., Paganini, F., Wang, J.T., & Doyle, J.C., Linear stability of TCP/RED and a scalable control, Computer Networks, 43:5 (2003) 633-647.
- [121] Mahadevan, P., Krioukov, D., Fomenkov, M., Huffaker, B., Dimitropolous, X., Claffy, K.C., & Vahdat, A., Lessons from three views of the Internet topology preprint arXiv:cs/0508033 (2005).
- [122] Mandelbrot, B.B., Long-run linearity, locally Gaussian processes, H-spectra and infinite variances, Intl. Econ. Rev., 10 (1969) 82-111.
- [123] Mathis, M., Semke, J., Madhavi, J., & Ott, T., The Macroscopic Behavior of the TCP Congestion Avoidance Algorithm, ACM SIGCOMM ComComm. Rev., 27:3 (1997) 67-82.
- [124] Maurer, S.M. & Huberman, B.A., Competitive dynamics of web sites, Journal of Economic Dynamics and Control, 27:12 (2003) 2195-2206.
- [125] MAWI, Widely Integrated Distributed Environment (WIDE) Project, Kanagawa, Japan, MAWI Working Group Traffic Archive (WIDE) Backbone traffic traces) http://mawi.wide.ad.jp/mawi/
- [126] Meloni, S., Goméz-Gardeñas, J., Latora, V., & Moreno, Y., Scaling Breakdown in Flow Fluctuations on Complex Networks, Phys. Rev. Lett., 100 (2008) 208701
- [127] Misra, V., Gong, W.B., & Towsley, D., Fluid-based analysis of a network of AQM routers supporting TCP flows with an application to RED, ACM/SIGCOMM ComComm Review, 30:4 (2000) 151-160.
- [128] Mitzenmacher, M., A brief history of generative models for power law and lognormal distributions, Internet Mathematics, 1:2, 226-251 (2004).
- [129] Mitzenmacher, M., Dynamic models for file sizes and double Pareto distributions, Internet Mathematics, 1:3, 305-333 (2004).
- [130] Mitzenmacher, M., Editorial: The future of power law research , Internet Mathematics, 2:4, 525-534 (2005).
- [131] Moore, A. & Papagiannaki, K., Toward the accurate identification of network applications, in Passive and Active Network Measurement edited by Dovrolis, C. (Springer, Berlin, 2005) pp. 41-54.
- [132] Moore, D., Paxson, V., Savage, S., Shannon, C., Staniford, S., & Weaver, N., Inside the Slammer Worm, IEEE Security & Privacy, 1:4 (2003) 33-39.
- [133] Moore,D., Shannon, C., Voelker, G., & Savage, S., Internet Quarantine: Requirements for Containing Self-Propagating Code, in Proceedings of INFOCOM 2003, 3 (San Francisco ,2003) pp.1901-1910.
- [134] Moreno, Y., Gomez, J.B., & Pacheco, A.F., Instability of scale-free networks under node-breaking avalanches, Europhys. Lett., 58 (2002) 630-636.
- [135] Moreno, Y., Pastor-Satorras, R., Váquez, A., & Vespignani, A., Critical load and congestion instabilities in scale-free networks, Europhys. Lett., 62 (2003) 292-298.
- [136] Mori, T., Kawahara, R., Naito, S., & Goto, S., On the Characteristics of Internet Traffic Variability: Spikes and Elephants, Proceedings of the 2004 International Symposium on Applications and the Internet (Tokyo, Japan, 2004) pp. 99-106.
- [137] Moses, M.E., Forrest, S., Davis, A.L., Lodder, M.A., & Brown, J.H., Scaling theory for information networks, J. Royal Soc. Interface, 5:29, (2008) 1469-1480.
- [138] Motter, A.E. & Lai, Y.C., Cascade-based attacks on complex networks, Phys. Rev. E, 66 (2002) 065102.
- [139] Mukherjee, A., On The Dynamics and Significance of Low Frequency Components of Internet Load, University of Pennsylvania Technical Reports, MS-CIS-92-83 (1992).
- [140] Mukherjee, G. & Manna, S., Phase transition in a directed traffic flow network, Phys. Rev. E, 71 (2005) 066108.
- [141] Newman, M.E.J., Scientific collaboration networks. I. Network construction and fundamental results, Phys. Rev. E, 64 (2001) 016131.
- [142] Newman, M.E.J., The structure and function of complex networks, SIAM Review, 45 (2003) 167-256.
- [143] Nievergelt, Y., Wavelets Made Easy, (Springer, Berlin, 1999).
- [144] Ohira, T. & Sawatari, R., Phase transition in a computer network traffic model, Phys. Rev. E, 58 (1998) 193-195.
- [145] Owezarski, P., & Larrieu, N., Internet Traffic Characterization - An Analysis of Traffic Oscillations, in High Speed Networks and Multimedia Communications edited by MM Freire, P Lorenz, & M Lee, (Springer, Berlin, 2004) pp. 96.
- [146] Padhye, J., Firoiu, V., Towsley, D., & Kurose, J., Modeling TCP Reno performance: a simple model and its empirical validation, IEEE/ACM Transactions on Networks, 8:2 (2000) 133-145.
- [147] Papagiannaki, K., Taft, N., Bhattacharyya, S., Thiran, P., Salamatian, K. & Diot, C., A pragmatic definition of elephants in internet backbone traffic, Proceedings of the 2nd ACM SIGCOMM Workshop on Internet Measurement (Marseille, France, 2002) pp. 175-176.
- [148] Papagiannaki, K., Taft, N., Zhang, Z., & Diot, C., Long-term forecasting of Internet backbone traffic, IEEE Transactions on Neural Networks, 16:5 (2005) 1110-1124.
- [149] Park, K. & Willinger, W., Self-similar network traffic: an overview, in Self-Similar Network Traffic and Performance Evaluation, edited by Park, K. & Willinger, W. (John Wiley & Sons, New York, 2000) pp. 1.
- [150] Park, K., Kim, G., & Crovella, M.E., The protocol stack and its modulating effect on self-similar traffic, in Self-Similar Network Traffic and Performance Evaluation, edited by Park, K. & Willinger, W., (John Wiley & Sons, New York, 2000) pp. 349.
- [151] Park, K., Kim, G., & Crovella, M.E., On the relationship between file sizes, transport protocols, and self-similar network traffic, in Proceedings of the Fourth International Conference on Network Protocols (ICNP’96) (Columbus, OH, 1996) pp. 171-180.
- [152] Parziale, L., Britt, D.T., Davis, C., Forrester, J., Liu, W., Matthews, C., & Rosselot, N., TCP/IP Tutorial and Technical Overview, IBM: Internal Technical and Support Organization (2006).
- [153] Pastor-Satorras, R. & Vespignani, A., Epidemic spreading in scale-free networks, Phys. Rev. Lett., 86 (2001) 3200-3203.
- [154] Pastor-Satorras, R. & Vespignani, A., Evolution and Structure of the Internet: A Statistical Physics Approach, (Cambridge University Press, New York, 2004).
- [155] Paxson, V., Growth trends in wide-area TCP connections, IEEE Network, 8:4 (1994) 8-17.
- [156] Paxson, V., Strategies for sound Internet measurement in Proceedings of the 4th ACM SIGCOMM conference on Internet measurement, (Sicily, Italy, 2004) pp. 263-271.
- [157] Paxson, V., & Floyd, S., Wide area traffic: the failure of Poisson modeling, IEEE/ACM Transactions on Networking, 3:3 (1995) 226-244.
- [158] Percival, D.B. & Walden, A.T., Wavelet Methods for Time Series Analysis, (Cambridge University Press, New York, 2000).
- [159] Ranjan, P., Abed, E.H., & La, R.J., Nonlinear instabilities in TCP-RED, IEEE/ACM Transactions on Networking, 12:6 (2004) 1079-1092.
- [160] Stanford SLAC PingER (Ping end-to-end reporting) Project www-iepm.slac.stanford.edu/pinger/
- [161] Riedi, R. & Lévy-Véhel, J., TCP traffic is multifractal: A numerical study, preprint (1997).
- [162] Roberts, J.W., Traffic theory and the Internet, IEEE Communications Magazine, 39:1 (2001) 94-99.
- [163] Roughan, M., Greenberg, A., Kalmanek, C., Rumsewicz, M., Yates, J., & Zhang, Y., Experience in measuring backbone traffic variability: models, metrics, measurements and meaning, in Proceedings of the 2nd ACM SIGCOMM Workshop on Internet Measurement (Marseille, France, 2002) pp. 91-92.
- [164] Roughan, M., Li, J., Bush, R., Mao, Z.Q., & Griffin, T., Is BGP Update Storm a Sign of Trouble: Observing the Internet Control and Data Planes During Internet Worms, in Proceedings of IEEE SPECTS’06 (Calgary, Alberta, 2006).
- [165] Shoch, J.F., & Hupp, J.A., Measured performance of an Ethernet local network, Communications of the ACM, 23:12 (1980) 711-721.
- [166] Shan, X.M., Wang, L., Ren, Y., Yuan, J., & Song, Y.H., Advances in the research of Internet complexity, Journal of Beijing University of Posts and Telecommunications, 29:1 (2006) 1-8 (in Chinese).
- [167] Shirow, M., The Ghost In The Shell (Kokaku Kidotai), (Kodansha, Tokyo, 1991).
- [168] Sikdar, B. & Vastola, K., The effect of TCP on the self-similarity of network traffic, in Proceedings of the Conference of Information Science Systems, John Hopkins University, (Baltimore, MD, 2001).
- [169] Sikdar, B. & Vastola, K., On the contribution of TCP to the self-similarity of network traffic in Evolutionary Trends of the Internet, (Springer, Berlin, 2001) pp. 596.
- [170] Smith, R.D., Data traffic dynamics and saturation on a single link, International Journal of Computer Systems Science & Engineering, 3:1, 11-16 (2009).
- [171] Solé, R. & Valverde, S., Information transfer and phase transitions in a model of internet traffic, Physica A, 289:4 (2001) 595-605.
- [172] Solé, R. & Valverde, S., Self-organized critical traffic in parallel computer networks, Physica A, 312:4 (2002) 636-648.
- [173] Strogatz, S.H., Exploring complex networks, Nature, 410 (2001) 268-276.
- [174] Tadaki, S., Long-Term Power-Law Fluctuation in Internet Traffic, J. Phys. Soc. Japan, 76 (2007) 044001.
- [175] Tadić, B. & Thurner, S., Information super-diffusion on structured networks, Physica A, 332 (2004) 566-584.
- [176] Tadić, B. & Thurner, S., Search and topology aspects in transport on scale-free networks, Physica A, 346:2 (2005) 183-190.
- [177] Tadić, B., Thurner, S., & Rodgers, G.J., Traffic on complex networks: Towards understanding global statistical properties from microscopic density fluctuations, Phys. Rev. E, 69 (2004) 036102.
- [178] Tadić, B., Thurner, S., & Rodgers, G.J., Transport on complex networks: flow, jamming and optimization, International Journal of Bifurcation and Chaos, 17:7 (2007) 2363-2385.
- [179] Takayasu, M., Takayasu, H., & Fukuda, K., Origin of critical behavior in Ethernet traffic, Physica A, 287:2 (2000) 289-301.
- [180] Takayasu, M., Takayasu, H., & Fukuda, K., Dynamic phase transition observed in the Internet traffic flow, Physica A, 277:2 (2000) 248-255.
- [181] Takayasu, M., Takayasu, H., & Sato, T., Critical behaviors and 1/f noise in information traffic, Physica A, 233:3 (1996) 824-834.
- [182] Takayasu, M., Takayasu, H., & Tretyakov, A.Y., Phase transition in a computer network model, Physica A, 253:1 (1998) 315-322.
- [183] Taqqu, M.S., Teverovsky, V., & Willinger, W., Is network trac self-similar or multifractal, Fractals, 5 (1997) 63-73.
- [184] Thompson, K., Miller, G.J., & Wilder, R., Wide-area Internet traffic patterns and characteristics, IEEE Network, 11:6 (1997) 10-23.
- [185] Uhlig, S., Non-stationarity and high-order scaling in TCP flow arrivals: a methodological analysis, ACM Comm. Rev., 34:2 (2004) 9-24.
- [186] Veitch, D., Hohn, N., & Abry, P., Multifractality in TCP/IP traffic: the case against, Computer Networks, 48:3 (2005) 293-313.
- [187] Veres, A. & Boda, M., The chaotic nature of TCP congestion control in the Proceedings of IEEE INFOCOM 2000, 3 (Tel-Aviv, Brazil, 2000) pp. 1715-1723.
- [188] Veres, A., Kenesi, Z., Molnár, S., & Vattay, G., On the propagation of long-range dependence in the Internet, in ACM SIGCOMM ComComm. Rev., 30:4 (2000) 243-254.
- [189] Vinge, V., Signs of the Singularity, IEEE Spectrum, 45:6 (2008) 76-82.
- [190] Wang, Y.S. & Wu, H., Physica A, Dynamics of a cooperation-competition model for the WWW market, 339:4 (2004) 609-620.
- [191] Wang, Y.S. & Wu, H., Physica A, Dynamics of a macroscopic model characterizing mutualism of search engines and web sites, 363:2 (2006) 537-550.
- [192] Wang, W.X., Yin, C.Y., Yan, G., & Wang, B.H., Integrating local static and dynamic information for routing traffic, Phys. Rev. E, 74 (2006) 016101.
- [193] Wang, Y., Chakrabarti, D., Wang, C.X., Faloutsos, C., Epidemic Spreading in Real Networks: An Eigenvalue Viewpoint, in Proceedings of the 22nd International Symposium on Reliable Distributed Systems (SRDS’03) (Florence, 2003) pp. 25-44.
- [194] Watts, D.J. & Strogatz, S.H., Collective dynamics of ‘small-world’ networks, Nature 393 (1998) 440442
- [195] Whitman, W., When I heard the Learn’d Astronomer, Leaves of Grass, (Bantam, New York, 1983).
- [196] Willinger, W., Taqqu, M.S., Sherman, R., & Wilson, D.V., Self-similarity through high-variability: statistical analysis of Ethernet LAN traffic at the source level, ACM SIGCOMM ComComm. Rev., 25:4 (1995) 100-113.
- [197] Willinger, W., Taqqu, M.S., Sherman, R., & Wilson, D.V., Self-Similarity through High-Variability: Statistical Analysis of Ethernet LAN Traffic at the Source Level, IEEE/ACM Transactions on Networking, 5:1 (1997) 71-86.
- [198] Willinger, W., Paxson, V., & Taqqu, M.S., Self-similarity and heavy tails: Structural modeling of network traffic, in A Practical Guide To Heavy Tails: Statistical Techniques and Applications edited by RF Adler, RE. Feldman, & MS. Taqqu, (Birkhauser, Boston, 1998), pp. 27-53.
- [199] Willinger, W., Govindan, R., Jamin, S., Paxson, V., & Shenker, S., Scaling phenomena in the Internet: Critically examining criticality, Proc. Natl. Acad. of Sci., 99 (2002) 2573-2580.
- [200] Willinger, W., Paxson, V., Riedi, R., & Taqqu, M.S., Long-range dependence and data network traffic in Theory and Applications of Long-range Dependence edited by Doukhan, P., Oppenheim, G., & Taqqu, M.S. (Birkhauser, Boston, 2003) pp. 373-408.
- [201] Willinger, W., & Paxson, V., Where Mathematics Meets the Internet, Notices of the AMS, 45:8 (1998) 961-970.
- [202] Willinger, W., Alderson, D., & Doyle, J.C., “Mathematics and the Internet: A Source of Enormous Confusion and Great Potential”, Notices of the AMS, 56:5, p. 586-599.
- [203] Woolf, M., Arrowsmith, D.K., Mondragón, R.J., & Pitts, J.M., Optimization and phase transitions in a chaotic model of data traffic, Phys. Rev. E, 66 (2002) 046106.
- [204] Yan, G. et. al., Epidemic spread in weighted scale-free networks, Chinese Physics Letters, 22:2, (2005) 510-513.
- [205] Yan, G., Zhou, T., Hu, B., Fu, Z.Q., & Wang, B.H., Efficient routing on complex networks, Phys. Rev. E, 73 (2006) 046108.
- [206] Yin, C.Y., Wang, B.H., Wang, W.X., Yan, G., & Yang, H.J., Traffic dynamics based on an efficient routing strategy on scale free networks, Eur. Phys. J. B, 49:2 (2006) 205-211.
- [207] Yuan, J. & Mills, K.J., Exploring Collective Dynamics in Communication Networks, J. Res. Natl. Inst. Stand. Technol., 107:2 (2002) 179-191.
- [208] Yuan, J. & Mills, K.J., A cross-correlation-based method for spatialtemporal traffic analysis, Performance Evaluation, 61:2 (2005) 163-180.
- [209] Yuan, J. & Mills, K.J., Macroscopic Dynamics in Large-Scale Data Networks, in Complex Dynamics in Communication Networks, (Springer, Berlin, 2005) pp. 191-211.
- [210] Yuan, J. & Mills, K.J., Monitoring the macroscopic effect of DDoS flooding attacks, IEEE Transactions on Dependable and Secure Computing, 2:4 (2005) 324-355.
- [211] Yuan, J. & Mills, K.J., Simulating Timescale Dynamics of Network Traffic Using Homogeneous Modeling, J. Res. Natl. Inst. Stand. Technol., 111:3 (2006) 227-242.
- [212] Yuan, J., Yong, R., & Shan, X.M., Analysis of a type of computer network cellular automata model, Acta Physica Sinica, 49:3 (2000) 398-402 (in Chinese).
- [213] Yuan, J., Ren, Y., Liu, F., & Shan, X.M., Phase transition and collective correlation behavior in the complex computer network, Acta Physica Sinica, 50:7 (2001) , 1221-1225 (in Chinese).
- [214] Yuan, J., Wang, J., Xu, Z.X., & Li, B., Time-dependent collective behavior in a computer network model, Physica A, 368:1 (2006) 294-304.
- [215] Zhao, L., Lai, Y.C., Park, K.H., & Ye, N., Onset of traffic congestion in complex networks, Phys. Rev. E, 71 (2005) 026125.
- [216] Zhu, D.P., Gritter, M., & Cheriton, D.R., Feedback based routing, ACM SIGCOMM ComComm. Rev., 33:1 (2003) 71-76.
- [217] Zhu, X.Y., Liu, Z.H., & Tang, M., Detrended Fluctuation Analysis of Traffic Data, Chin. Phys. Lett., 24 (2007) 2142-2145.