Determination of the Neutrino Mass Hierarchy at an Intermediate Baseline
Abstract
It is generally believed that neutrino mass hierarchy can be determined at a long baseline experiment, often using accelerator neutrino beams. Reactor neutrino experiments at an intermediate baseline have the capability to distinguish normal or inverted hierarchy. Recently it has been demonstrated that the mass hierarchy could possibly be identified using Fourier transform to the L/E spectrum if the mixing angle . In this study a more sensitive Fourier analysis is introduced. We found that an ideal detector at an intermediate baseline ( km) could identify the mass hierarchy for a mixing angle , without requirements on accurate information of reactor neutrino spectra and the value of .
pacs
13.15.+g, 14.60.Pq, 14.60.LmRecent results from solar, atmospheric, reactor and accelerator neutrino experiments all show that neutrinos are massive and they can oscillate from one type to another. Among all the six mixing parameters, three of them are known, two unknowns, and one of them, the mass-squared difference , defined as , is only known to be ( C.L.) from accelerator neutrino experiments [1]. The question, if the mass hierarchy is normal () or inverted (), is not known now but is fundamental to particle physics.
For normal hierarchy (NH) or inverted hierarchy (IH), the neutrino mass-squared difference has the following relations:
| (1) |
In principle, the mass hierarchy can be determined by precision measurements of and . In fact it is extremely difficult since is only of , hence and have to be measured with a precision much better than 3 %.
Effects of mass hierarchy can be amplified by matter effects if the baseline is large enough, say several hundreds to thousands of kilometers. Such experiments often need accelerator-based neutrino beams and huge detectors. Proposals such as T2K [2, 3], Nova [4, 5, 3] and T2KK [6] have mass hierarchy sensitivity in the channel if is large enough (). In addition, they are affected by the (, ) degeneracy [7, 8]. At a magic baseline [9, 10], , the degeneracy can be canceled but it requires a very intensive source such as a neutrino factory or a beta-beam which will not be available in the near future. A method using atmospheric neutrinos [11, 12] with a baseline of and the neutrino energy of is sensitive to mass hierarchy for very small or even null value of , if the measurement precision of is better than 2%.
Method using reactor neutrino based intermediate baseline () experiments has been explored based on precision measurement of distortions of the energy spectrum due to non-zero [13, 14]. Recently, a study [15] shows a new method to distinguish normal or inverted hierarchy after a Fourier transform of the L/E spectrum of reactor neutrinos. It is observed that the Fourier power spectrum has a small shoulder next to the main peak, and their relative position can be used to determine the mass hierarchy. A¡°filter method¡± is used to improve the sensitivity to the mass hierarchy up to , if is known . Comparing to a normal L/E analysis, the Fourier analysis naturally separates the mass hierarchy information from uncertainties of the reactor neutrino spectra and other mixing parameters, which is critical for very small oscillations.
In this paper, we report that if a proper Fourier transform is applied and if all information is fully utilized, the capability of an intermediate baseline reactor experiment to determine the neutrino mass hierarchy can be improved for a smaller mixing angle without knowing . In the following, we will use a reactor neutrino spectrum to illustrate the method, but such a method can be generalized to other experiments.
For a reactor neutrino experiment, the observed neutrino spectrum at a baseline L, , can be written as
where is the electron antineutrino () energy, is the flux of from the reactor, is the interaction cross section of with matter, and is the survival probability.
The flux from the reactor can be parameterized as [16],
| (2) | |||||
where four exponential terms are contributions from isotopes 235U, 239Pu, 238U and 241Pu in the reactor fuel, respectively.
The leading-order expression for the cross section [17] of inverse- decay ( ) is
| (3) |
where is the positron energy when neutron recoil energy is neglected, and is the positron momentum. The survival probability of can be expressed as [18]
| (4) |
where , is the neutrino mass-squared difference () in eV2, is the neutrino mixing angle, is the baseline from reactor to detector in meters, and is the energy in MeV.
has three oscillation components, , and , corresponding to three oscillation frequencies in space, which are proportional to , respectively. Their relative amplitude(oscillation intensity), is about from a global fit [19] of mixing parameters as listed in Table 1. The oscillation component dominates the oscillation, while and , which are sensitive to the neutrino mass hierarchy, are suppressed by the small value of .
| parameter | best fit | 2 | 3 |
|---|---|---|---|
| 7.6 | 7.3-8.1 | 7.1-8.3 | |
| 2.4 | 2.1-2.7 | 2.0-2.8 | |
| 0.32 | 0.28-0.37 | 0.26-0.40 | |
| 0.50 | 0.38-0.63 | 0.34-0.67 | |
| 0.007 |
The observed neutrino spectrum in L/E space, taking the baseline L to be 60 km and all the other parameters from Table 1 except , is shown in Fig.1, together with that of no oscillation. For comparison, the oscillation spectrum without and are also shown. For a very small , a normal analysis on the L/E spectrum with binned data, which requires accurate knowledge on the neutrino energy spectra and much smaller binning than the energy resolution, is difficult for the mass hierarchy study.

Since neutrino masses all appear in the frequency domain as shown in Eq. 4, a Fourier transform of shall enhance the sensitivity to the mass hierarchy. The frequency spectrum can be obtained by the following Fourier sine transform(FST) and Fourier cosine transform(FCT):
| (5) |
where is the frequency, ; is the variable in L/E space, varying from to .
Since is a linear combination of , and , FST and FCT spectra can be divided into three components corresponding to , and respectively. Fig.2 shows the three components of the FST and FCT spectra together with full oscillation for both NH and IH cases. The oscillation frequency is proportional to , so we can scale the frequency to be and plot the spectra in axis of in the interested frequency range of . From Fig.2, we know that:

- 1.
and components dominate the FCT and FST spectra in the interested frequency range of since and are in this range, while is very weak since its oscillation frequency is in a much lower range. The FST and FCT spectra of are approximately the sum of and components which are sensitive to mass hierarchy.
- 2.
For NH, the FCT and FST spectra are left-shifted with respect to the spectra because ; while for IN, the spectra are right-shifted because .
- 3.
The peak of FCT spectrum corresponds to the zero point of FST spectrum. This feature is helpful to identify the position of and , without knowing their accurate values .
- 4.
For FCT spectrum, and components have similar shapes with the peak around and , respectively, and two valleys on each side of the peak. The amplitude of to that of has a ratio of about 1:2 determined by tan. The shapes of and are left-right symmetric with respect to their peaks (mirror symmetric). This symmetry is broken for as an approximate sum of and in different ways for NH and IH. For NH, the peak of is at the left of the valley of , while for IH, the peak of is at the right of the valley of . This feature can be used to distinguish NH and IH.
- 5.
For FST spectrum, the shapes of and are positive-negative symmetric with respect to zero (rotation symmetric) around and , respectively. This symmetry is broken for in different ways for NH and IH. For NH, the peak of is at the valley position of , while for IH, the valley of is at the peak position of . This feature can be also used to distinguish NH and IH.
As discussed above and shown in Fig. 2, the normal or inverted mass hierarchy can be distinguished by the symmetry breaking features of the FCT and FST spectra. To quantify these features, two parameters, RL and PV, are introduced as the following:
| (6) |
where RV is the amplitude of the right valley and LV is the amplitude of the left valley in the FCT spectrum. P is the amplitude of the peak and V is the amplitude of the valley in the FST spectrum. From the above discussion, we know
| (7) |
The values of and as well as the shapes of FCT and FST spectra depend on the baseline and neutrino mixing parameters. Parameters such as , , and are relatively well known, hence only small uncertainties are introduced. The baseline and are more important and are discussed below.
- 1.
Baseline determines the oscillation cycles. To maximize the symmetry breaking of FCT and FST spectra, we scan the baseline length and find that the peak (valley)of spectrum lays on the valley (peak) of spectrum around 60 km. The widthes of peaks and valleys of the Fourier spectra, which are proportional to 1/L, are also determined by baseline. In an extreme case, the peak and valley of and spectra all become -functions at infinite baseline, hence are well separated from each other. In fact, this is already the case at 200 km and the mass hierarchy can be determined by looking at the position of the smaller peak ( component). If it is on the left side of the main peak ( component), it is NH. Otherwise it is IH. However, since the neutrino flux from reactors is proportional to , shorter baseline, say at 60 km, is the best from an experimental point of view. The actual optimum baseline can be determined by taking into account both statistical and systematical errors.
- 2.
determines the amplitude of the Fourier spectra of and . At , and components will vanish and no features can be used to discriminate the mass hierarchy. A minimum value of to distinguish NH and IH experimentally will be analyzed by taking into account possible experimental errors [20].
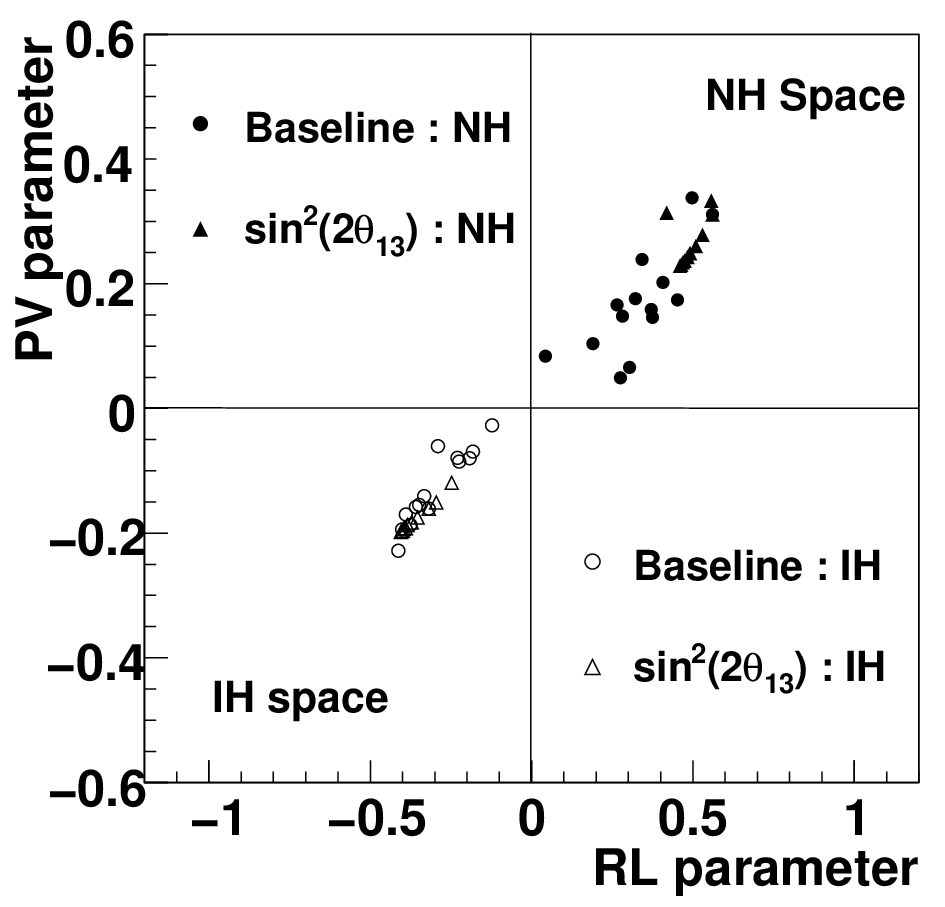
In order to understand the robustness of the discrimination method using FCT and FST spectra, values of baseline are scanned from 46 to 72 km; from 0.005 to 0.05. The resultant RL and PV values are well separated into two clusters, corresponding to the case of NH and IH respectively, as shown in Fig.3.
The FCT and FST spectra for are shown in Fig.4. Although a detailed experimental analysis of error contour is to be completed [20], the features of NH and IH are still very distinctive. On the FCT spectrum, a valley appears at the left of the prominent peak for IH, and a peak appears at the left of the valley for NH. On the FST spectrum, there is a clear valley for IH, while for NH it is a peak. In comparison, the Fourier power spectrum used in Ref. [15] is also shown in Fig.4. The FCT and FST method is more sensitive than the Fourier power spectrum method for a very small .
For even smaller , the main peak becomes less significant. For example, if the main peak is required to be twice higher than that of noise, must be greater than 0.005 in order to clearly identify the main peak, for a variety of neutrino energy spectra in a reasonable range.
For a realistic experiment in the near future, the energy resolution and statistics are of the most concern. At 60 km, has the least impact to the mass hierarchy determination. The energy resolution must be good enough not to smear the difference between and , which requires the energy resolution be better than . A detector with a mass at 10 kton level may be necessary, depending on the size of . If shortening the baseline, the noise in the Fourier spectra from oscillation increases, thus degrade the sensitivity. In the mean time requirements to the energy resolution and the detector size are relaxed. The optimization of the baseline as well as the energy resolution and detector size for different assumptions are undergoing.
In summary, the method to discriminate the mass hierarchy has been studied by using a Fourier sine(FST) and cosine(FCT) transform to the observed reactor neutrino L/E spectra. The FCT and FST spectra can separate and oscillation components from the large component in a specific range. Features of mass hierarchy are enhanced in this representation and more sensitive than that of the Fourier power spectrum at very small . We found that an ideal detector at an intermediate baseline ( km) could identify the mass hierarchy for a mixing angle , without requirements on accurate information of reactor neutrino spectra and the value of . A paper of a detailed analysis of experimental errors will be released soon [20]. Similar methods can be applied to other experiments using different neutrino sources, such as accelerator-based neutrino beams or atmospheric neutrinos.

References
- [1] P. Adamson et al. [MINOS Collaboration], arXiv:0806.2237 [hep-ex].
- [2] Y. Itow et al. [The T2K Collaboration], arXiv:hep-ex/0106019.
- [3] O. Mena, H. Nunokawa and S. J. Parke, Phys. Rev. D 75, 033002 (2007) [arXiv:hep-ph/0609011].
- [4] O. Mena, S. Palomares-Ruiz and S. Pascoli, Phys. Rev. D 73, 073007 (2006) [arXiv:hep-ph/0510182].
- [5] D. S. Ayres et al. [NOvA Collaboration], arXiv:hep-ex/0503053.
- [6] K. Hagiwara, N. Okamura and K. I. Senda, Phys. Rev. D 76, 093002 (2007) [arXiv:hep-ph/0607255].
- [7] H. Minakata and H. Nunokawa, JHEP 0110, 001 (2001) [arXiv:hep-ph/0108085].
- [8] V. Barger, D. Marfatia and K. Whisnant, Phys. Rev. D 65, 073023 (2002) [arXiv:hep-ph/0112119].
- [9] P. Huber and W. Winter, Phys. Rev. D 68, 037301 (2003) [arXiv:hep-ph/0301257].
- [10] A. Y. Smirnov, arXiv:hep-ph/0610198.
- [11] R. Gandhi, P. Ghoshal, S. Goswami and S. U. Sankar, arXiv:0805.3474 [hep-ph].
- [12] A. Samanta, arXiv:hep-ph/0610196.
- [13] S. T. Petcov and M. Piai, Phys. Lett. B 533, 94 (2002) [arXiv:hep-ph/0112074].
- [14] S. Choubey, S. T. Petcov and M. Piai, Phys. Rev. D 68, 113006 (2003) [arXiv:hep-ph/0306017].
- [15] J. Learned, S. T. Dye, S. Pakvasa and R. C. Svoboda, arXiv:hep-ex/0612022.
- [16] P. Vogel and J. Engel, Phys. Rev. D 39, 3378 (1989).
- [17] P. Vogel and J. F. Beacom, Phys. Rev. D 60, 053003 (1999) [arXiv:hep-ph/9903554].
- [18] S. M. Bilenky, D. Nicolo and S. T. Petcov, Phys. Lett. B 538, 77 (2002) [arXiv:hep-ph/0112216].
- [19] M. Maltoni, T. Schwetz, M. A. Tortola and J. W. F. Valle, New J. Phys. 6, 122 (2004) [arXiv:hep-ph/0405172].
- [20] L. Zhan et al., under preparation.